

Single-Cell Transcriptomic Profiling of Brain Cells in Newborn Rats Following Hypoxic Ischemic Encephalopathy
- PMID: 40799188
- PMCID: PMC12344624
- DOI: 10.1096/fj.202402891RR
Single-Cell Transcriptomic Profiling of Brain Cells in Newborn Rats Following Hypoxic Ischemic Encephalopathy
Abstract
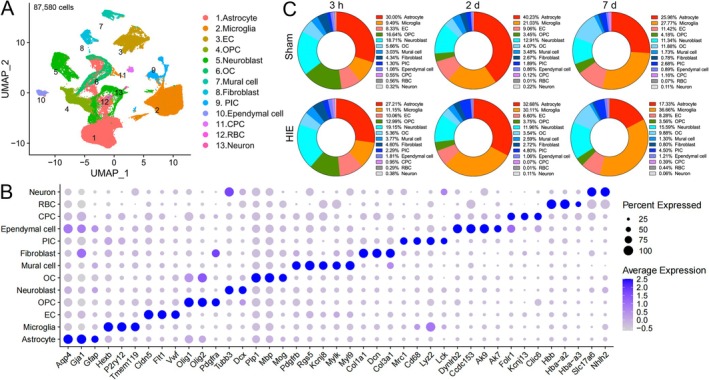
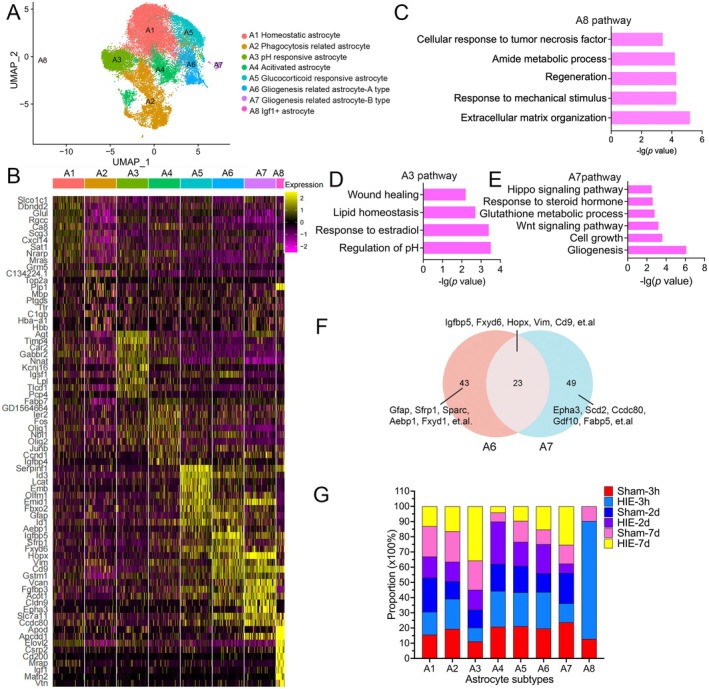
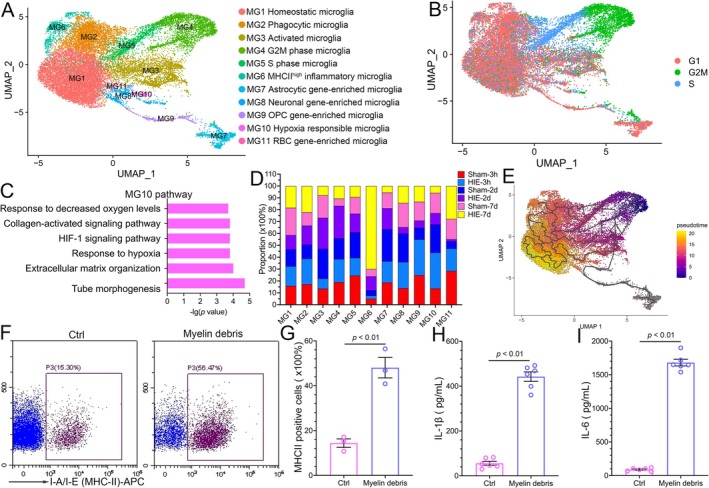
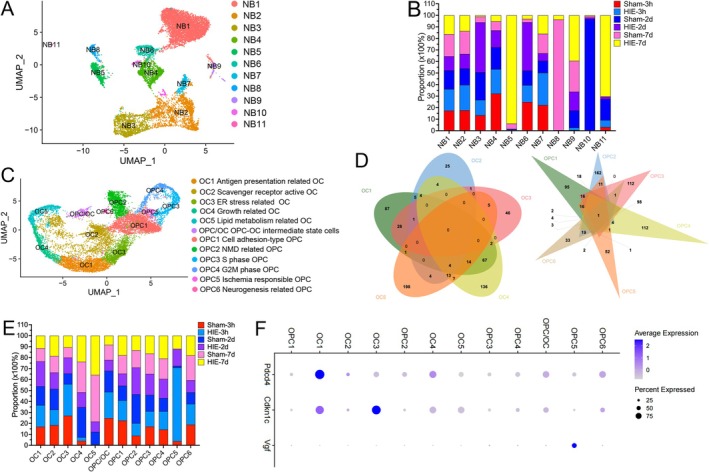
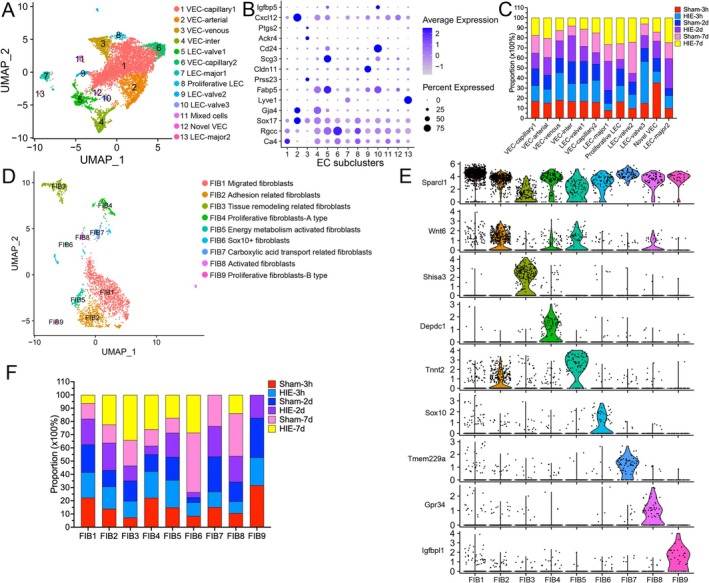
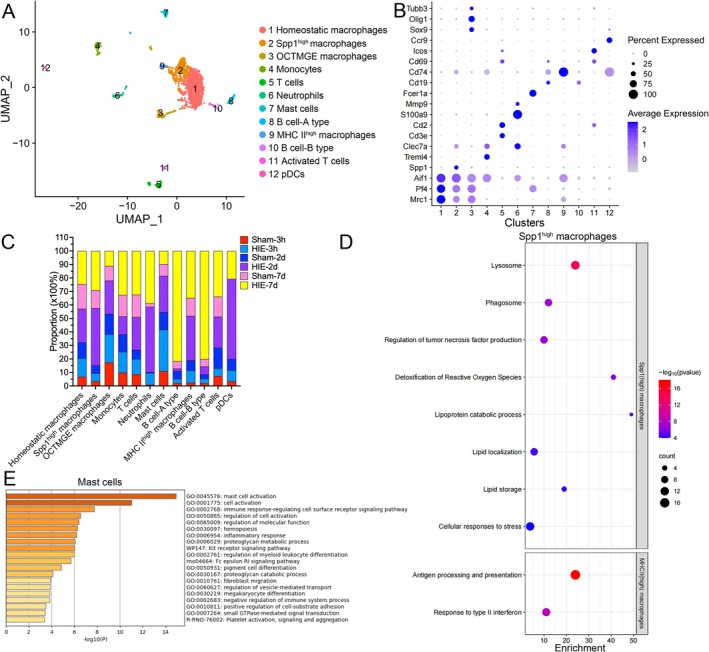
Neonatal hypoxic-ischemic encephalopathy (HIE) is a severe neurological condition associated with high rates of mortality or long-term disability. Despite its clinical significance, the detailed cellular mechanisms underlying HIE remain unclear. Single-cell RNA sequencing (scRNA-seq) has emerged as a powerful tool for investigating cellular heterogeneity across development, aging, and disease processes. However, no scRNA-seq studies have yet addressed neonatal HIE. In this study, we employed scRNA-seq to examine cellular heterogeneity during neonatal HIE. We analyzed a total of 87 580 high-quality brain cells to identify transcriptional changes associated with HIE. In the hyperacute phase, we observed astrocytes in response to tumor necrosis factors, involvement of microglia in phagocytosis, Stat3-mediated ischemic responses in oligodendrocyte precursor cells, and an increase in senescent lymphatic endothelial cells. In the acute phase, astrocytes were activated and involved in gliogenesis, while microglia proliferated. Neuroblasts were affected by metal ions, and oligodendrocytes decreased. In the subacute phase, astrocytes involved in inflammation and antigen presentation, while inflammatory microglia highly expressing MHC II were induced by the IL27 and type I interferon pathways and expanded. Additionally, peripheral immune cells played vital roles in HIE. Specifically, neutrophils infiltrated and expanded throughout all phases post-HIE. Spp1high macrophages, T cells, and plasmacytoid dendritic cells increased during the acute and subacute phases, and B cells expanded during the subacute phase. This study offers deep insights into the molecular alterations of key cell types following HIE, elucidating the pathological processes involved. These findings have significant implications for developing effective clinical strategies for managing HIE.
Keywords: HIE; ScRNA‐seq; hypoxic–ischemic encephalopathy; newborn rats; single cell RNA sequencing.
© 2025 The Author(s). The FASEB Journal published by Wiley Periodicals LLC on behalf of Federation of American Societies for Experimental Biology.
Conflict of interest statement
The authors declare no conflicts of interest.
Figures
Similar articles
-
Prescription of Controlled Substances: Benefits and Risks.2025 Jul 6. In: StatPearls [Internet]. Treasure Island (FL): StatPearls Publishing; 2025 Jan–. 2025 Jul 6. In: StatPearls [Internet]. Treasure Island (FL): StatPearls Publishing; 2025 Jan–. PMID: 30726003 Free Books & Documents.
-
Structural and Functional Effects of C5aR1 Antagonism in a Rat Model of Neonatal Hypoxic-Ischemic Encephalopathy.Dev Neurosci. 2025;47(2):112-126. doi: 10.1159/000539506. Epub 2024 May 25. Dev Neurosci. 2025. PMID: 38797164 Free PMC article.
-
Acupuncture for hypoxic ischemic encephalopathy in neonates.Cochrane Database Syst Rev. 2024 Dec 18;12(12):CD007968. doi: 10.1002/14651858.CD007968.pub3. Cochrane Database Syst Rev. 2024. PMID: 39692246
-
A Novel Non-Invasive Murine Model of Neonatal Hypoxic-Ischemic Encephalopathy Demonstrates Developmental Delay and Motor Deficits with Activation of Inflammatory Pathways in Monocytes.Cells. 2024 Sep 14;13(18):1551. doi: 10.3390/cells13181551. Cells. 2024. PMID: 39329733 Free PMC article.
-
Quantification of Diffusion Magnetic Resonance Imaging for Prognostic Prediction of Neonatal Hypoxic-Ischemic Encephalopathy.Dev Neurosci. 2024;46(1):55-68. doi: 10.1159/000530938. Epub 2023 May 10. Dev Neurosci. 2024. PMID: 37231858 Free PMC article. Review.
References
-
- Yang M., Wang K., Liu B., Shen Y., and Liu G., “Hypoxic‐Ischemic Encephalopathy: Pathogenesis and Promising Therapies,” Molecular Neurobiology 62 (2024): 2105–2122. - PubMed
-
- Ristovska S., Stomnaroska O., and Danilovski D., “Hypoxic Ischemic Encephalopathy (HIE) in Term and Preterm Infants,” Pril (Makedon Akad Nauk Umet Odd Med Nauki) 43 (2022): 77–84. - PubMed
-
- Neves D., Salazar I. L., Almeida R. D., and Silva R. M., “Molecular Mechanisms of Ischemia and Glutamate Excitotoxicity,” Life Sciences 328 (2023): 121814. - PubMed
MeSH terms
Grants and funding
LinkOut - more resources
Full Text Sources
Research Materials
Miscellaneous
