. 2025 Aug 8:18:2739-2752.
doi: 10.2147/DMSO.S535103. eCollection 2025.

4'-Methoxyresveratrol Improves Hepatic Insulin Resistance Induced by a High-Fat-Diet via Anti-Oxidative-Stress Activity

Affiliations

4'-Methoxyresveratrol Improves Hepatic Insulin Resistance Induced by a High-Fat-Diet via Anti-Oxidative-Stress Activity

Zhimei Zhang et al. Diabetes Metab Syndr Obes. .

Abstract

Background: Obesity and a high-fat diet (HFD) are key factors contributing to hepatic fat accumulation and type 2 diabetes mellitus (T2DM). Research indicates that oxidative stress induced by HFD mediates hepatic insulin resistance (HIR) through mechanisms such as promoting inflammation and lipid accumulation. Given that 4'-methoxyresveratrol (4-MR) exhibits remarkable anti-inflammatory and antioxidant activities, it is of great research significance to explore whether it can effectively counteract HFD-induced HIR by enhancing antioxidant stress.

Purpose: This study aimed to explore the effects of 4MR on liver oxidative damage and insulin sensitivity.

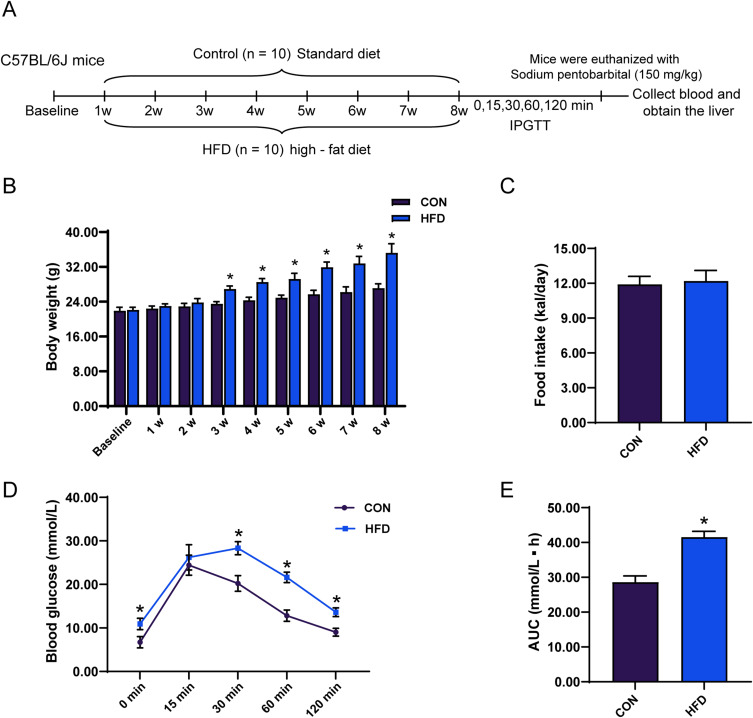
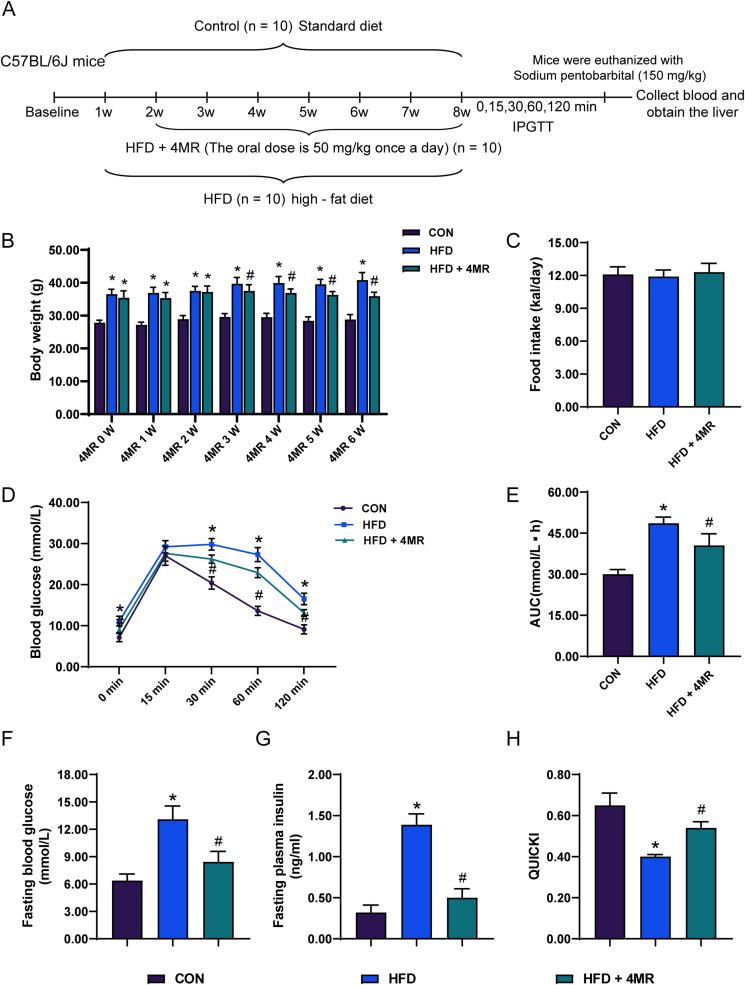
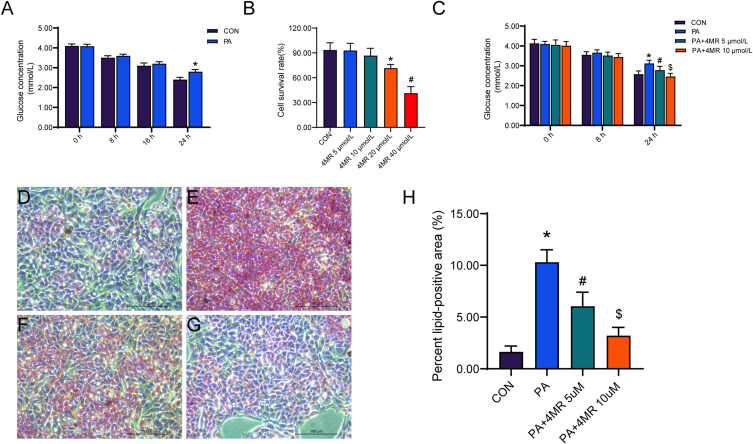
Methods: Mice were fed a HFD for 8 weeks, followed by an intraperitoneal glucose tolerance test to assess insulin resistance. The in-vivo experiments were divided into three groups, including the control group, the HFD group, and the HFD + 4MR group. After 6 weeks of 4MR treatment, blood and liver samples were analyzed for biochemical markers, lipid peroxidation, antioxidant capacity, and liver protein levels. Insulin-resistant HepG2 cells were treated with 4MR and evaluated for proliferation and toxicity.

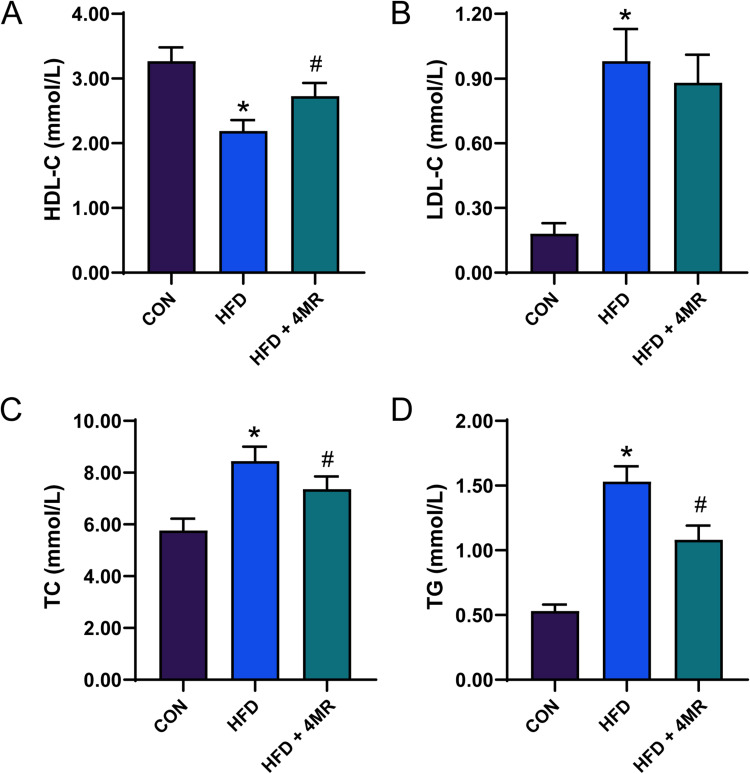
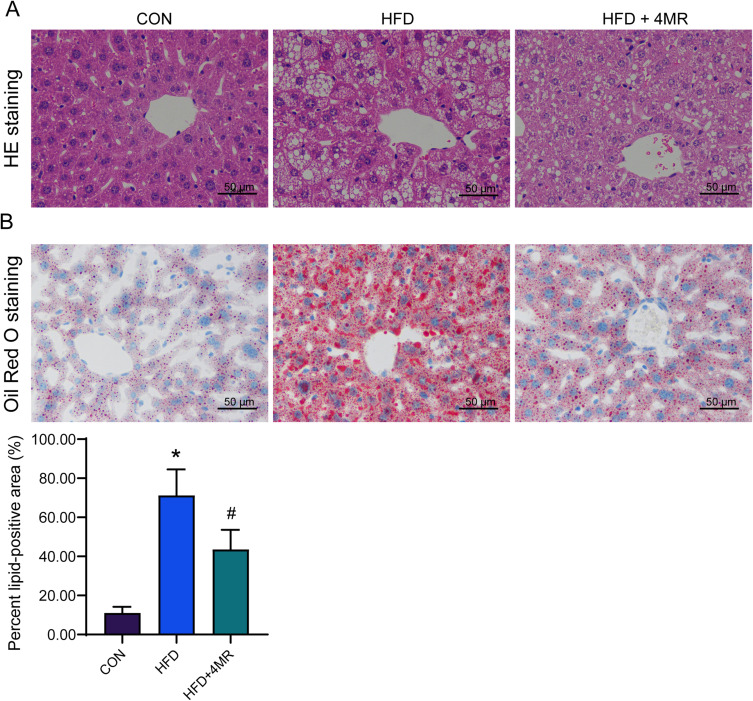
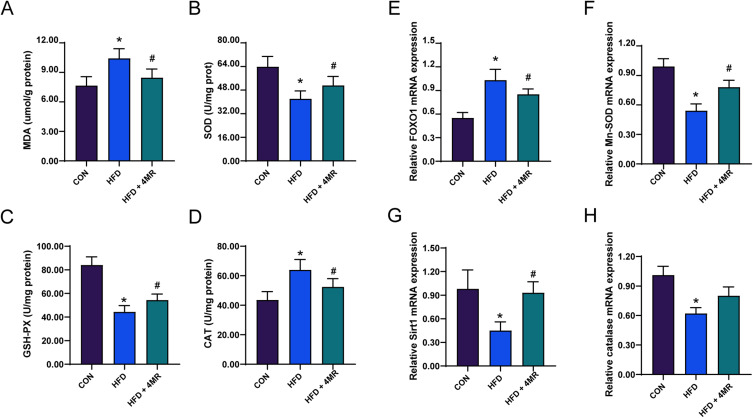
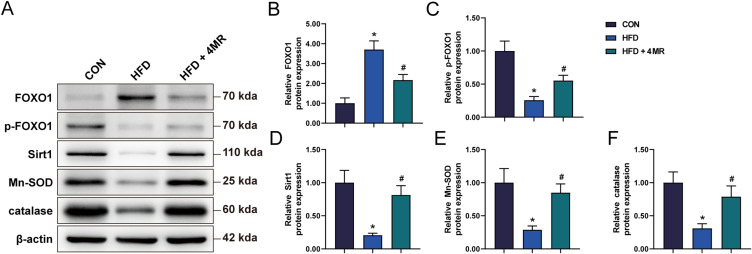
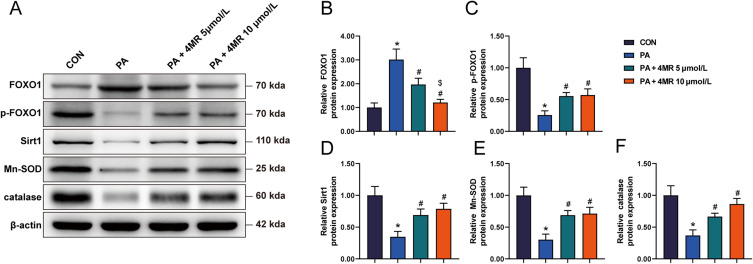
Results: 4MR reduced fasting blood glucose and lipid levels, improved insulin sensitivity, and decreased liver malondialdehyde levels, while increasing catalase and antioxidant enzyme activities. In both mice and HepG2 cells, 4MR increased Sirt1, p-FOXO1, and CAT expression levels and decreased FOXO1 expression levels.

Conclusion: 4MR alleviated hepatic oxidative stress, enhanced insulin sensitivity, and reduced glucose levels.

Keywords: 4′-methoxyresveratrol; anti-oxidative stress; blood glucose; hepatic; insulin resistanc.


Conflict of interest statement

The authors declare that they have no competing interests to declare.

Figures

Figure 1
Figure 1
Analysis of C57BL/6J mice following an 8-week high-fat diet regimen, including body weight, food consumption, and outcomes of the IPGTT. (A) Experimental flow chart for the Control and HFD groups. (B) Distinct fluctuations in body mass (n = 10), (C) dietary consumption trends (n = 10), (D) plasma glucose levels measured at the specified times of 0, 15, 30, 60, and 120 minutes post-ingestion of glucose (n = 10), and (E) the cumulative area under the glucose response curve (n = 10). The reported findings represent the average values ± standard error of the mean (SEM). An analytical assessment was carried out using the Student’s t-test. *Indicates a P value below 0.05 when contrasted with the control cohort.
Figure 2
Figure 2
Body weight and food intake of C57BL/6J mice after 4MR treatment for 6 weeks. (A) Flowchart of Modeling HFD Mice Treated with 4MR. (B) Analysis of body mass across the control, high-fat dietary, and metformin-administered cohorts (n = 10). (C) Examination of dietary consumption among the trio of groups post 6-week 4′-methoxyresveratrol (4MR) treatment (n = 10). (D) Plasma glucose concentrations at 0, 15, 30, 60, and 120 minutes following abdominal glucose administration for the control (CON), high-fat diet (HFD), and HFD plus 4MR cohorts (n = 10). (E) Calculation of the glucose concentration curve area for the respective groups (n = 10). (F) Assessment of preprandial glucose levels in each of the three cohorts (n = 10). (G) Evaluation of fasting serum insulin concentrations within the three study groups (n = 10). (H) Examination of the quantitative insulin sensitivity assessment index (QUICKI) amongst various cohorts (n = 10). The findings are presented as mean values with the standard deviation in parentheses. Statistical analyses were conducted via single-factor analysis of variance (ANOVA), followed by Bonferroni or Tamhane post-hoc procedures for examining the differences among groups. A star (*) indicates a P-value less than 0.05 when contrasted with the Control cohort, and a pound symbol (#) indicates a P-value below 0.05 when compared to the High-Fat Diet (HFD) cohort.
Figure 3
Figure 3
Blood lipid levels after 4MR intervention. (A) Levels of high-density lipoprotein cholesterol (n = 10), (B) Levels of low-density lipoprotein cholesterol (n = 10), (C) Total cholesterol levels (n = 10). (D) Concentrations of plasma triglycerides (n = 10). The presented data represent the mean values ± standard error. Statistical analyses were conducted via a single-factor analysis of variance (ANOVA) followed by Bonferroni or Tamhane post-hoc pairwise tests. A star (*) signifies P < 0.05 when contrasted with the control cohort, whereas a pound symbol (#) points to P < 0.05 in comparison to the cohort on a high-fat diet.
Figure 4
Figure 4
Hepatic lipid deposition after 4MR treatment. (A) Hematoxylin and eosin staining of liver tissue after 4MR intervention (n = 10, ×400, Scale bar: 50 μm). (B) Oil red O staining of liver tissue after 4MR intervention (n = 10, ×400, Scale bar: 50 μm). A star (*) signifies P < 0.05 when contrasted with the control cohort, whereas a pound symbol (#) points to P < 0.05 in comparison to the cohort on a high-fat diet.
Figure 5
Figure 5
The influence of 4MR on parameters of the liver antioxidant system and antioxidant defense mechanisms. (A) Concentration of Malondialdehyde (MDA) (n = 10), (B) Functionality of Superoxide Dismutase (SOD) (n = 10), (C) Efficiency of Glutathione Peroxidase (GSH-PX) (n = 10), and (D) Activity level of Catalase (CAT). These metrics were assessed in hepatocellular extracts post-experimental conclusion (n = 10). (E) FOXO1 (n = 10), (F) manganese Superoxide Dismutase (n = 10), (G) Sirt1 (n = 10), and (H) catalase transcript quantities (n = 10). The presented figures denote the average ± standard deviation. Statistical evaluations were conducted using one-way ANOVA, supplemented by Bonferroni’s or Tamhane’s post-hoc comparison tests. *Indicates P < 0.05 when contrasted with the CON cohort, while #denotes P < 0.05 in comparison to the HFD cohort.
Figure 6
Figure 6
Analysis of protein markers associated with the antioxidant defense mechanism. (A) FOXO1 expression (n = 10), (B) phosphorylated FOXO1 levels (n = 10), (C) Sirt1 protein concentration (n = 10), (D) another representation of Sirt1 protein (n = 10), and (E) catalase protein concentrations (n = 10). The depicted data are the mean values accompanied by their standard deviations. Statistical evaluations were carried out using a single-factor ANOVA, succeeded by Bonferroni’s or Tamhane’s post-hoc analyses to assess multiple comparisons. A star (*) denotes a P-value less than 0.05 when compared to the CON cohort, whereas a pound sign (#) signifies a P-value below 0.05 in comparison with the HFD cohort.
Figure 7
Figure 7
4MR alleviated PA-induced insulin resistance and lipid accumulation in the HepG2 cell line. (A) Glucose concentrations in the culture medium after the introduction of palmitic acid (PA) at 0, 8, 16, and 24-hour intervals are represented. The presented figures denote the mean values along with their standard deviation. Statistical evaluation was conducted using the application of the t-distribution test for students. A star (*) signifies a P-value that falls short of 0.05 in comparison to the control group without treatment (n = 6). (B) The effect on cellular viability following a 24-hour exposure to varied dosages of 4MR is presented (n = 6). A star (*) highlights a P-value lower than 0.05 in relation to the untreated control, whereas a pound sign (#) indicates a P-value beneath 0.05 when contrasted with the cohort exposed to 20 μmol/L of 4MR. (C) The levels of glucose in the culture medium following treatment with PA alone or in combination with 5 μmol/L or 10 μmol/L of 4MR at 0, 8, and 24 hours are displayed (n = 6). Following a 24-hour PA incubation, Oil Red O dye was utilized to visualize lipid droplets. (D) Control group imagery (400×, Scale bar: 100 μm), (E) PA-exposed group (400×, Scale bar: 100 μm), (F) PA in conjunction with 5μmol/L 4MR (400×, Scale bar: 100 μm), and (G) PA combined with 10 μmol/L 4MR (400×, Scale bar: 100 μm). (H) Statistical analysis of the percentage of Oil Red O lipid-positive cells (n = 6). An asterisk (*) highlights a P-value below 0.05 when contrasted with the control group, a pound symbol (#) points out a P-value less than 0.05 in distinction from the PA-only cohort, while a dollar symbol ($) marks a P-value beneath 0.05 indicating a discrepancy from the PA + 5 μm 4MR group. The presented figures represent the mean ± standard error, with statistical evaluations conducted via one-way ANOVA, followed by Bonferroni’s or Tamhane’s post-hoc analyses for pairwise comparisons.
Figure 8
Figure 8
Variations in the expression of biomarkers linked to the antioxidant defense pathway within HepG2 cells. The protein levels indicative of oxidative stress response pathways were assessed post-exposure to varying dosages of 4MR. (A) Western blot outcomes for oxidative stress pathway biomarkers (n = 6), (B) FOXO1 protein levels (n = 6), (C) phosphorylated FOXO1 (n = 6), (D) Sirt1 protein expression (n = 6), (E) manganese superoxide dismutase (Mn-SOD) (n = 6), and (F) catalase activity (n = 6). The presented data are expressed as average figures accompanied by the standard deviation. Statistical evaluations were carried out via one-way ANOVA, succeeded by Bonferroni’s or Tamhane’s post-hoc procedures for pairwise comparisons. The asterisks (*) highlight P < 0.05 in comparison with the control cohort, the hashtags (#) point out P < 0.05 in relation to the PA-only cohort, and the dollar signs ($) mark P < 0.05 in contrast to the PA combined with 5 μmol/L 4MR cohort.

Similar articles

References

    1. Ma CX, Ma XN, Guan CH, et al. Cardiovascular disease in type 2 diabetes mellitus: progress toward personalized management. Cardiovasc Diabetol. 2022;21:74. doi: 10.1186/s12933-022-01516-6 - DOI - PMC - PubMed
    1. Ahmed B, Sultana R, Greene MW. Adipose tissue and insulin resistance in obese. Biomed Pharmacother. 2021;137:111315. doi: 10.1016/j.biopha.2021.111315 - DOI - PubMed
    1. Suren Garg S, Kushwaha K, Dubey R, et al. Association between obesity, inflammation and insulin resistance: insights into signaling pathways and therapeutic interventions. Diabet Res Clin Pract. 2023;200:110691. doi: 10.1016/j.diabres.2023.110691 - DOI - PubMed
    1. Tian X, Chen S, Wang P, et al. Insulin resistance mediates obesity-related risk of cardiovascular disease: a prospective cohort study. Cardiovasc Diabetol. 2022;21:289. doi: 10.1186/s12933-022-01729-9 - DOI - PMC - PubMed
    1. Ye J. Mechanism of insulin resistance in obesity: a role of ATP. Front Med. 2021;15:372–382. doi: 10.1007/s11684-021-0862-5 - DOI - PubMed

LinkOut - more resources