. 2025 Jul 23;28(8):113188.
doi: 10.1016/j.isci.2025.113188. eCollection 2025 Aug 15.

Abnormalities of the endocannabinoid system produce piercing nuclear hernias in migrating cerebral neurons

Affiliations

Abnormalities of the endocannabinoid system produce piercing nuclear hernias in migrating cerebral neurons

Yury M Morozov et al. iScience. .

Abstract

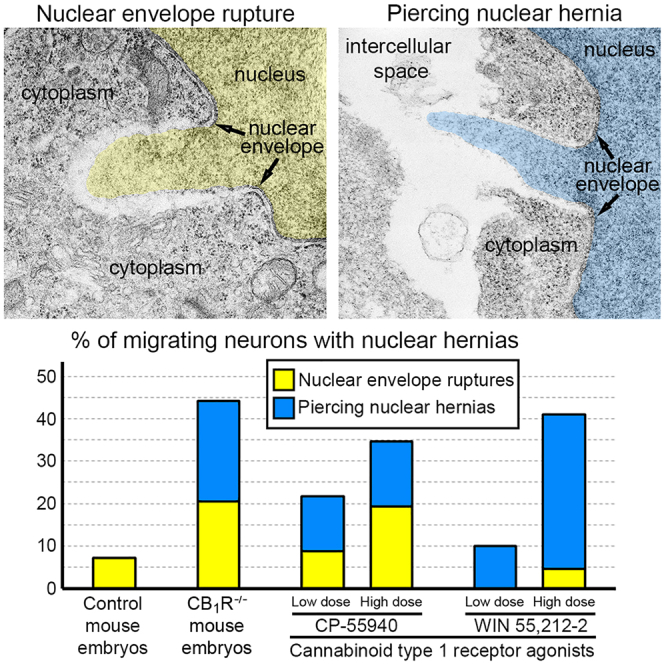
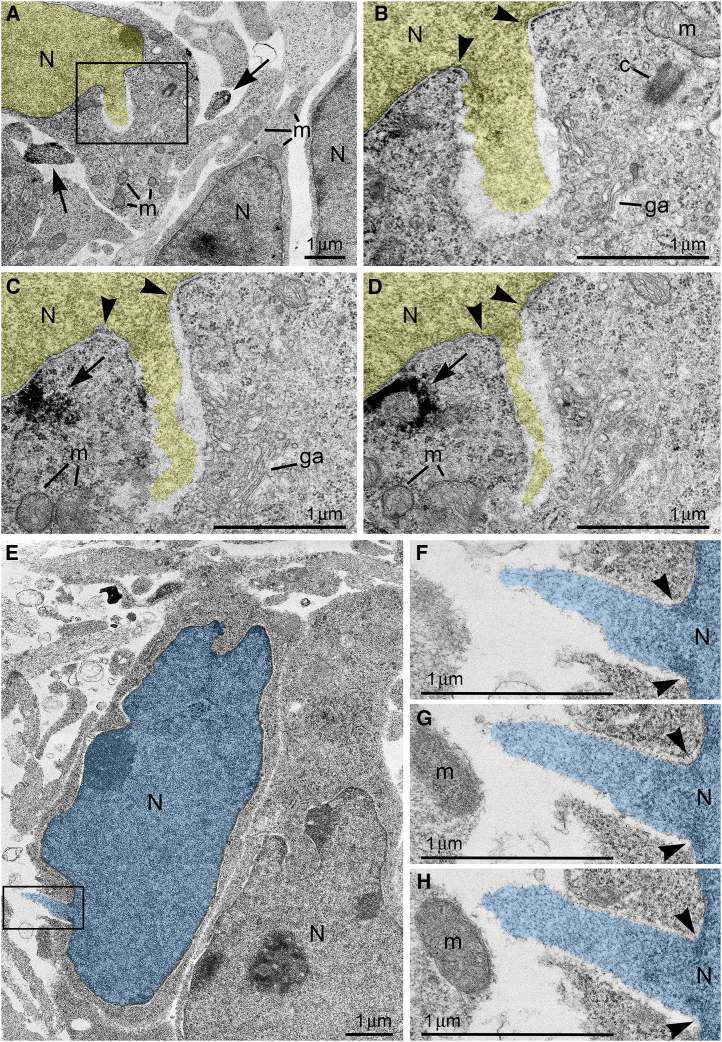
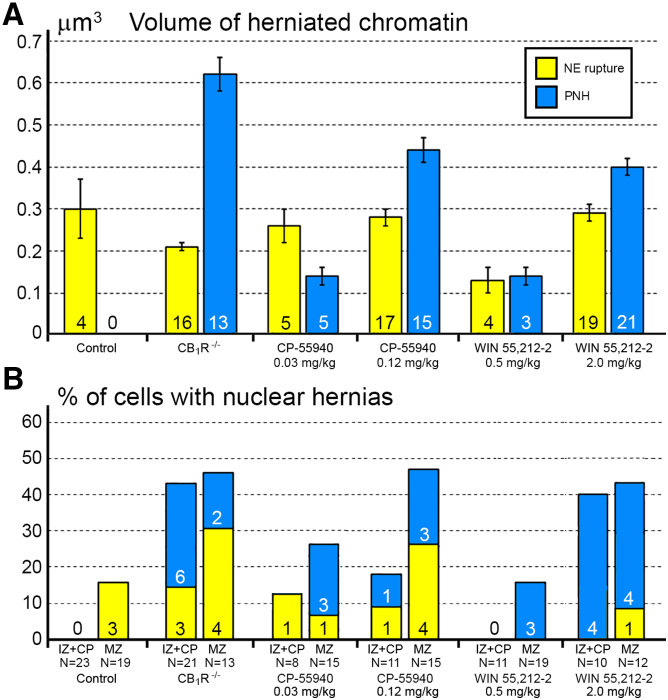
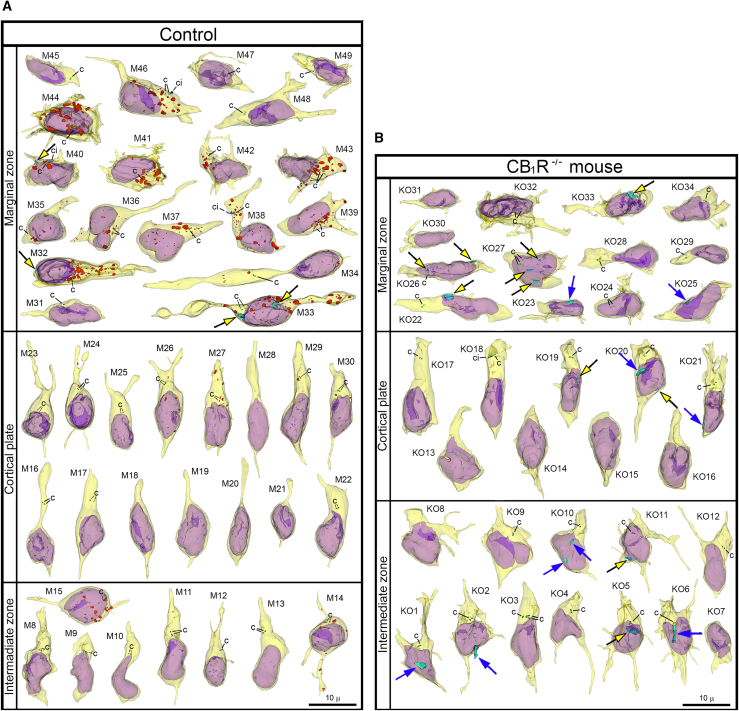
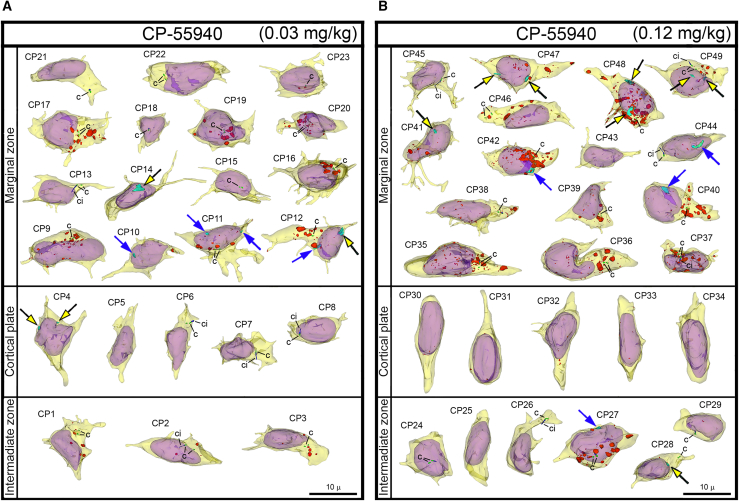
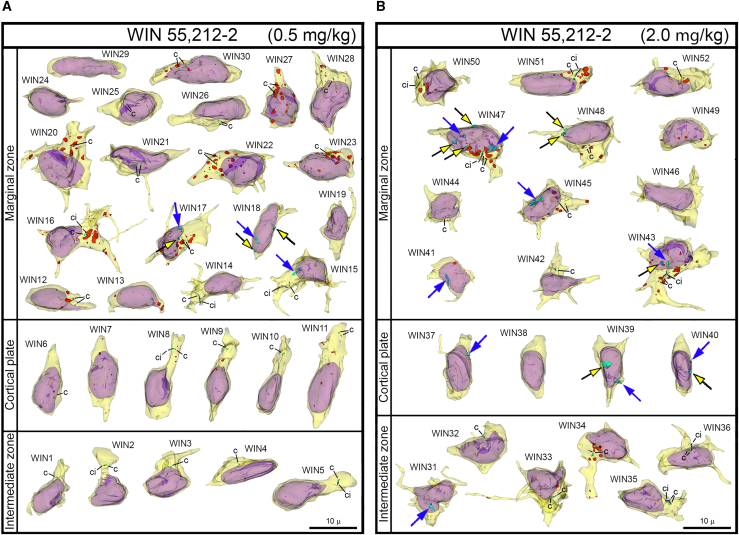
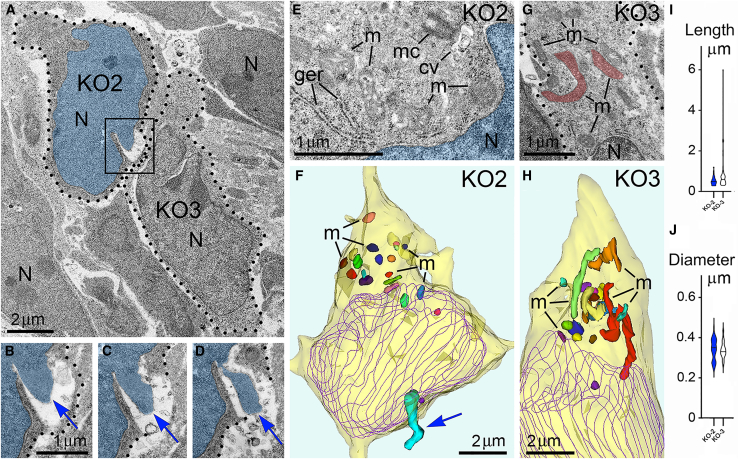
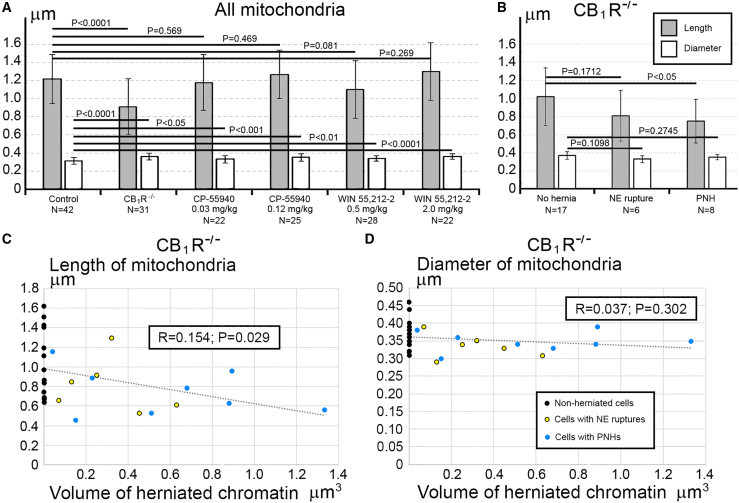
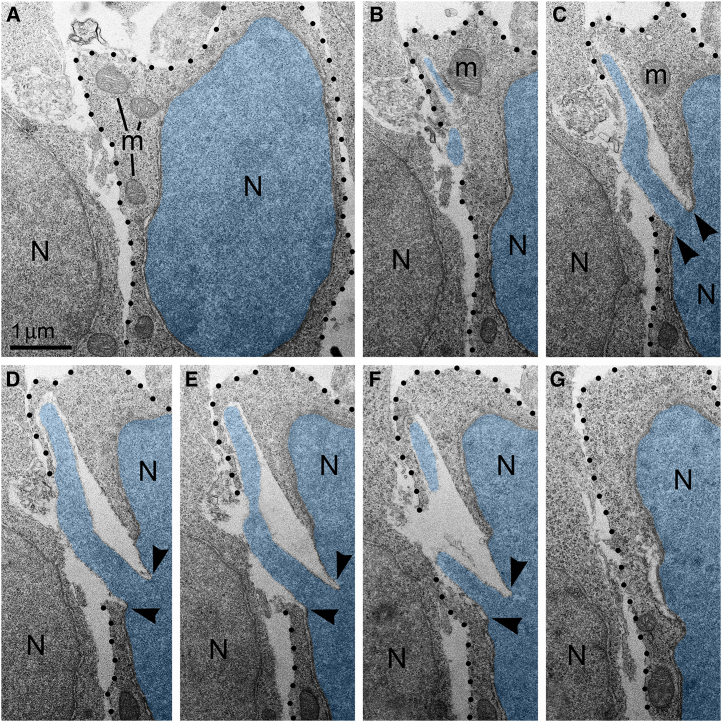
We are reporting powerful streams of chromatin rupturing the nuclear envelope (NE) and the plasma membrane of migrating cerebral neurons in mouse embryos, which we suggest naming "piercing nuclear hernia" (PNH). About 40% of migrating neurons in cannabinoid type 1 receptor knock-out (CB1R-/-) mouse embryos and in wildtype embryos exposed to CB1R agonists show NE rupture and/or PNH. This indicates that deviations from optimal functioning of the endocannabinoid system in under- or over-activity may trigger analogous mechanisms increasing intranuclear pressure and chromatin herniation. The cells from CB1R-/- embryos showed pronounced ultrastructural disorders, such as high volume of herniated chromatin, mitochondrial fission, and negative correlation of the mitochondrial length with the volume of herniated chromatin. Catastrophic rupture of the nuclear and plasma membranes may provoke accidental cell death. At the same time, a fraction of neurons with PNH showed generally normal ultrastructure, which could indicate a mechanism of cell body repair.

Keywords: Biological sciences; Cellular neuroscience; Developmental neuroscience; Natural sciences; Neuroscience.


Conflict of interest statement

The authors declare no competing interests.

Figures

None
Graphical abstract
Figure 1
Figure 1
Ultrastructure of herniated chromatin streams (A–D) NE rupture in a neuron from the cortical plate of wildtype mouse embryo exposed to high dose (0.12 mg/kg) of CB1R agonist CP-55940. (A) Low power micrograph shows ultrastructure of neuronal cell bodies and neuropil that is generally normal for the developmental stage. (B–D) Serial high power images of NE rupture from the framed area in (A). Chromatin stream expelled from the nucleus (pseudo-colored yellow) is not surrounded by the nuclear membranes. Arrowheads indicate points of interruption of the nuclear membranes. Arrows point to CB1R-positive axons in (A) and CB1R-positive intracellular vesicle in (C) and (D). (E–H) Piercing nuclear hernia (PNH) in a neuron from the cortical plate of CB1R−/− embryo. (E) Low power micrograph shows generally normal ultrastructure of neurons. (F–H) Serial high power images of PNH from the framed area in (E). Note the continuum of the chromatin stream expelled from the nucleus (pseudo-colored blue) and penetrating the intercellular space. Arrowheads indicate points of interruption of the nuclear membranes. Abbreviations: c, centriole; ga, Golgi apparatus; m, mitochondria, N, nucleus.
Figure 2
Figure 2
Volume and frequency of chromatin herniation through the experimental groups (A) Volume of herniated chromatin in cells from the embryo cerebrum of wildtype control mice, CB1R−/− mice and wildtype mice after CB1R agonists CP-55940 and WIN 55,212-2 applications at distinct doses. The data are represented in terms of average volume ±SEM of the 3D reconstructed streams of herniated chromatin. Numbers of analyzed NE ruptures and PNHs are indicated at the base of each column. Volumes of each analyzed hernia are shown in Table S1. (B) Percentages of the cells with nuclear hernias in the intermediate zone combined with the cortical plate (IZ + CP) and in the marginal zone (MZ) of the embryo cerebrum of wildtype control mice, CB1R−/− mice and wildtype mice exposed to CB1R agonists CP-55940 and WIN 55,212-2. Numbers of cells with NE ruptures and PNHs are indicated at the base of each column. N refers to the number of analyzed 3D reconstructed cells from corresponding groups. For complete morphologic characterizations of the 3D reconstructed cells see Figures 3, 4, and 5 and Tables S2, S3, S4, and S5.
Figure 3
Figure 3
Collage of 3D reconstructions of migrating neurons from wildtype control embryos and CB1R−/− mouse embryos (A and B) Among 42 analyzed cells from control embryos, nuclear hernias are detected in 3 cells (A). Among 34 cells from CB1R−/− embryos, nuclear hernias are detected in 15 cells (B). Herniated chromatin streams are shown in light blue, with examples resulting from NE ruptures pointed to using black arrows with yellow heads, and streams producing PNHs are pointed to with blue arrows. The cells are positioned with pia-directed segments facing up and the ventricular surface-directed segments facing down. See Tables S2 and S3 for morphometric characteristics of each cell. Reconstructed cell bodies with proximal segments of processes are shown in semi-transparent yellow, and nuclei are shown in semi-transparent violet. Most of the identified processes are incompletely reconstructed because of truncation in the serial sections. Anti-CB1R immunoreaction depositions in wildtype embryos are depicted in red. Most of the interneurons tangentially migrating through the marginal zone show high CB1R content, although cells #M45 and M47-M49 are immunonegative in the reconstructed segments. Centrioles (c) are depicted in green, procilia (ci) – in blue. Scale bars are valid for all the cells. Images of the cells M8-M34 and KO1-KO16 were published in our previous article 21 (CC BY http://creativecommons.org/licenses/by/4.0).
Figure 4
Figure 4
Collage of 3D reconstructions of migrating neurons from CP-55940 exposed embryos (A and B) Among a total of 49 analyzed cells, nuclear hernias were detected in 5 cells in the embryos exposed to low dose (A) and 9 cells in the embryos exposed to high dose of CB1R agonist CP-55940 (B). Herniated chromatin streams are shown in light blue, with streams resulting from NE ruptures pointed to using black arrows with yellow heads, and streams producing PNHs pointed to with blue arrows. The cells are positioned with pia-directed segments facing up and the ventricular surface-directed segments facing down. See Table S4 for morphometric characteristics of each cell. Reconstructed cell bodies with proximal segments of processes are shown in semi-transparent yellow, and nuclei are in semi-transparent violet. Most of the identified processes are incompletely reconstructed because of truncation in the serial sections. Anti-CB1R immunoreaction depositions are depicted in red. Centrioles (c) are depicted in green, procilia (ci) – in blue. Scale bars are valid for all the cells.
Figure 5
Figure 5
Collage of 3D reconstructions of migrating neurons from WIN 55,212-2 exposed embryos (A and B) Among a total of 52 analyzed cells, nuclear hernias are detected in 3 cells in the embryos exposed to low dose (A) and 9 cells in the embryos exposed to high dose of CB1R agonist WIN 55,212-2 (B). Herniated chromatin streams are shown in light blue, with the streams resulting from NE ruptures pointed to with black arrows with yellow heads, and streams producing PNHs pointed to with blue arrows. The cells are positioned with pia-directed segments facing up and the ventricular surface-directed segments facing down. See Table S5 for morphometric characteristics of each cell. Reconstructed cell bodies with proximal segments of processes are shown in semi-transparent yellow, and nuclei are shown in semi-transparent violet. Most of the identified processes are incompletely reconstructed because of truncation in the serial sections. Anti-CB1R immunoreaction depositions are depicted in red. Centrioles (c) are depicted in green, procilia (ci) – in blue. Scale bars are valid for all the cells.
Figure 6
Figure 6
Adjacent herniated and non-herniated neurons show distinct ultrastructural characteristics of mitochondria (A) Low power micrograph of two neurons from the intermediate zone of CB1R−/− embryo, also shown in Figure 3 as cells number KO2 and KO3 (dotted lines designate their plasma membranes). Cell KO2 exhibits PNH whereas KO3 shows an intact nucleus. (B–D) Serial high power images of PNH from the framed area in (A). Notice the continuum of the chromatin stream (blue arrows) herniated from the nucleus (pseudo-colored blue) and penetrating the intercellular space as evidenced by the interruption of the plasma membrane (dotted lines) in (C) and (D). Scale bar in (B) is valid for (C) and (D). (E–H) High power images (E) and (G) and 3D reconstructions (F) and (H) of the cells KO2 and KO3. 20 randomly selected mitochondria from each cell are shown in different colors in the 3D reconstructions. Cell KO2 exposing PNH (blue arrow) contains mostly short or spherical mitochondria, whereas several mitochondria from cell KO3 are long, for example, the branching mitochondrion pseudo-colored in red in the electron micrograph (G) and 3D reconstruction (H). Nuclei profiles from every 4th serial section are traced in violet. Abbreviations: cv, cilial vesicle; ger, granular endoplasmic reticulum; m, mitochondria, mc, mother centriole; N, nucleus. (I and J) Estimation plots of lengths and diameters for mitochondria from cells KO2 and KO3. Violins of cell KO2 are colored blue. Horizontal lines in every violin indicate average length and diameter. For comparison of the estimation plots for mitochondria of all analyzed cells from CB1R−/− and control embryos see Figure S2.
Figure 7
Figure 7
Morphometric analysis identifies reduction of mitochondria length in CB1R−/− embryos (A) T-test shows statistically significant reduction of the length of mitochondria from CB1R−/− embryos in comparison with the control group, whereas other groups show an absence of significant difference. Minor statistically significant (T-test) increase of mitochondrial diameters in CB1R−/−, CP-55940 and WIN 55212-2 groups in comparison with the control group may reflect swelling of a fraction of mitochondria. (B) In the CB1R−/− group, mitochondrial length shows statistically significant (T-test) reduction between ‘No hernia’ and PNH subgroups. The data in (A) and (B) are represented as the mean of average mitochondrial length and diameter from each cell at certain experimental conditions ±SD. N represents number of analyzed cells. (C and D) In the CB1R−/− group, the mitochondrial length (but not the diameter) shows statistically significant negative correlation (Pearson’s test) with the volume of herniated chromatin. Average length and diameter of the mitochondria from each cell is shown on the y axis in (C) and (D), respectively. Volumes of herniated chromatin streams are shown on the x axis. Morphometric characteristics of mitochondria from each analyzed cell are shown in Tables S2, S3, S4, and S5 and Figures S2, S3, and S4.
Figure 8
Figure 8
An example of plasma membrane rupture blocked by adjacent cell (A–G) Serial electron micrographs depict a neuron with PNH from the cortical plate of wildtype mouse embryo exposed to high dose (2.0 mg/kg) of CB1R agonist WIN 55,212-2. The nucleus and PNH stream are pseudo-colored blue. Points of interruption of NE are indicated with arrowheads. The plasma membrane is designated with dotted lines. Although the nuclear hernia produces a large rupture of the plasma membrane, the cellular cytoplasm does not show evidence of degradation and mitochondria do not show evidence of swelling. Scale bar in (A) is valid for all. Abbreviations: N, nucleus; m mitochondria.

Similar articles

References

    1. Salzet M., Stefano G.B. The endocannabinoid system in invertebrates. Prostaglandins Leukot. Essent. Fatty Acids. 2002;66:353–361. doi: 10.1054/plef.2001.0347. - DOI - PubMed
    1. Fasano S., Meccariello R., Cobellis G., Chianese R., Cacciola G., Chioccarelli T., Pierantoni R. The endocannabinoid system: an ancient signaling involved in the control of male fertility. Ann. N. Y. Acad. Sci. 2009;1163:112–124. doi: 10.1111/j.1749-6632.2009.04437.x. - DOI - PubMed
    1. Elphick M.R. The evolution and comparative neurobiology of endocannabinoid signalling. Philos. Trans. R. Soc. Lond. B Biol. Sci. 2012;367:3201–3215. doi: 10.1098/rstb.2011.0394. - DOI - PMC - PubMed
    1. Bailone R.L., Fukushima H.C.S., de Aguiar L.K., Borra R.C. The endocannabinoid system in zebrafish and its potential to study the effects of Cannabis in humans. Lab. Anim. Res. 2022;38 doi: 10.1186/s42826-022-00116-5. - DOI - PMC - PubMed
    1. Mahomed A., Girn D., Pattani A., Wells B.K., King C.C., Patel S., Kaur H., Noravian C.M., Sieminski J., Pham C., et al. Cannabinoid receptor type 1 regulates sequential stages of migration and morphogenesis of neural crest cells and derivatives in chicken and frog embryos. J. Morphol. 2023;284 doi: 10.1002/jmor.21606. - DOI - PubMed

LinkOut - more resources