

Association between dietary fiber intake and post-stroke depression among US women: insights from the NHANES 2005-2018 cross-sectional study
- PMID: 40799518
- PMCID: PMC12341476
- DOI: 10.3389/fnut.2025.1586511
Association between dietary fiber intake and post-stroke depression among US women: insights from the NHANES 2005-2018 cross-sectional study
Abstract
Background: Few studies have established a link between the dietary fiber intake (DFI) and post-stroke depression (PSD). Drawing on data collected in the National Health and Nutrition Examination Survey (NHANES) between 2005 and 2018, this investigation systematically examined the association between DFI and PSD in US women.
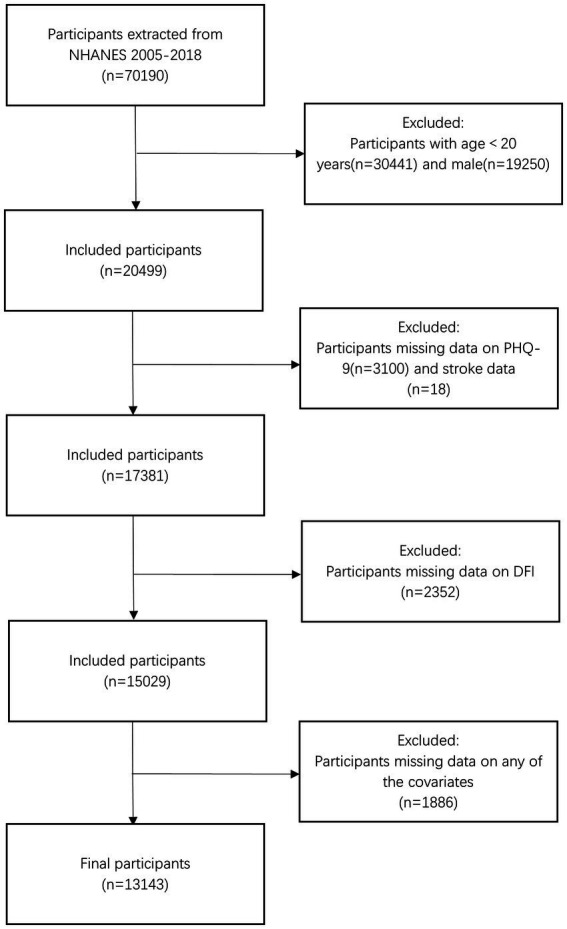
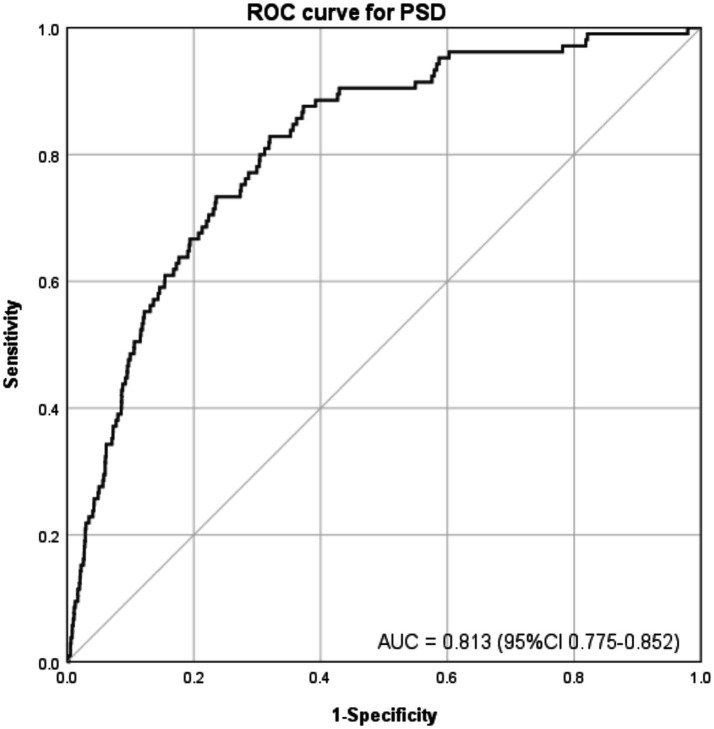
Methods: A cross-sectional study was conducted using data from female participants in the NHANES from 2005 to 2018. The inclusion criteria comprised complete data on DFI, stroke history, and depression status. Multivariate logistic regression models were utilized to evaluate the association between DFI and the risk of PSD among the female population. To assess model validity, the Hosmer-Lemeshow test was performed to examine calibration, and a receiver operating characteristic (ROC) curve was constructed to measure discriminative ability. A restricted cubic spline (RCS) was employed to examine the correlations. Furthermore, subgroup analyses and interactions were also conducted to evaluate the stability of the relationship between DFI and PSD among different subgroups.
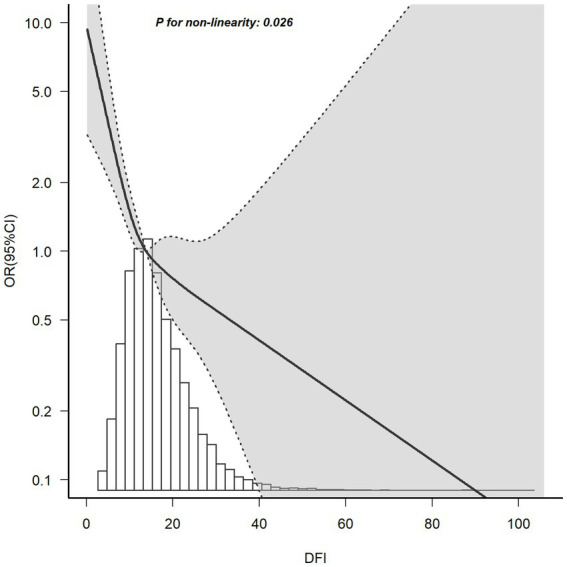
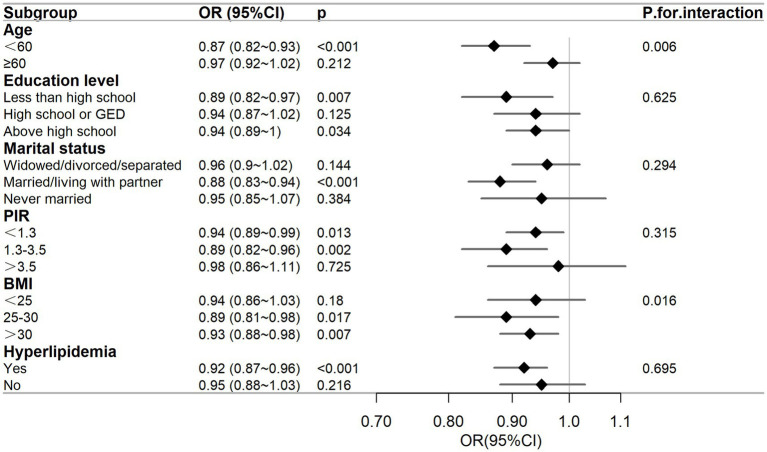
Results: Among 13,143 screened female participants, 105 were diagnosed with PSD. The multivariate logistic regression model, after adjusting for all potential covariates, demonstrated that the odds ratio (OR) for the association between DFI and PSD was 0.92 [95% confidence interval (CI): 0.88-0.96; p < 0.001]. Model calibration was confirmed by the Hosmer-Lemeshow test (p = 0.549), and the area under the receiver operating characteristic curve (AUC) was 0.813 (95% CI: 0.775-0.852), indicating good model fit and strong discriminative ability. In the adjusted Model 3, when DFI was divided into quartiles, participants in the fourth quartile (Q4) exhibited a 70% lower risk of PSD compared to those in the first quartile (Q1) (OR: 0.30, 95% CI: 0.14-0.61; p = 0.001). The RCS analysis indicated an inverse association between DFI and the risk of PSD (p for non-linearity = 0.026). Subgroup analysis revealed that, except for subgroups stratified by age and body mass index (p < 0.05), there were no significant interactions between DFI and other specific subgroups (all interactions p > 0.05).
Conclusion: The findings suggest a non-linear negative association between DFI and PSD risk among US women.
Keywords: NHANES; cross-sectional study; depression; dietary fiber; logistic regression model; post-stroke depression; stroke.
Copyright © 2025 Jian, Jian, Zhang, Ye, Tang and Huang.
Conflict of interest statement
The authors declare that the research was conducted in the absence of any commercial or financial relationships that could be construed as a potential conflict of interest.
Figures
Similar articles
-
The relationship between flavonols intake and stroke in the elderly: a cross-sectional study from NHANES (2007-2010 and 2017-2018).J Stroke Cerebrovasc Dis. 2025 Aug;34(8):108373. doi: 10.1016/j.jstrokecerebrovasdis.2025.108373. Epub 2025 Jun 7. J Stroke Cerebrovasc Dis. 2025. PMID: 40490174
-
Endothelial activation and stress index is a reliable predictor for the prevalence and mortality outcomes of stroke.Sci Rep. 2025 Jul 2;15(1):23285. doi: 10.1038/s41598-025-06595-5. Sci Rep. 2025. PMID: 40603416 Free PMC article.
-
Analyzing the association of estimated pulse wave velocity with the risk and mortality of chronic kidney disease: a study based on the NHANES database.Int Urol Nephrol. 2025 Jul 14. doi: 10.1007/s11255-025-04660-6. Online ahead of print. Int Urol Nephrol. 2025. PMID: 40660074
-
Plasma and cerebrospinal fluid amyloid beta for the diagnosis of Alzheimer's disease dementia and other dementias in people with mild cognitive impairment (MCI).Cochrane Database Syst Rev. 2014 Jun 10;2014(6):CD008782. doi: 10.1002/14651858.CD008782.pub4. Cochrane Database Syst Rev. 2014. PMID: 24913723 Free PMC article.
-
Nutritional interventions for survivors of childhood cancer.Cochrane Database Syst Rev. 2016 Aug 22;2016(8):CD009678. doi: 10.1002/14651858.CD009678.pub2. Cochrane Database Syst Rev. 2016. PMID: 27545902 Free PMC article.
References
LinkOut - more resources
Full Text Sources