[Preprint]. 2025 Aug 4:2025.08.04.668532.
doi: 10.1101/2025.08.04.668532.

A synaptic mechanism for encoding the learned value of action-derived safety

Affiliations

A synaptic mechanism for encoding the learned value of action-derived safety

Emma E Macdonald et al. bioRxiv. .

Abstract

Motivated behavior is often framed in terms of biologically grounded outcomes, such as food or threat. Yet many motivated actions, like the pursuit of safety or agency, depend on outcomes that lack explicit sensory value and must instead be inferred from experience. Here, we identify a thalamostriatal circuit mechanism by which such internally constructed outcomes acquire motivational value. In mice performing an active avoidance task, neurons in the paraventricular thalamus (PVT) projecting to the nucleus accumbens (NAc) develop a safety-encoding signal that emerges following successful avoidance. This signal is experience-dependent and value-sensitive, diminishing upon devaluation of the instrumental contingency. Selective silencing of the PVT→NAc projection at safety onset disrupts avoidance persistence without impairing action-outcome learning, as confirmed by computational modeling of value updating based on prediction error. Mechanistically, PVT input recruits cholinergic interneurons (CINs) to modulate dopamine release and this influence depends on synaptic potentiation mediated by GluA2-lacking AMPA receptor insertion at PVT-CIN synapses. Disrupting this plasticity selectively impairs the avoidance response by blunting the motivational value of safety without affecting acquisition. These findings reveal how thalamic circuits assign value to abstract, internal outcomes, providing a framework for understanding how goals like safety are inferred, stabilized, and rendered behaviorally effective.


Figures

Figure 1:
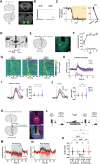
Figure 1:. pPVT→NAc projections encode the value of inferred safety and sustain motivation during avoidance.
(A) Drd2-Cre mice were injected with GCaMP8s in pPVT to record terminal activity in NAc (left). [Art created in Biorender]. Representative images of injection and recording sites (right). Scale bars, 200μm. (B) Schematic of behavior apparatus and example avoidance trial depicting behavior sequence at WS onset (left). Performance in the 2AA task (n=7 mice) (right). (C) Heatmaps of calcium signals during avoidance trials, ordered by avoidance latency (low to high). (D) Representative calcium dF/F signal during avoidance trial. (E) GCaMP dF/F z-score normalized in all avoidance trials by day. (F) GCaMP dF/F z-score normalized at shuttle initiation (dotted line) in avoidance trials (left). Quantification of post event activity (right). AUC, pairwise comparison across days, mixed effects model: see statistics table. (G) GCaMP dF/F z-score normalized at safety (dotted line) in avoidance trials (left). Quantification of post event activity (right). AUC, pairwise comparison across days, mixed effects model: see statistics table. (H) Drd2-Cre mice were injected with halorhodopsin (Halo) or fluorescent control in pPVT to inhibit terminal activity in NAc (left). Representative images of injection and stimulation sites (right). Scale bars, 200μm. (I) Schematic of closed-loop optogenetic manipulation in the 2AA task (see Methods). (J) Performance in the 2AA task with inhibition of pPVT-NAc at safety (Control n=8, Halo n=7 mice). 2-way Anova group effect: p=0.0345. (K) Simulated avoidance probability displaying the effect of changes to learning and value parameters in learning model (pa = probability of avoidance, R = value of safety, L = learning rate). (L) Avoidance probability across trial with best fit model probability by group (left). Best fit learning parameter by group with bootstrap estimated SEM. Bootstrap permutation test for group difference: p=0.1032 (middle). Best fit value parameter by group with bootstrap estimated SEM. Bootstrap permutation test for group difference: p=0.0448 (right). (M) Schematic of head-fixed avoidance task and injection targets (see Methods). (N) Average behavior performance avoidance training with no optogenetic stimulation on the first (left, Unpaired t test: p=0.1771) and last (right, Unpaired t test: p=0.2493) days of training. Control n=13, Halo n=16 mice. (O) Sessions breakpoints for progressive ratio test (5 cm increments) for Halo (left, Paired t test: p=0.0035) and mCherry (right, Paired t test: p=0.4947) groups. Data are shown as mean ± s.e.m. *p < 0.05, **p < 0.01, ns: p > 0.05.
Figure 2:
Figure 2:. pPVT input drives NAc dopamine signals associated with safety.
(A) Schematic of behavior apparatus and example avoidance trial depicting behavior sequence at WS onset. (B) Wild type mice were injected with dLight1.2 to record dopamine in NAc (left). Representative image of recording site (right). Scale bar, 200μm. (C) Performance in the 2AA task (n=6 mice). (D) dLight signal in all avoidance trials by day. (E) dLight dF/F z-score normalized at shuttle initiation (dotted line) in avoidance trials (left). Quantification of post event activity (right). AUC, pairwise comparison across days, mixed effects model: see statistics table. (F) dF/F z-score normalized at safety (dotted line) in avoidance trials (left). Quantification of post event activity (right). AUC, pairwise comparison across days, mixed effects model: see statistics table. (G) Schematic of closed-loop optogenetic manipulation in the 2AA task (see Methods). (H) Drd2-Cre mice were injected with halorhodopsin (Halo) or fluorescent control in pPVT and dLight1.2 in NAc to test the effects of pPVT-NAc inhibition of safety dopamine release (left). Representative images of injection and recording sites (right). Scale bars, 200μm. (I) Performance in the 2AA task. 2-way Anova: p=0.517 (Control n=6, Halo n=5 mice). (J) dLight dF/F z-score normalized at safety with optogenetic inhibition by group day 1 (left), day 3 (middle), and day 5 (right) of 2AA training. (K) Quantification of post event activity. AUC, pairwise comparisons between groups, linear mixed-effects model for repeated measures: see statistics table. Data are shown as mean ± s.e.m. *p < 0.05, **p < 0.01, ns: p > 0.05.
Figure 3:
Figure 3:. NAc acetylcholine is necessary for pPVT-driven dopamine signaling after safety learning.
(A) Wildtype mice were injected with channelrhodopsin in pPVT and fast-scan cyclic voltammetry was used on NAc slices to measure optogenetically evoked dopamine (right). Representative images of injection and recording sites with ChR-eYP expression (right). (B) Representative PVT evoked [DA] in ACSF and DHBE. Scale, 100nM, 2s. (C) oDA amplitude normalized to baseline in ACSF and DHBE (left). Average oDA amplitude of three trials by slice (right). Paired t test: p<0.0001 (n=5 slices from 5 mice). (D) Schematic of behavior apparatus and example avoidance trial depicting behavior sequence at WS onset. (E) Wildtype mice were injected with GRAB ACh3.8 (gACh) in NAc to record ACh activity in 2AA (left). Representative image of recording site (left). Scale bar, 200um. (F) Performance in the 2AA task (n=5 mice). (G) Heatmaps of gACh signals during avoidance trials, ordered by avoidance latency (low to high). (H) gACh signal in all avoidance trials by day. (I) gACh dF/F z-score normalized at shuttle initiation (dotted line) in avoidance trials (left). Quantification of post event activity (right). AUC, pairwise comparison across days, mixed effects model: see statistics table. (J) gACh dF/F z-score normalized at safety (dotted line) in avoidance trials (left). Quantification of post event activity (right). AUC, pairwise comparison across days, mixed effects model: see statistics table. (K) ChAT-Cre mice were injected with ChrimsonR in pPVT and dLight1.2 and DIO-hM4Di in NAc (left). Representative images of injection and recording sites (right). Scale bar, 200um. (L) Schematic of recording and training schedule (see Methods). (M-N) dLight during pPVT terminal stimulation by treatment pre-training (M) and post-training (N). (O) Quantification of dLight activity. AUC, pairwise comparisons, mixed effects model: see statistics table (n=4 mice). Data are shown as mean ± s.e.m. *p < 0.05, **p < 0.01, ****p < 0.0001, ns: p > 0.05, #: p<0.08.
Figure 4:
Figure 4:. Active avoidance training induces plasticity at pPVT→CIN synapses.
(A) ChAT-Cre mice were injected with channelrhodopsin in pPVT and DIO-mCherry in NAc to record post-synaptic currents in CINs with pPVT stimulation (left). Representative images of injection and recording sites (right). Scale bars, 200um. (B) Schematic of training and recording schedule (see Methods). (C) Performance in the 2AA task (trained n= 8, yoked n=7 mice). (D) Representative traces of optogenetic evoked voltage clamp responses. (E-J) Measurements of current properties. Unpaired t tests: oEPSC amplitude p=0.0024; Rise time p=0.0107; Decay time p=0.0028; NMDA amplitude p=0.1562; Paired-pulse ratio p=0.0005. Mann Whitney test: AMPA/NMDA ratio p=0.0168 (trained n=22 neurons from 4 mice, yoked n=19 neurons from 3 mice). (K) Rectification curve (left). 2way Anova: p=0.0085. Rectification index (right). Unpaired t test: p=0.0360. (L) Amplitude of evoked response with NASPM application (left). Quantification of NASPM inhibition (right). Unpaired t test: p=0.0002 (trained n=9 neurons from 4 mice, yoked n=12 neurons from 4 mice). Data are shown as mean ± s.e.m. *p < 0.05, **p < 0.01, ***p < 0.001, ns: p > 0.05.
Figure 5:
Figure 5:. NAc CIN Gria1 knockout disrupts avoidance-related plasticity and safety valuation.
(A) ChAT-Cre mice were injected with channelrhodopsin in pPVT, and FLEX-Cas9-sgGria1 and empty control contralaterally in NAc to record post-synaptic currents in CINs with pPVT stimulation (left). (B) Performance in the 2AA task (n=5 mice). (C) Representative image of recording location. Scale bar, 200um. (D) Representative oEPSCs from control and knockout hemispheres. (E-H) Measurements of current properties. Unpaired t tests: oEPSC amplitude p=0.0003; Rise time p=0.0206; Decay time p=0.0321; Paired-pulse ratio p=0.0009. (I) Representative traces of AMPA and NMDA responses to pPVT optogenetic stimulation. (J-K) Current amplitude measurements. Unpaired t tests: NMDA amplitude p=0.4374; AMPA/NMDA ratio p=0.0256 (sgGria1 n=12 neurons, empty n=12 neurons from 4 mice). (L) Representative traces of voltage clamp responses to optogenetic stimulation before and after NASPM application. (M) Amplitude of evoked response with NASPM application (left). Quantification of NASPM inhibition (right). Unpaired t test: p=0.0113 (sgGria1 n=5 neurons, empty n=6 neurons from 5 mice). (N) ChAT-Cre mice were injected with FLEX-Cas9-sgGria or control bilaterally in NAc (left). Representative image of virus spread through fluorescent in situ hybridization Cas9 probe binding to viral DNA (magenta) and ChAT mRNA expression (green) (right). (O) Performance in the 2AA task by group. Mixed-effects group effect: p=0.0478 (sgGria1 n=6, empty n=6 mice). (P) Avoidance probability across trial with best fit model probability by group (left). Best fit parameters by group with bootstrap estimated error. Bootstrap permutation tests for group difference: Learning p=0.2136; Value p=0.0372. Data are shown as mean ± s.e.m. *p < 0.05, **p < 0.01, ns: p > 0.05.

Similar articles

References

    1. De Martino B, Cortese A. Goals, usefulness and abstraction in value-based choice. Trends in Cognitive Sciences. 2023. Jan;27(1):65–80. - PubMed
    1. Boeke EA, Moscarello JM, LeDoux JE, Phelps EA, Hartley CA. Active Avoidance: Neural Mechanisms and Attenuation of Pavlovian Conditioned Responding. J Neurosci. 2017. May 3;37(18):4808–18. - PMC - PubMed
    1. Maier SF. Behavioral control blunts reactions to contemporaneous and future adverse events: Medial prefrontal cortex plasticity and a corticostriatal network. Neurobiology of Stress. 2015. Jan;1:12–22. - PMC - PubMed
    1. Mohammadi M, Bergado-Acosta JR, Fendt M. Relief learning is distinguished from safety learning by the requirement of the nucleus accumbens. Behavioural Brain Research. 2014. Oct;272:40–5. - PubMed
    1. Lovibond PF, Mitchell CJ, Minard E, Brady A, Menzies RG. Safety behaviours preserve threat beliefs: Protection from extinction of human fear conditioning by an avoidance response. Behaviour Research and Therapy. 2009. Aug;47(8):716–20. - PubMed

Publication types

LinkOut - more resources