[Preprint]. 2025 Aug 7:2025.08.05.668605.
doi: 10.1101/2025.08.05.668605.

Defined human tri-lineage brain microtissues

Affiliations

Defined human tri-lineage brain microtissues

Takeshi Uenaka et al. bioRxiv. .

Abstract

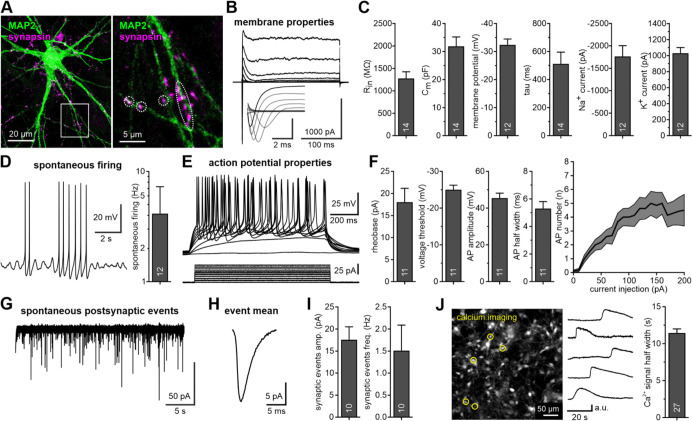
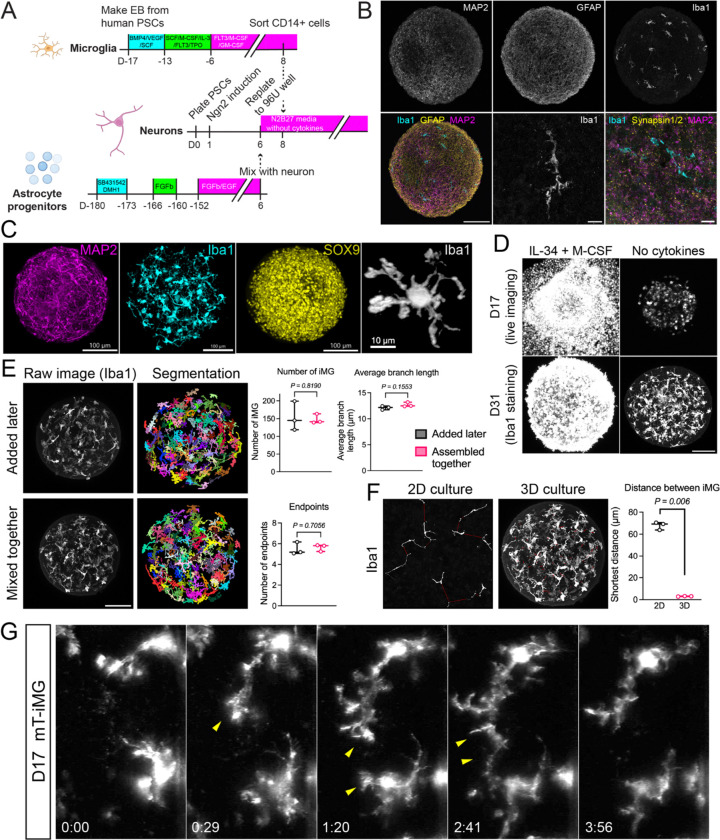
Microglia are the immune cells of the central nervous system and are thought to be key players in both physiological and disease conditions. Several microglial features are poorly conserved between mice and human, such as the function of the neurodegeneration-associated immune receptor Trem2. Induced pluripotent stem cell (iPSC)-derived microglia offer a powerful opportunity to generate and study human microglia. However, human iPSC-derived microglia often exhibit activated phenotypes in vitro, and assessing their impact on other brain cell types remains challenging due to limitations in current co-culture systems. Here, we developed fully defined brain microtissues, composed of human iPSC-derived neurons, astrocytes, and microglia, co-cultured in 2D or 3D formats. Our microtissues are stable and self-sufficient over time, requiring no exogenous cytokines or growth factors. All three cell types exhibit morphologies characteristic of their in vivo environment and show functional properties. Co-cultured microglia develop more homeostatic phenotypes compared to microglia exposed to exogenous cytokines. Hence, these tri-cultures provide a unique approach to investigate cell-cell interactions between brain cell types. We found that astrocytes and not neurons are sufficient for microglial survival and maturation, and that astrocyte-derived M-CSF is essential for microglial survival. Single-cell and single-nucleus RNA sequencing analyses nominated a network of reciprocal communication between cell types. Brain microtissues faithfully recapitulated pathogenic α-synuclein seeding and aggregation, suggesting their usefulness as human cell models to study not only normal but also pathological cell biological processes.


Conflict of interest statement

DECLARATION OF INTERESTS M.W. is a co-founder of Neucyte Inc., a scientific advisor for bit.bio Ltd, co-founder and scientific advisor of Lytherian Therapeutics and Theseus Therapies. E.U. has financial interest in Synapticure. M.B. declares outside interest in DEM Biopharma and Stylus Medicine. T.C.S. is a co-founder of Neucyte Inc. and serves as an SAB member for BitBio Ltd. H.A.L. is the co-founder and chief scientific officer of ND BioSciences, Epalinges, Switzerland and received funding from Merck Serono, AC Immune, UCB, and AbbVie. TWC is co-founder and SAB member of Qinotto Inc., Teal Rise Inc., and Vero Biosciences.

Figures

Figure 1.
Figure 1.. Establishment of a chemically defined and cytokine-free human neural tri-lineage co-culture system
(A) Illustration of the optimization process to develop neuron, astrocyte, and microglia co-cultures. (B) Outline of our optimized protocol to generate human pluripotent stem cell-derived tri-cultures. (C) Representative immunofluorescence images showing MAP2 (neurons), GFAP (astrocytes), and Iba1 (microglia) at indicated days after neuronal differention (see (B)). Scale bars, 50 μm (top and middle), 20 μm (bottom). (D) Quantification of microglial density over time following initial plating at varying cell numbers per well in a 384-well plate. n = 3 biological replicates, each with 3 technical replicates. Data are presented as mean ± SD. Statistical analysis was performed using two-way ANOVA followed by Tukey’s multiple comparisons test. NS, not significant. (E) Quantification of CD68 intensity within Iba1-positive areas in microglial mono-culture and tri-culture conditions. Microglia were cultured either alone (supplemented with 100 ng/ml IL-34 and 10 ng/ml M-CSF) or in tri-culture (without exogenous cytokines) for 14 days before fixation. n = 3 biological replicates. CD68 intensity in Iba1-positive areas was measured using ImageJ. Statistical significance was determined using an unpaired t-test.
Figure 2.
Figure 2.. Functional characterization of microglia in the human tri-culture
(A) Time-lapse imaging of GFP-labeled microglia in DIV28 tri-culture revealed dynamic morphological changes in microglial processes. Scale bars, 50 μm. (B) Phase contrast images 26 days after differentiation. The presence of microglia in tri-cultures was associated with markedly less cellular debris. (C) Phagocytosis assay with pHrodo Green Zymosan A Bioparticles in tdTomato-labeled microglia at DIV29 tri-culture, measured by flow cytometry. n = 3 biological replicates. (D) Time-lapse imaging showed tdTomato-labeled microglia in DIV27 tri-culture phagocytosing GFP-labeled neurons. Microglia grasped the neuron at 8:40, enclosed the internalized neuron within its membrane by 12:40, and completed degradation of the neuron by 15:20. Numbers indicate hours:minutes. Scale bars, 100 μm. (E) Cytokine levels in the supernatant from DIV35 tri-culture were compared between LPS-treated and untreated conditions. n = 3–5 biological replicates. Statistical significance was determined using multiple unpaired t-tests.
Figure 3:
Figure 3:. Neurons and astrocytes in the tri-lineage co-culture exhibit functional properties
(A) Tri-cultures exhibit a mature neuronal network with synaptic junctions. Confocal detectionof MAP2 (green) and synapsin (magenta) in a tri-culture 35 days after differentiation. The right panel represents a magnification of the region delineated by the white box. (B) Representative traces of voltage steps (−90 to +20 mV) analyzing voltage-gated sodiumand potassium currents in patched neurons. (C) Assessment of passive membrane properties and peak currents from voltage-gatedsodium and potassium channels. Rin=input resistance, Cm= membrane capacitance, tau= membrane time constant. (D) Sample trace of spontaneous action potentials (AP) and average spontaneous firingfrequency. (E) Traces of action potential sequences elicited by increasing current injections (1 s duration,from 0 to 100 pA in 5 pA steps) of patched neurons. (F) Quantification of the action potential properties in tri-cultured neurons, including currentand voltage thresholds, spike amplitudes and half-widths. Left panel shows number of action potentials evoked as well as quantification of action potentials evoked by increasing injections (as in panel E) plotted as I-F curve over a 1 s period. (G) Sample trace of spontaneous postsynaptic currents. (H) Mean of the postsynaptic events of cell depicted in G (note characteristic asymmetry). (I) Quantification of amplitude and frequency of spontaneous postsynaptic events. (J) Calcium imaging of astrocytes in tri-cultures using Fluo-8 AM dye. The left panel shows a standard deviation projection over a 90-second time-lapse, highlighting cells calcium transients. Traces illustrate fluorescence intensities of cells marked by yellow circles in the left panel. Bar plot on the right depicts mean half-widths of calcium trajectories from 27 individual cells All bar graphs in this figure represent mean ± SEM, with sample sizes indicated by white numerals within bars.
Figure 4.
Figure 4.. Single nucleus (sn) and single cell (sc) RNA-sequencing reveals the presence of various glial precursor cell types in the tri-lineage co-culture
(A, B) UMAP representation of (A) sn- and (B) sc-RNA seq with annotated cell populations. (C, D) Marker gene expression in each cell population of the (C) sn- and (D) sc-RNA seq data. Expression of each gene is scaled and color coded from yellow (low expression) to blue (high expression). The size of each dot represents the fraction of cells expressing the genes in each population. (E) Heatmap of the ten most specifically expressed genes in each population in the sc-RNAseq data. Expression of each gene is scaled and color coded from yellow (low expression) to blue (high expression). (F) UMAP representation of the tri-lineage co-culture sn-RNA seq sample integrated with in vivo brain samples. OPCs and Microglia of both datasets cluster together whereas the remaining cell populations of the tri-lineage co-culture cluster separately from their in vivo counterparts. (G) UMAP representation of the tri-lineage co-culture sc-RNA seq sample integrated withcerebral organoids. Neurons of both datasets cluster together whereas the remaining cell populations of the tri-lineage co-culture cluster separately from their in vivo counterparts. (H) Bar chart of neuron-specific enriched GO processes of the genes up-regulated inneurons of the tri-lineage co-culture compared to CPN brain organoid neurons. No neuron-specific processes were enriched for genes up-regulated in the CPN brain organoid neurons. The false discovery rate of each process is colored coded from low (dark red) to high (white).
Figure 5.
Figure 5.. Cell-cell communication between neurons, astrocytes, and microglia in the human tri-culture
(A, B) Graphical representation of the number of predicted cell-cell interactions between astrocytes, neurons and microglia in the sn- (A) and sc-RNA seq data (B) of 5-week tri-lineage co-cultures. The amount of interactions between any two cell types are color coded from yellow (low) to blue (high) and scale proportionally with dot size. (C) Network representation of the common interactions identified in both the sn- and sc-RNA seq data. Node color corresponds to cell types. Multicolored nodes represent ligands that are expressed by multiple populations. (D, E) Bar chart of the number of interactions each receptor participates in per cell type in the sn- (D) and sc-RNA seq data (E). (F) Quantification of neuron, astrocyte, and microglia numbers under different cytokineconditions between days 10 and 24 of human tri-cultures. Cell numbers were normalized to wells without cytokine treatment and presented as mean ± SD. n = 4 biological replicates with 3 technical replicates each. Statistical significance was determined using two-way ANOVA with Dunnett’s multiple comparisons test. *, p < 0.05; **, p < 0.01. (G) (Left) Representative live image of a neuron–microglia bi-culture 10 days after microgliawere added. Neurons were labeled with lentivirus expressing GFP, and microglia were differentiated from a human CLYBLCAG-tdTomato knock-in ESC line. Scale bars, 50 μm. (Right) tdTomato+ cells were quantified using ImageJ (n = 3 biological replicates). Statistical significance was assessed by one-way ANOVA followed by Tukey’s multiple comparisons test. (H) (Left) Representative live image of an astrocyte and microglia bi-culture 13 day aftermicroglia were added. Microglia were differentiated from a CLYBLCAG-GFP knock-in human ESC line. Scale bars, 100 μm. (Right) The number of GFP+ cells was counted using ImageJ (n = 5 biological replicates). Statistical significance was determined using one-way ANOVA followed by Tukey’s multiple comparisons test. (I) Microglial morphology in (H) was quantified using the ImageJ plugin, MicrogliaMorphology. n = 5 biological replicates. Statistical significance was determined using one-way ANOVA followed by Tukey’s multiple comparisons test. (J) CLYBLCAG-tdTomato human microglia were co-cultured with unlabeled astrocytes, which were either not infected (no guide), or infected with LentiCRISPRv2 targeting the AAVS1 or CSF1 loci causing indel-mutations and loss-of-function mutations (see also Figure S4C). Images were taken 8 days after co-culture. Note near complete microglial absence or severe depletion and dysmorphic microglia upon astrocyte-restricted CSF1 KO. Shown are one (no guide, AAVS1) and two (CSF1 KO) representative images of three biological replicates. Scale bars, 100 μm. tdTomato+ cells were quantified using ImageJ (n = 3 biological replicates). Microglial morphology was assessed using MicrogliaMorphology (n = 3 biological replicates). Statistical significance was determined using one-way ANOVA followed by Holm–Šídák’s multiple comparisons test.
Figure 6.
Figure 6.. Establishment of tri-lineage brain microtissues
(A) Timeline of the assembly of human neurons, astrocytes, and microglia into microtissues. (B) Cryosections of brain microtissue at DIV33 stained with (top) MAP2, GFAP, and Iba1, and (bottom left) merged image. Scale bars, 100 μm. (Bottom middle) Higher magnification of an Iba1+ cell. (Bottom right) Co-staining of Iba1, Synapsin1/2, and MAP2 as indicated. Scale bars, 10 μm. (C) Whole-mount staining of cleared tissue showing MAP2 at DIV23 (left), Iba1 at DIV29 with microglia differentiated from an actin-tdTomato expressing line (second left), SOX9 (second right), and a representative image of an Iba1+ microglia at DIV29 (right). Images were processed and rendered using Imaris software. (D) Representative microglial images in brain microtissue with or without exogenous cytokines. Top: tdTomato-labeled microglia at DIV17. Bottom: Iba1-stained microglia at DIV31 after whole-mount staining and clearing. Scale bars, 100 μm. (E) Representative raw 3D volumes (left, Iba1+ in white) and corresponding cell segmentations used for quantification of tri-lineage brain microtissue with microglia either assembled at the same time with other cell types (middle-left bottom), or added later (middle-left top). Images were obtained 23 days after microglia were assembled. The timing of microglia addition does not significantly affect either the number of Iba1+ cells (middle-right, two-sided unpaired T-test, p=0.8191, T=0.255), or their key morphological characteristics (average branch length - top right, two-sided unpaired T-test, p=0.1553 (p=0.9314 after Bonferroni correction for non-independence), T=−1.763; number of endpoints - bottom right, two-sided unpaired T-test, p=0.7056 (p=1 after Bonferroni correction for non-independence), T=−0.414). (F) Representative raw 2D image (left) and 3D volume (middle) of 2D/3D tri-lineage cultures with Iba1+ microglia (white) and distances to the closest neighbor’s surface for each cell (red lines); the distance to their closest neighbor is significantly lower in 3D brain microtissue at DIV29 than in 2D tri-culture at DIV25 (right, two-sided unpaired T-test, p=0.0009666 (p=0.005799 after Bonferroni correction for multiple comparisons), T=−31.43). (G) Time-lapse imaging of membrane-tdTomato-labeled microglia in DIV17 brain microtissue. Two microglia extended their processes at 0:29 and 1:20, respectively. The two processes touched each other at 2:41 and then both retracted by 3:56. Numbers indicate hours:minutes.
Figure 7.
Figure 7.. Neuronal α-synuclein inclusion body formation in human 2D and 3D tri-lineage brain microtissues following exposure to recombinant preformed fibrils (PFFs)
(A) Experimental outline. Three cell types were plated in 384-well plate, and α-synuclein preformed fibrils (PFF) were added two weeks later. Cultures were stained and imaged 12 weeks after PFF addition. (B) The number of phospho–α-synuclein (pSer129)–positive dots localized in MAP2-positive areas was counted and normalized to the MAP2-positive area detected using ImageJ. Data are from one biological replicate with four technical replicates. (C) Representative images of 2D tri-lineage culture 12 weeks after PFF addition. (Left) Phosphorylated α-synuclein (pSer129), (second left) MAP2, (second right) Iba1. Merged images (right) were processed and rendered using Imaris software. (D) Representative images of 3D tri-lineage brain microtissue 4 weeks after PFF addition. The top panel shows the condition without PFF, and the bottom panel shows the sample treated with 1 μg/ml PFF. (Left) pSer129, (second left) MAP2, (second right) Iba1, and (right) merged images. Scale bars, 100 μm. (E) Representative images of 3D tri-lineage brain microtissue 4 weeks after PFF addition. (Left) pSer129, (second left) MAP2, (second right) Iba1. Merged images (right) were processed and rendered using Imaris software.

References

    1. Chambers S.M., Fasano C.A., Papapetrou E.P., Tomishima M., Sadelain M., and Studer L. (2009). Highly efficient neural conversion of human ES and iPS cells by dual inhibition of SMAD signaling. Nat. Biotechnol. 27, 275–280. 10.1038/nbt.1529. - DOI - PMC - PubMed
    1. Zhang Y., Pak C., Han Y., Ahlenius H., Zhang Z., Chanda S., Marro S., Patzke C., Acuna C., Covy J., et al. (2013). Rapid Single-Step Induction of Functional Neurons from Human Pluripotent Stem Cells. Neuron 78, 785–798. 10.1016/j.neuron.2013.05.029. - DOI - PMC - PubMed
    1. Colonna M., and Butovsky O. (2017). Microglia Function in the Central Nervous System During Health and Neurodegeneration. Annu. Rev. Immunol. 35, 441–468. 10.1146/annurev-immunol-051116-052358. - DOI - PMC - PubMed
    1. Lee H.-G., Wheeler M.A., and Quintana F.J. (2022). Function and therapeutic value of astrocytes in neurological diseases. Nat. Rev. Drug Discov. 21, 339–358. 10.1038/s41573-022-00390-x. - DOI - PMC - PubMed
    1. Christopherson K.S., Ullian E.M., Stokes C.C.A., Mullowney C.E., Hell J.W., Agah A., Lawler J., Mosher D.F., Bornstein P., and Barres B.A. (2005). Thrombospondins Are Astrocyte-Secreted Proteins that Promote CNS Synaptogenesis. Cell 120, 421–433. 10.1016/j.cell.2004.12.020. - DOI - PubMed

Publication types