. 2023 Nov 17:1:imag-1-00031.
doi: 10.1162/imag_a_00031. eCollection 2023.

A 7T interleaved fMRS and fMRI study on visual contrast dependency in the human brain

Affiliations

A 7T interleaved fMRS and fMRI study on visual contrast dependency in the human brain

Anouk Schrantee et al. Imaging Neurosci (Camb). .

Abstract

Introduction: Functional magnetic resonance spectroscopy (fMRS) is a non-invasive technique for measuring dynamic changes in neurometabolites. While previous studies have observed concentration changes in metabolites during neural activation, the relationship between neurometabolite response and stimulus intensity and timing requires further investigation. To address this, we conducted an interleaved fMRS and functional magnetic resonance imaging (fMRI) experiment using a visual stimulus with varying contrast levels. Methods: A total of 20 datasets were acquired on a 7T MRI scanner. The visual task consisted of two STIM blocks (30 s/20 s ON/OFF, 4 min), with 10% or 100% contrast, interleaved with a 5 min REST block. A dynamic fitting approach was used for fMRS data analysis. For metabolite level changes, the STIM conditions were modeled in two different ways: either considering the full STIM block as active condition (full-block model) or only modeling the ON blocks as active condition (sub-block model). For linewidth changes due to the BOLD effect, STIM conditions were modeled using the sub-block model. Results: For both models, we observed significant increases in glutamate levels for both the 10% and 100% visual contrasts, but no significant difference between the contrasts. Decreases in aspartate, and glucose, and increases in total N-acetylaspartate and total creatine were also detected, although less consistently across both 10% and 100% visual contrasts. BOLD-driven linewidth decreases and fMRI-derived BOLD increases within the MRS voxel were observed at both 10% and 100% contrasts, with larger changes at 100% compared to 10% in the fMRI-derived BOLD only. We observed a non-linear relation between visual contrast, the BOLD response, and the glutamate response. Conclusion: Our study highlights the potential of fMRS as a complementary technique to BOLD fMRI for investigating the complex interplay between visual contrast, neural activity, and neurometabolism. Future studies should further explore the temporal response profiles of different neurometabolites and refine the statistical models used for fMRS analysis.

Keywords: 7T; functional magnetic resonance imaging; functional magnetic resonance spectroscopy; visual contrast.


Conflict of interest statement

The authors declare no competing interests.

Figures

Fig. 1.
Fig. 1.
Overview of the experiment (A) Schematic representation of the experiment. The top shows the full task duration, with the insert showing the stimulus presentation during the STIM blocks. For both the 10% and 100% visual contrast STIM blocks, we alternated 5 ON (30 s) and OFF (20 s) sub-blocks, with the last OFF block lasting 10 s to fit within the 48 NSAs. (B) Mean spectrum across subjects averaged across transients (black line) with 1 standard deviation (gray shading). The insert shows an example voxel placement overlaid on the subject’s T1w image. (C) Design matrix for the full-block analysis (D) Design matrix for the sub-block analysis. NSA = number of signal acquisitions per block.
Fig. 2.
Fig. 2.
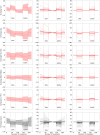
fMRS full-block results. The figure displays (Left) the model fit of the group-level fMRS analysis for five metabolites and the linewidth (one per row), depicting the percentage change in metabolite levels (red line) and the line-broadening parameter sigma (black line) with their respective 95% confidence intervals (CI) indicated by the shaded regions. (Middle) Model fits of the individual-level and group-level analysis, including the drift and constant terms. (Right) Model fits of the individual-level and group-level analysis, specifically only showing the task effect, that is, with the drift and constant terms removed. For visualization purposes, y-axes are cut off and do not include the full extent of the plotted individual traces in the middle and right panels. The onset and offset of the 10% and 100% STIM blocks are marked by dotted lines.
Fig. 3.
Fig. 3.
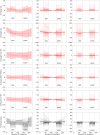
fMRS sub-block results. The figure displays (Left) the model fit of the group-level fMRS analysis for five metabolites and the linewidth (one per row), depicting the percentage change in metabolite levels (red line) and the line-broadening parameter sigma (black line) with their respective 95% confidence intervals (CI) indicated by the shaded regions. (Middle) Model fits of the individual-level and group-level analysis, including the drift and constant terms. (Right) Model fits of the individual-level and group-level analysis, specifically only showing the task effect, that is, with the drift and constant terms removed. For visualization purposes, y-axes are cut off and do not include the full extent of the plotted individual traces in the middle and right panels. The onset and offset of the 10% and 100% STIM blocks are marked by dotted lines.
Fig. 4.
Fig. 4.
fMRI and fMRS results. (A) The z-map of the 100% > 10% contrast (red/yellow) and a representative voxel (green) are overlaid on the MNI template. (B) The mean BOLD signal of each individual’s MRS voxel was extracted and normalized to the mean of the first REST period. This graph shows the mean normalized time course across all subjects. (C) Mean ± SEM BOLD signal COPE within the MRS voxel for the 10% and 100% contrast. (D) The mean moving average (bin size = 32) of the initial (single transient) fits for Glu over time across subjects (extracted from FSL-MRS) (E) Mean ± SEM Glu COPE within the MRS voxel for the 10% and 100% contrast. COPE = contrast parameter estimate.
Fig. 5.
Fig. 5.
Non-linear fMRS and fMRI response to visual contrast. Graphs show the mean and standard error of the mean of first-level (individual) contrast parameter estimates (COPE) for (A) Glu analyzed using full-block design (B) Glu analyzed using sub-block design (C) BOLD signal analyzed using sub-block design. The x-axis is plotted on a logarithmic scale. The fMRS and fMRI response increases non-linearly with visual contrast.

References

    1. Abraham, A., Pedregosa, F., Eickenberg, M., Gervais, P., Mueller, A., Kossaifi, J., Gramfort, A., Thirion, B., & Varoquaux, G. (2014). Machine learning for neuroimaging with scikit-learn. Frontiers in Neuroinformatics, 8, 14. 10.3389/fninf.2014.00014 - DOI - PMC - PubMed
    1. Apšvalka, D., Gadie, A., Clemence, M., & Mullins, P. G. (2015). Event-related dynamics of glutamate and BOLD effects measured using functional magnetic resonance spectroscopy (fMRS) at 3T in a repetition suppression paradigm. NeuroImage, 118, 292–300. 10.1016/j.neuroimage.2015.06.015 - DOI - PubMed
    1. Arteaga de Castro, C. S., Boer, V. O., Andreychenko, A., Wijnen, J. P., van der Heide, U. A., Luijten, P. R., & Klomp, D. W. (2013). Improved efficiency on editing MRS of lactate and γ-aminobutyric acid by inclusion of frequency offset corrected inversion pulses at high fields. NMR in Biomedicine, 26(10), 1213–1219. 10.1002/nbm.2937 - DOI - PubMed
    1. Bednařík, P., Tkáč, I., Giove, F., DiNuzzo, M., Deelchand, D. K., Emir, U. E., Eberly, L. E., & Mangia, S. (2015). Neurochemical and BOLD responses during neuronal activation measured in the human visual cortex at 7 Tesla. J Cereb Blood Flow Metab. 35(4), 601–610. 10.1038/jcbfm.2014.233 - DOI - PMC - PubMed
    1. Bednařík, P., Tkáč, I., Giove, F., Eberly, L. E., Deelchand, D. K., Barreto, F. R., & Mangia, S. (2018). Neurochemical responses to chromatic and achromatic stimuli in the human visual cortex. Journal of Cerebral Blood Flow & Metabolism, 38(2), 347–359. 10.1177/0271678X17695291 - DOI - PMC - PubMed

LinkOut - more resources