. 2023 Nov 15:1:imag-1-00030.
doi: 10.1162/imag_a_00030. eCollection 2023.

High sensitivity mapping of brain-wide functional networks in awake mice using simultaneous multi-slice fUS imaging

Affiliations

High sensitivity mapping of brain-wide functional networks in awake mice using simultaneous multi-slice fUS imaging

Adrien Bertolo et al. Imaging Neurosci (Camb). .

Abstract

Functional ultrasound (fUS) has received growing attention in preclinical research in the past decade, providing a new tool to measure functional connectivity (FC) and brain task-evoked responses with single-trial detection capability in both anesthetized and awake conditions. Most fUS studies rely on 2D linear arrays to acquire one slice of the brain. Volumetric fUS using 2D matrix or row-column arrays has recently been demonstrated in rats and mice but requires invasive craniotomy to expose the brain due to a lack of sensitivity. In a previous study, we proposed the use of motorized linear arrays, allowing imaging through the skull in mice for multiple slices with high sensitivity. However, the tradeoff between the field of view and temporal resolution introduced by motorized scanning prevents acquiring brain-wide resting-state FC data with a sufficient volume rate for resting-state FC analysis. Here, we propose a new hybrid solution optimized and dedicated to brain-wide transcranial FC studies in mice, based on a newly developed multi-array transducer allowing simultaneous multi-slicing of the entire mouse cerebrum. We first demonstrate that our approach provides a better imaging quality compared to other existing methods. Then, we show the ability to image the whole mouse brain non-invasively through the intact skin and skull during visual stimulation under light anesthesia to validate this new approach. Significant activation was detected along the whole visual pathway, at both single and group levels, with more than 10% of augmentation of the cerebral blood volume (CBV) signal during the visual stimulation compared to baseline. Finally, we assessed resting-state FC in awake head-fixed animals. Several robust and long-ranged FC patterns were identified in both cortical and sub-cortical brain areas, corresponding to functional networks already described in previous fMRI studies. Together, these results show that the multi-array probe is a valuable approach to measure brain-wide hemodynamic activity in mice with an intact skull. Most importantly, its ability to identify robust resting-state networks is paving the way towards a better understanding of the mouse brain functional organization and its breakdown in genetic models of neuropsychiatric diseases.

Keywords: awake mice; brain imaging; connectomics; functional connectivity; functional ultrasound; visual pathway; volumetric imaging.


Conflict of interest statement

Mickael Tanter, Mathieu Pernot, Bruno-Félix Osmanski, and Thomas Deffieux are share-holders and co-founders of the Iconeus company. Adrien Bertolo, Jeremy Ferrier, Samuel Diebolt, and Bruno-Félix Osmanski are employees of the Iconeus company.

Figures

Fig. 1.
Fig. 1.
Experimental designs used for both anesthetized experiments (ii) and awake (iii, iv) experiments. (i) Iconeus One scanner (256 channels ultrasound system) driving the multi-array probe. (ii) Experimental setup for visual stimulation in lightly anesthetized mice. The anesthetized mouse is shaved and placed in a stereotaxic frame. The multi-array probe is mounted on a 4-axis motorized stage. A white LED is placed 30 cm from the mouse’s eyes for visual stimulation. (iii) Experimental setup for resting-state functional connectivity in awake mice. The multi-array probe is mounted on the 4-axis motor stage, and placed just above the head of the mouse, in the MHC. (iv) Different steps of the animal habituation protocol (post-surgery recovery, handling, wrapping for installation in the MHC, head-fixed exploration in the MHC). The first imaging session can be set at D11.
Fig. 2.
Fig. 2.
Multi-array probe. (i) Top view of the multi-array probe. The schematic of the probe head shows four acoustic lenses, separated by 2.1 mm. The slice thickness (0.5 mm) is represented with the red rectangles in the center of each array. (ii) Lateral view of head of the multi-array probe. The emitted pressure field, simulated with Field II software, is represented under each array, and thresholded at -6 dB.
Fig. 3.
Fig. 3.
Principle of motorized fast scanning for whole-brain transcranial fUS imaging. (i) The probe is translated at each position following the order 1-3-4-2 (with interleaving) to minimize the translation distance and keep the translation time below 0.2 s. The step between slices is set to 0.525 mm, allowing homogeneous scanning of the dead volume between two arrays (2.1 mm). At each position, the probe rests for 0.4 s to acquire 4 × 200 compounded frames at 500 Hz. The resulting pressure field (simulated with Field II (Jensen, 1997)) is represented under each array, and overlaid on the two-photon Allen template. Every 2.4 s, the 16 continuous slices (ii) are beamformed, processed, and concatenated to form a 3D volume (iii). These 16 PD slices are also depicted in (iv) with their corresponding anatomical coordinate relative to Bregma coordinates (in mm) and overlaid with the envelope of the main Allen atlas regions. This cycle is repeated constantly during the whole acquisition. The PD scan represented in (iv) was performed on an anesthetized mouse.
Fig. 4.
Fig. 4.
Block diagram describing each step of the processing pipeline. Steps represented in gray blocks are specific to awake resting-state data pre-processing.
Fig. 5.
Fig. 5.
Assessing the imaging quality before and after craniotomy: comparative analysis of the multi-array probe against RCA and MUX-FPM probes. Comparisons were focused on three coronal slices, represented in each row of this comparative table. For each probe, the first column represents PD images after craniotomy whereas the second one represents PD images before craniotomy. For each slice, the vessel ROI is represented with the cyan square whereas the background ROI is represented with the red square. The green line indicates the voxels along which PD profiles were extracted for contrast comparison (last column). Whereas the multi-array probe provides the best imaging quality before and after craniotomy, the MUX-FPM is not sensitive enough to detect blood flow through the skull.
Fig. 6.
Fig. 6.
Subject-level response after visual stimulation. (i) Subject-level activation map (p < 0.05, FWER corrected with Bonferroni procedure) overlaid with the PD angiography from the most anterior (top left) to the most posterior acquired slice (bottom right), reveals significant activation in major brain areas of the visual system: contours for the V1, RS, SC, and LGN regions are depicted on each slice. (ii) Raster plot of rCBV time course extracted in 228 Allen regions covering the whole brain. The gray-scale colorbar indicates the percentage of activated voxels in each region (black = 0%, white = 100 %). Green dashed lines indicate the beginning and the end of each stimulus. (iii) Cross-trial averaged raster plot. (iv) rCBV curves extracted in V1, RS, SC, and LGN, showing single-trial detections at each stimulus. (v) The average rCBV curves (cross-trial) show an increase of the rCBV from 5% for the LGN to 15% for V1 during the ON-time.
Fig. 7.
Fig. 7.
Group-level response after visual stimulation (n = 6). (i) Average activation map (two-tailed t-test, p < 0.05, FWE corrected using TFCE and maximal statistic permutation testing), overlaid with the average PD angiography (cross-subject), from the most anterior slice (top left) to the most posterior slice (bottom right). (ii) 3D renderings (Amira software) of the average activation map, thresholded with significant voxels. (iii) Raster plot of averaged rCBV profiles (cross-trial and cross-subjects) extracted in 228 Allen regions. The gray color bar indicates the percentage of significant voxels in each region (black = 0%, white = 100 %). (iv) Average rCBV (cross-trial and cross-subjects) profiles extracted from important regions of the visual pathway show an increase of the rCBV going from 4% for the LGN to 12% for V1 during the ON-time.
Fig. 8.
Fig. 8.
Seed-based analysis reveals long-range FC patterns (n = 6). Each row represents an average seed-based map across the awake dataset (n = 6), thresholded with significant connectivity (one-tailed t test), p < 0.05, FWER cluster corrected using TFCE. Seed regions are denoted by the green legends: (i) somatosensory area, upper limb, (ii) Anterior cingulate area, (iii) Dentate gyrus, (iv) Lateral group of the dorsal Thalamus. Maps were resampled in the Allen mouse template. Volume renderings (left) are performed with Amira software. Activation maps are also represented on coronal slices overlaid with the two-photon Allen mouse template.
Fig. 9.
Fig. 9.
Average functional connectivity matrix (n = 6) derived for more than 200 Allen cortical and subcortical structures which are listed in Supplementary Table 2 (i). Strong inter-hemispheric FC (anti-diagonals in green squares) is measured in both cortical and sub-cortical regions. Significant coefficients (one-sample t-test, p < 0.05, FDR corrected) are represented on the right matrix (ii).
Fig. 10.
Fig. 10.
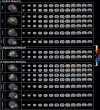
Functional networks identified with ICA. Identified networks were classified in three different groups (cortical (i), hippocampal (ii), and sub-cortical (iii)). Each network (labeled in the first column and represented in 3D in the second column) comprises at least one independent component. For each component, abbreviations of overlapped structural regions are captioned. In the last column, coronal sections of spatial maps are overlaid with the two-photon Allen template. RS = retrosplenial area, ACA = anterior cingulate area, MOp = primary motor area, SSp = primary somatosensory, ul = upper limb, ll = lower limb, bf = barrel field, PFC = prefrontal cortex, Mos = secondary motor cortex, VISa = anterior visual area, VISam = anteromedial visual area, VISrl = rostrolateral visual area, VISp = primary visual area, VISl = lateral visual area, ORB = orbital cortex, ACB = nucleus accumbens, HPC = hippocampus, CA = cornu ammonis, DG = dentate gyrus, AM = anteromedial nucleus, VAL = ventral anterior-lateral complex of the thalamus, VPM = ventral posteromedial nucleus, LP = lateral posterior nucleus of the thalamus, PO = posterior complex of the thalamus, SN = substantia nigra, VTA = ventral tegmental area, SC = superior colliculus, PRT = pretectal region, ACB = nucleus accumbens, OB = olfactory bulb, AON = anterior olfactory nucleus, BMA = basomedial amygdalar nucleus, medial amygdalar nucleus, PAA = Piriform-amygdalar area, COA = cortical amygdalar area.

Similar articles

Cited by

References

    1. Aydin, A.-K., Haselden, W. D., Goulam Houssen, Y., Pouzat, C., Rungta, R. L., Demené, C., Tanter, M., Drew, P. J., Charpak, S., & Boido, D. (2020). Transfer functions linking neural calcium to single voxel functional ultrasound signal. Nature Communications, 11(1), 2954. 10.1038/s41467-020-16774-9 - DOI - PMC - PubMed
    1. Baranger, J., Arnal, B., Perren, F., Baud, O., Tanter, M., & Demene, C. (2018). Adaptive spatiotemporal SVD clutter filtering for ultrafast Doppler imaging using similarity of spatial singular vectors. IEEE Transactions on Medical Imaging, 37(7), 1574–1586. 10.1109/TMI.2018.2789499 - DOI - PubMed
    1. Bertolo, A., Nouhoum, M., Cazzanelli, S., Ferrier, J., Mariani, J.-C., Kliewer, A., Belliard, B., Osmanski, B.-F., Deffieux, T., Pezet, S., Lenkei, Z., & Tanter, M. (2021). Whole-brain 3D activation and functional connectivity mapping in mice using transcranial functional ultrasound imaging. Journal of Visualized Experiments, 168, 62267. 10.3791/62267 - DOI - PubMed
    1. Bertolo, A., Sauvage, J., Tanter, M., Pernot, M., & Deffieux, T. (2021). XDoppler: Cross-correlation of orthogonal apertures for 3D blood flow imaging. IEEE Transactions on Medical Imaging, 40(12), 1–1. 10.1109/TMI.2021.3084865 - DOI - PubMed
    1. Biswal, B., Zerrin Yetkin, F., Haughton, V. M., & Hyde, J. S. (1995). Functional connectivity in the motor cortex of resting human brain using echo-planar MRI. Magnetic Resonance in Medicine, 34(4), 537–541. 10.1002/mrm.1910340409 - DOI - PubMed

LinkOut - more resources