[Preprint]. 2025 Aug 5:rs.3.rs-7117998.
doi: 10.21203/rs.3.rs-7117998/v1.

Circuit mechanisms of GPe pauses account for adaptive exploration

Affiliations

Circuit mechanisms of GPe pauses account for adaptive exploration

Sang Wan Lee et al. Res Sq. .

Abstract

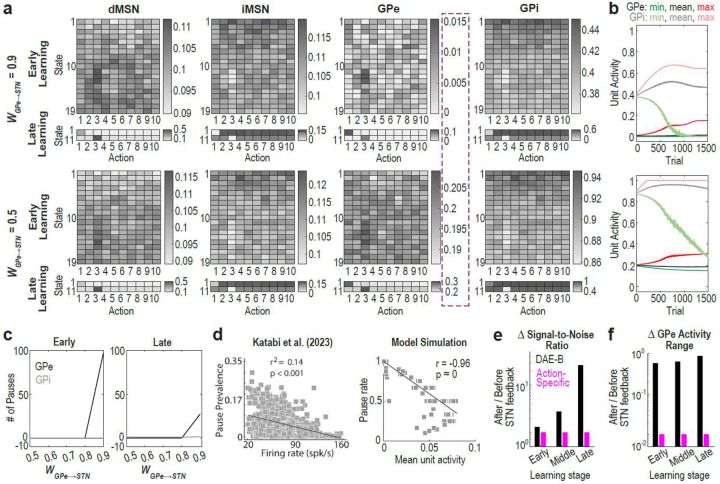
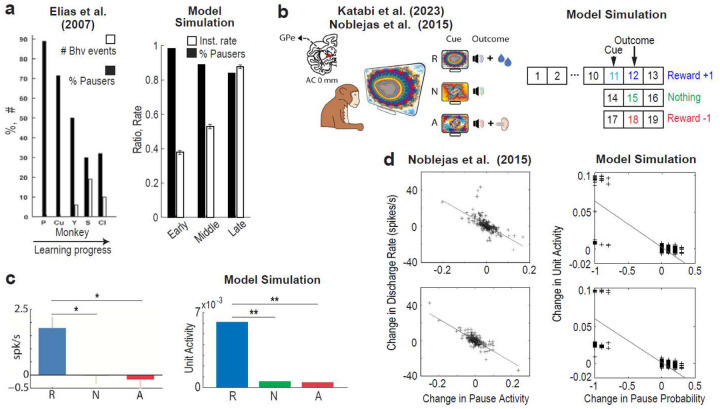
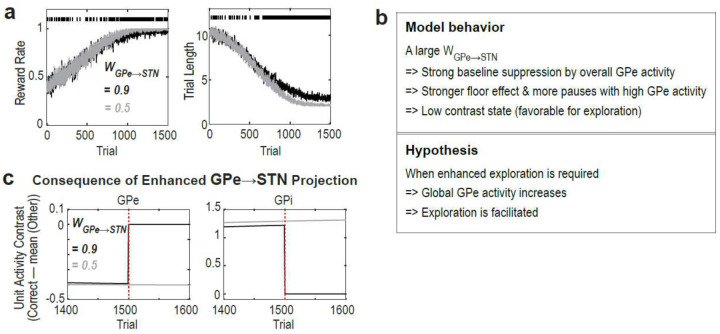
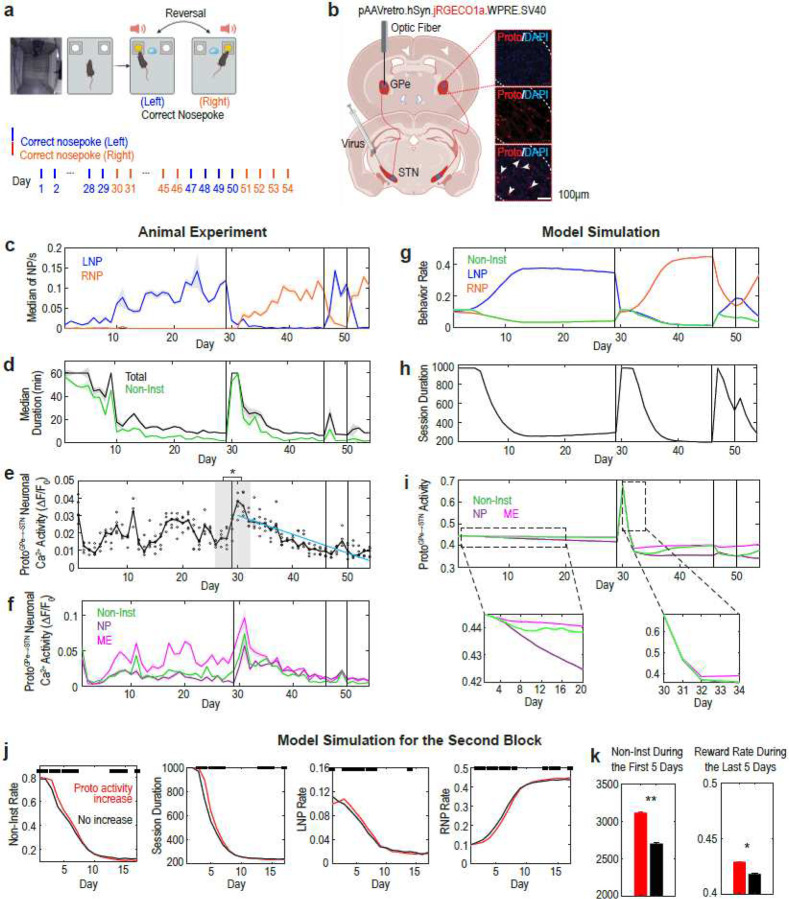
The external globus pallidus (GPe) has traditionally been viewed as a relay nucleus within the basal ganglia (BG), but accumulating evidence indicates a more dynamic role in reinforcement learning (RL). One key characteristic of GPe activity-transient pauses in high-frequency discharge (HFD) neurons-is preserved across species, yet its potential implications in RL remains unclear. Here, we developed a neurophysiologically grounded computational model to investigate the origin and role of GPe pauses in RL. Our model successfully replicated a range of empirical observations, including pause dynamics during learning and cue-related activity modulation. We demonstrated that the GPe-subthalamic nucleus (STN) circuit functions analogously to a denoising autoencoder, modulating baseline excitability in downstream BG circuits and that GPe pauses emerge as circuit-level consequences of strong, convergent inhibition from the GPe to STN. Simulations and in vivo recordings revealed that the activity of GPe-STN projecting neurons increases following sudden environmental changes, promoting adaptive exploration by disrupting action value contrast. Intriguingly, this same configuration impairs performance with extended training, suggesting that habitual behavior may benefit from weakened GPe-to-STN projections. These findings provide a unifying framework for understanding GPe pause dynamics and highlight circuit-level distinctions supporting the balance between flexibility and proficiency in RL.


Figures

Fig. 1:
Fig. 1:. The GPe-STN circuit lacking action-specific connectivity resembles a denoising autoencoder.
a & b: Structure and behavior of models with (a) and without (b) action-specific connectivity between the GPe and STN. Top panels depict the full BG circuitry. Bottom panels illustrate the connectivity pattern and behavior of the GPe-STN circuit. Each box represents a unit in each layer. The numbers inside the boxes in the bottom panels indicate the behavioral option associated with each unit. The inset in b shows the structure of a denoising autoencoder. c: Task design. Left and right panels illustrate the states presented to the model and the set of available actions, respectively.
Fig. 2:
Fig. 2:. Denoising autoencoder-like GPe-STN circuit dynamics explain pallidal pauses.
a: Unit activity during early (trial ~100) and late (trial ~1500) stages. Trials of lengths 19 and 2 time steps were selected. b: Minimum, mean and maximum activity of GPe and GPi unit activity. c: Number of pauses in GPe and GPi during early (trial 100) and late (trial 1500) stages. d, left: Correlation between firing rate vs pause prevalence (= pause duration × pause rate) of GPe HFD neurons in animals trained on the task shown in Fig. 2b. Figure adapted from with permission. d, right: Replication of the left panel using model data. r and p indicate the Pearson correlation coefficient and corresponding p-value. Reflecting the fact that animals in Katabi et al. (2023) were trained for months, simulation results from late stage are shown here; however, significant negative correlations were also found in early and middle stages (see Suppl. Fig. 7a). See Methods for details on the computation of pause rate and mean unit activity. e & f: Comparison of models with (pink) and without (black) action-specific connectivity between the GPe and STN. Early, middle and late stages correspond to trial 100, 600 and 1500. e: Change in Signal-to-noise ratio (SNR). See Methods for details on the computation of the SNR. f: Change in GPe activity range. GPe activity range was defined as the difference between the minimum and maximum activity of GPe units during early, middle, and late learning stages. In c-f, WGPeSTN=0.9. In b-f, data represent results from 100 simulations. In b, c and f, standard error of the means (SEMs) are not visible due to their small size.
Fig. 3:
Fig. 3:. The proposed GPe pause mechanism operates across RL tasks.
a, left: Figure adapted from. Monkeys S, Cu, Y, and Cl performed self-initiated behavioral tasks. However, most recordings for Monkey Cu were conducted during a “quiet wakeful” state, and Monkey P was not engaged in any task but sat quietly. a, right: Replication of the left plot. Pausers were defined as units exhibiting a pause rate > 0.5 per trial. Instrumental response rate was calculated by dividing the total number of Inst1, Inst2 and Reward retrieval (Fig. 1c, right) executions by the trial length. Page’s trend tests revealed a significant increasing trend in instrumental response rates (p = 2.20 × 10⁻¹⁶, z = 9.93, L = 1341) and a significant decreasing trend in pauser rates (p = 2.20 × 10⁻¹⁶, z = 10.93, L = 1355; tested on reverse order). b, left: Experimental design of Katabi et al. (2023) and Noblejas et al. (2015). Figure adapted from. b, right: Task structure used for model simulation. c, left: GPe HFD neuronal responses to cues. Figure adapted from. c, right: Replication of the left plot. ****p = 2.56 × 10⁻³⁴ (Wilcoxon rank-sum test). d, left: Correlation between changes in discharge rate and pause activity in GPe HFD neurons during cue (top) and outcome (bottom) presentation. Figure adapted from. d, right: Replication of the left plot. Pearson correlation analysis yielded: r = −0.82, p = 4.51 × 10−242) (top); r = −0.83, p = 3.02 × 10−251 (bottom). Pearson correlation analysis restricted to data points with y-values < 0.05 yielded: r = −0.38, p = 3.42 × 10⁻³⁵ (top); r = −0.86, p = 3.21 × 10−279 (bottom). c and d, right show simulation results from the late stage, reflecting the fact that animals in Katabi et al. (2023) and Noblejas et al. (2015) were trained for months. a, c and d, right show results from 100 simulations with WGPeSTN=0.9. Error bars in a and c indicate SEMs but are barely visible due to their small size. Permission for c and d, left will be obtained upon acceptance.
Fig. 4:
Fig. 4:. A large WGPeSTN enables adaptive exploration by modulating GPe-to-STN projections.
a: Performance of the DAE-B model with WGPeSTN=0.9 and 0.5. Upper black squares indicate significant differences (p < 0.05; Wilcoxon rank-sum test). b: Schematic summarizing model behavior and the proposed hypothesis. c: Unit activity contrast between correct response versus all other actions. GPe-to-STN projections were artificially increased to 1.5 times at trial 1500. Activity was summed across states 1–10. In a and c, results from 100 simulations were averaged. SEMs are not visible due to their small size.
Fig. 5:
Fig. 5:. ProtoGPeSTN activity increase upon reversal enhances exploration under a large WGPeSTN.
a: Animal experiment design (top) and reversal schedule (bottom). b: Histological image for ProtoGPeSTN neurons. c: Rates of instrumental behaviors (N = 5). d: Session duration (black) and the time spent on Non-Inst (green). e: Calcium activity in ProtoGPeSTN neurons. Comparing the mean of the last three days before and the first three days after the reversal (gray shaded area), p = 6.33 × 10⁻⁴ (paired t-test) and p = 0.0625 (Wilcoxon signed-rank test). f: ProtoGPeSTN activity during ME, NP and Non-Inst. g-i: With WGPeSTN=0.9, the model replicates experimental results in e-h. In k, bottom plots are enlargements of the dotted boxes in the top plot. j-k: Model behavior with (red) and without (black) ProtoGPeSTN activity increase following reversal. In j, upper black squares indicate significant differences (p < 0.05; Wilcoxon rank-sum test). In k, **p = 6.03 × 10⁻³⁰ and *p = 4.23 × 10⁻¹⁴ (Wilcoxon rank-sum test). In g-k, 100 simulation results were averaged and SEMs are not visible due to their small size.
Fig. 6:
Fig. 6:. When WGPeSTN is large, extensive training deteriorates performance.
a & b: DAE-B Model behavior. Data are averages from 100 simulations. SEMs are not visible due to their small size. c & d: Unit activity after moderate (600 trials) and extensive (6000 trials) training.

References

    1. Kang S. et al. Astrocyte activities in the external globus pallidus regulate action-selection strategies in reward-seeking behaviors. Sci Adv 9, (2023). - PMC - PubMed
    1. Baker M. et al. External globus pallidus input to the dorsal striatum regulates habitual seeking behavior in male mice. Nat Commun 14, (2023). - PMC - PubMed
    1. Farries M. A., Faust T. W., Mohebi A. & Berke J. D. Selective encoding of reward predictions and prediction errors by globus pallidus subpopulations. Current Biology 33, 4124–4135.e5 (2023). - PMC - PubMed
    1. Bogacz R., Martin Moraud E., Abdi A., Magill P. J. & Baufreton J. Properties of Neurons in External Globus Pallidus Can Support Optimal Action Selection. PLoS Comput Biol 12, e1005004 (2016). - PMC - PubMed
    1. Schechtman E., Noblejas M. I., Mizrahi A. D., Dauber O. & Bergman H. Pallidal spiking activity reflects learning dynamics and predicts performance. Proc Natl Acad Sci U S A 113, E6281–E6289 (2016). - PMC - PubMed

Publication types

LinkOut - more resources