. 2025 Jul 17;33(3):201020.
doi: 10.1016/j.omton.2025.201020. eCollection 2025 Sep 18.

Allele-specific depletion of GNAQ Q209L via siRNA or an rAAV2-shRNA vector induces selective toxicity in GNAQ Q209L uveal melanoma cells

Affiliations

Allele-specific depletion of GNAQ Q209L via siRNA or an rAAV2-shRNA vector induces selective toxicity in GNAQ Q209L uveal melanoma cells

Trace F McCall et al. Mol Ther Oncol. .

Abstract

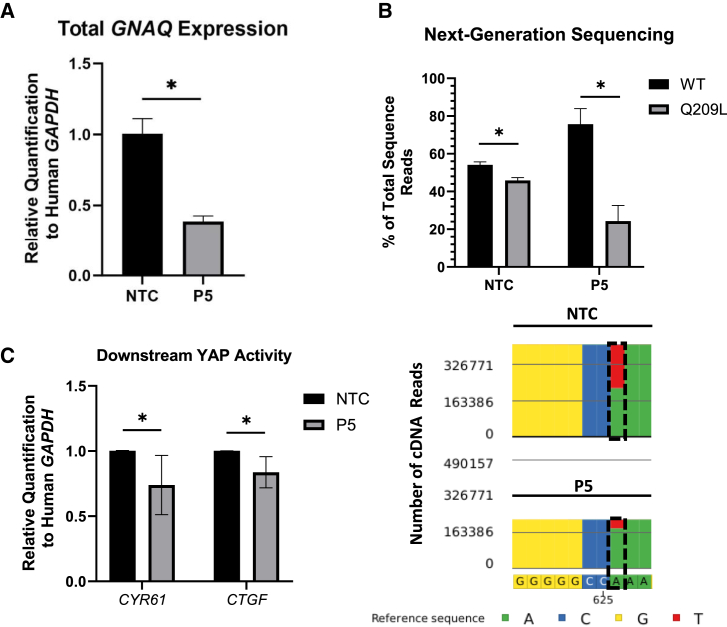
Approximately 80%-90% of uveal melanomas (UVM) harbor a single base pair substitution in one of two Gα protein subunits (GNAQ Q209L/P/GNA11 Q209L), resulting in constitutive activation and tumor initiation/progression. Herein, a small interfering RNA (siRNA) that specifically targets GNAQ Q209L transcripts induced significant cell death in GNAQ Q209L UVM cells, whereas little to no effects were observed on GNAQ wt cells or GNAQ wt transcripts. The most effective siRNA sequence was subsequently encoded into a short hairpin RNA (shRNA) cassette (shGNAQQ209L), expressed in a recombinant adeno-associated virus (rAAV), and the AAV2 capsid was selected for viral production upon completion of a serotype survey in UVM cells. Transduction with rAAV2-shGNAQQ209L induced significant cell death in GNAQ Q209L cells but not in a GNAQ wt UVM line. Unexpectedly, cell death in the GNAQ Q209L UVM cells was also observed upon transduction with the non-targeting control rAAV2 (although to a lesser degree than rAAV2-shGNAQQ209L), suggesting that an element of the AAV vector itself exhibits toxicity in GNAQ Q209L UVM cells. This work is among the first describing a genetic-based rAAV approach to specifically target an oncogenic mutant driver allele using single base pair allelic discrimination, collectively demonstrating that both siRNA and rAAV methods of GNAQ Q209L depletion result in significant UVM cell death.

Keywords: AAV; G-alpha-q; GNAQ; MT: Regular Issue; adeno-associated virus; cancer gene therapy; uveal melanoma.


Conflict of interest statement

T.F.M., M.L.H., and J.J.B. are co-inventors of presented technology and hold part ownership of submitted patent U.S. Provisional Application No. 63/650,097. The remaining authors declare no competing interests.

Figures

None
Graphical abstract
Figure 1
Figure 1
Two siRNA sequences reduced clonogenic survival in a GNAQQ209L UVM cell line (A) GNAQwt and GNAQQ209L transcript sequences are depicted and aligned to 19 different anti-sense GNAQQ209L-targeting siRNA sequences. The mutant-targeted/wild-type mismatched nucleotide is highlighted in pink. P1 refers to the Q209L wild-type mismatched nucleotide in the first position relative to the 5′ end, while P19 refers to the nucleotide in the last position relative to the 5′ end of the antisense strand. All 19 siRNAs were examined for their ability to induce toxicity in Mel202 cells (GNAQQ209L) via clonogenic survival and alamarBlue fluorescence. (B) Mel202 clonogenic survival on day 20 after non-targeting control siRNA (NTC, n = 9) and P5 GNAQQ209L-targeting siRNA (P5) transfection (n = 12). (C) alamarBlue metabolic activity on day 6 after NTC (n = 12) and P5 siRNA transfection (n = 12). Fluorescence was measured at excitation 540 nanometers (nm) and emission 585 nm. (D) Representative brightfield microscopy images of bulk transfections with NTC (top) and P5 (bottom) GNAQQ209L-targeting siRNA in Mel202 cells, 72 h post-transfection, are depicted. White scale bars overlayed onto microscopy images represent 200 micrometers (μm). Solid bar graphs represent the mean of each dataset, and error bars represent ± the standard deviation (SD) of the mean. Statistical significance was determined using an unpaired t test. Significance levels are indicated by the following: ∗p < 0.05.
Figure 2
Figure 2
P5 GNAQQ209L-targeting siRNA preferentially reduces GNAQQ209L transcripts and YAP transcriptional activity (A) Total GNAQ expression measured via reverse-transcription (RT) quantitative PCR between NTC and P5 siRNA-transfected samples, 24 h post-transfection. Data consist of three experimental replicates and three technical replicates each and are normalized to the housekeeping gene human GAPDH for each sample and to the NTC data. (B) The results of next-generation Amplicon-EZ sequencing (NGS) of a 263-base pair GNAQ cDNA amplicon from NTC and P5 GNAQQ209L-targeting siRNA-transfected Mel202 cells are depicted as the percentage of total sequences. Each replicate is a single independent experiment, with a total of five independent experiments performed. Total sequence number varied among samples, with an average of 3.9×10⁵ (±1.0×10⁵) total sequences analyzed per sample. Figure 2B also depicts a representative image of the Partek Flow software analysis, portraying the abundance of recovered GNAQ cDNA sequences from NTC and P5 GNAQQ209L-targeting siRNA-transfected Mel202 cells. A black box is placed around the mutant nucleotide at position 626 on the GNAQ cDNA sequence. Blue = cytosine; yellow = guanine; red = thymine; green = adenine. (C) The functional impacts of the constitutively active Gαq protein in UVM were measured via the relative abundance of CYR61 and CTGF transcripts, which are both transcriptionally activated via the YAP protein, for both NTC- and P5 GNAQQ209L-targeting transfected Mel202 cells. Gene expression was normalized to human GAPDH. The data shown consist of three independent experiments with three technical replicates each. Error bars represent ± the SD of the mean. Statistical significance was determined using an unpaired t test. Significance levels are indicated by the following: ∗p < 0.05.
Figure 3
Figure 3
P5 GNAQQ209L-targeting siRNA does not affect viability or GNAQwt transcript abundance in GNAQwt UVM (A) P5 GNAQQ209L-targeting siRNA transfections of Mel285 (GNAQwt) UVM cells are shown for clonogenic survival (n = 17), alamarBlue metabolic activity (n = 18), and RT-qPCR of total GNAQ expression (n = 9). (B) P5 GNAQQ209L-targeting siRNA transfection of 92.1 (GNAQQ209L) UVM cells are shown for clonogenic survival (n = 22), alamarBlue metabolic activity (n = 20), and RT-qPCR of total GNAQ expression (n = 9). Clonogenic survival and alamarBlue metabolic activity data consist of at least three independent experiments with at least four technical replicates each. RT-qPCR data consist of three experimental replicates and three technical replicates. All data are normalized to the mean of the NTC. Solid bars represent the mean of each dataset, and error bars represent ± the SD of the mean. Statistical significance was determined using an unpaired t test. Significance levels are indicated by the following: ns, not significant; ∗p < 0.05.
Figure 4
Figure 4
Adeno-associated virus serotype 2 (AAV2) efficiently transduces UVM cell lines (A) Mel285, Mel202, and 92.1 human UVM cell lines were transduced with self-complementary adeno-associated virus (scAAV) preparations of capsid serotypes 1, 2, 3, 4, 5, 6, 8, and 9 at 1.0×10⁴ viral genomes per cell (vg/cell) containing a green fluorescent protein reporter transgene (GFP) under control of the ubiquitous cytomegalovirus promoter (CMV). Transduction efficiency is represented by the percentage of GFP+ cells and was quantified via flow cytometry 72 h post-transduction. The mean of at least four replicates is displayed in a heatmap. Cell lines are displayed on the y axis, and AAV serotypes are displayed on the x axis. The color key corresponding to the percentage of cells that were GFP+ is displayed on the right. (B) Representative GFP fluorescence microscopy images are displayed for scAAV2-transduced Mel285, Mel202, and 92.1 cell lines. Images shown were taken 72 h post-transduction of 1.0 × 10⁴ vg/cell scAAV2-CMV-GFP (bottom) and vehicle control, phosphate-buffered saline (PBS; top). White scale bars overlayed onto microscopy images represent 200 micrometers (μm).
Figure 5
Figure 5
rAAV2-shGNAQQ209L transduction results in GNAQQ209L UVM cell death, similar to that observed with P5 GNAQQ209L-targeting siRNA (A) The cis-regulatory elements and genetic cassettes of the single-stranded (ss) AAV vector are depicted (ITR, inverted terminal repeat; pU6, U6 RNA polymerase III promoter; pCMV, cytomegalovirus promoter; GFP, green fluorescent protein; SV40, simian virus 40). Black arrows indicate promoter sequences, direction, and location, and the large green arrow indicates the GFP open reading frame. Solid rectangles represent other coding and non-coding elements. Clonogenic survival and alamarBlue metabolic activity are shown for PBS (black bars, vehicle control) and 1.0×10⁴ vg/cell of rAAV2-shNTC (dark gray bars) or rAAV2-shGNAQQ209L (light gray bars) for (B) Mel285 (GNAQwt), (C) Mel202 (GNAQQ209L), and (D) 92.1 (GNAQQ209L) cell lines. Cells were analyzed 7 days post-transduction of vectors for alamarBlue metabolic activity and approximately 14 days post-transduction of vectors for clonogenic survival. Data consists of 2–3 independent experiments with at least four technical replicates each and was normalized to the mean of PBS. (E) Representative brightfield and GFP fluorescence microscopy images for PBS (left), rAAV-shNTC (middle), and rAAV-shGNAQQ209L (right)-treated Mel285 (top), Mel202 (middle), and 92.1 (bottom) cells are shown 6 days following PBS and vector addition. White scale bars overlayed onto microscopy images represent 200 micrometers (μm). Solid bars represent the mean of each dataset, and error bars represent ± the SD of the mean. Statistical significance was determined using an unpaired t test. Significance levels are indicated by the following: ns, not significant; ∗p < 0.05.

Similar articles

References

    1. Singh A.D., Turell M.E., Topham A.K. Uveal melanoma: trends in incidence, treatment, and survival. Ophthalmology. 2011;118:1881–1885. doi: 10.1016/j.ophtha.2011.01.040. - DOI - PubMed
    1. Chang A.E., Karnell L.H., Menck H.R. The National Cancer Data Base report on cutaneous and noncutaneous melanoma: a summary of 84,836 cases from the past decade. Cancer. 1998;83:1664–1678. doi: 10.1002/(sici)1097-0142(19981015)83:8<1664::aid-cncr23>3.0.co;2-g. - DOI - PubMed
    1. McLaughlin C.C., Wu X.C., Jemal A., Martin H.J., Roche L.M., Chen V.W. Incidence of noncutaneous melanomas in the U.S. Cancer. 2005;103:1000–1007. doi: 10.1002/cncr.20866. - DOI - PubMed
    1. Damato E.M., Damato B.E. Detection and time to treatment of uveal melanoma in the United Kingdom: an evaluation of 2,384 patients. Ophthalmology. 2012;119:1582–1589. doi: 10.1016/j.ophtha.2012.01.048. - DOI - PubMed
    1. Finger P.T. Yttrium-90 Episcleral Plaque Brachytherapy for Choroidal Melanoma. J. Vitreoretin. Dis. 2024;8:210–214. doi: 10.1177/24741264241227684. - DOI - PMC - PubMed

LinkOut - more resources