. 2025 Jul 21;33(3):201024.
doi: 10.1016/j.omton.2025.201024. eCollection 2025 Sep 18.

CDCP1-targeting ADC outperforms standard therapies in Ras-mutant pancreatic cancer

Affiliations

CDCP1-targeting ADC outperforms standard therapies in Ras-mutant pancreatic cancer

Yun Jung Um et al. Mol Ther Oncol. .

Abstract

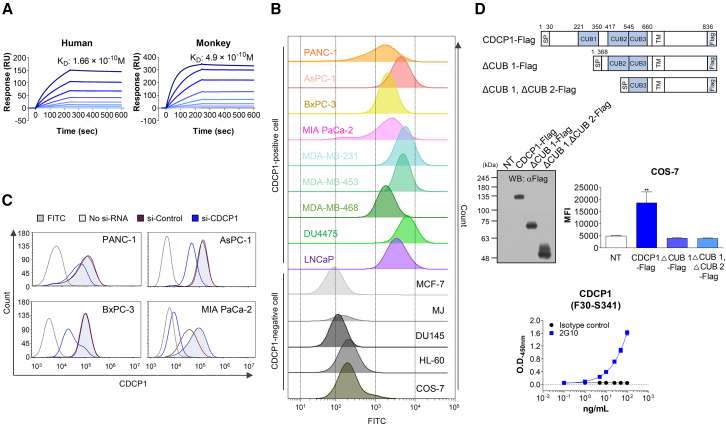
R AS mutations are found in 10%-30% of various cancers and in up to 90% of pancreatic cancers, where they are associated with aggressive phenotypes, poor prognosis, and reduced overall survival. CUB domain containing protein 1 (CDCP1), a transcriptional target of activated RAS, is implicated in these cancers irrespective of the specific R AS mutation. Given the limited effectiveness of small-molecule inhibitors against mutant Ras-driven cancers, we developed a CDCP1-targeting antibody-drug conjugate (ADC). In this study, we demonstrate that CDCP1 overexpression significantly correlates with R AS mutations in pancreatic cancer. We generated and characterized a CDCP1-specific monoclonal antibody, 2G10, and conjugated it to the topoisomerase II inhibitor, PNU159682, to produce 2G10-PNU159682. The anti-tumor activity of this ADC was evaluated in vitro and in vivo using pancreatic cancer cell lines. 2G10-PNU159682 exhibited superior efficacy compared to MRTX1133 and sotorasib in G12D- and G12C-mutant cell lines. In a mouse xenograft model, 2G10-PNU159682 demonstrated robust anti-tumor activity against R AS-mutant pancreatic cancers, outperforming gemcitabine and FOLFIRINOX and achieving complete tumor remission for up to 100 days-even following relapse after standard chemotherapy. These findings support the potential of 2G10-PNU159682 as a promising therapeutic candidate for the treatment of Ras-mutant cancers.

Keywords: 2G10-PNU159682; CDCP1; MT: Regular Issue; Ras mutation; antibody-drug conjugate; pancreatic cancer.


Conflict of interest statement

S.G.P. is a founder and CEO of the Novelty Nobility Inc. J.G.C., H.-J.K., J.-O.K., and T.M.W. are employees of the Novelty Nobility.

Figures

None
Graphical abstract
Figure 1
Figure 1
CDCP1 is highly overexpressed in KRAS-mutant pancreatic cancer (A) The mRNA levels of CDCP1 in different types of human cancer (TCGA) and normal tissue (GTEx and TCGA) were analyzed in silico. ∗∗∗ indicates a significant difference compared to the respective normal tissue. (B) CDCP1 protein levels were analyzed by western blot. HL-60, an acute myeloid leukemia cell line, was used as a CDCP1-negative cell line. The arrowhead indicates a truncated CDCP1 protein. Alpha-tubulin was used as a loading control. Abbreviations: PDAC, pancreatic adenocarcinoma; BRCA, breast cancer; EOC, epithelial ovarian cancer; COAD, colon adenocarcinoma; PRAD, prostate adenocarcinoma. (C) In silico comparison of CDCP1 mRNA levels in KRAS wild-type and mutant type pancreatic cancer (n = 179, TCGA). Seven primary tumor cases and one metastatic case were excluded from analysis due to no information of KRAS. ∗∗∗ vs. wild-type KRAS cancer. (D) Correlation between mutant KRAS (mKRAS) and CDCP1 was examined in silico using TCGA dataset and plotted using Pearson or Spearman correlation coefficient with corresponding p values. (E) Kaplan-Meier survival curve based on in silico analysis of TCGA datasets, comparing OS between high and low CDCP1 expression, and between wild-type and mutation KRAS status in patients with PDAC. High CDCP1 expression or KRAS mutation was associated with worse OS. (F) Representative images of IHC staining of CDCP1 using PDX of PDAC patients. Intensity scores were determined as 0 (negative), 1 (weak intensity), 2 (moderate intensity), or 3 (strong intensity). (G) Populations were grouped by intensity score and plotted with IHC score. ∗∗∗ vs. their respective control group with intensity score 1 or 2. ∗∗∗p < 0.001.
Figure 2
Figure 2
Generation and characterization of 2G10 antibody targeting CDCP1 (A) SPR analysis of 2G10 antibody. CDCP1 proteins from human and monkey were immobilized onto the chips as described in the methods. The 2G10 antibody was injected as an analyte in a dose-dependent manner. The KD value was evaluated using the Scrubber2 software and Biacore T200 Evaluation software v.3.2. (B and C) Determination of the specificity of 2G10 antibody to CDCP1. (B) CDCP1-positive or -negative cells were incubated with 2G10 antibody, followed by FACS analysis. (C) The indicated cells were transfected with control or CDCP1 siRNA for 48 h. The binding of 2G10 antibody to the indicated cells was analyzed by FACS. The images shown are representative of the siRNA experiments from three times independent replicates. (D) Identification of the CDCP1 binding domain of 2G10 antibody. A schematic diagram shows the construction of CDCP1 deletion mutants (upper). The indicated CDCP1 deletion constructs were cloned into the pCMV-3Tag-3a vector containing FLAG. Plasmids were transfected into COS-7 cells, and their expression was confirmed by western blotting using an anti-FLAG antibody (middle left). 2G10 antibody (0.5 μg/mL) was incubated with COS-7 cells expressing CDCP1 constructs, and the binding of 2G10 antibody was analyzed by FACS (middle right). ∗∗ vs. NT. The results represent means ± SEM of at least three independent experiments. NT stands for non-transfected. The protein including the CUB1 domain (F30—S341 aa, 50 ng/well) was coated to 96-well plates, and the binding of 2G10 antibody was examined at the indicated concentrations (bottom). Normal mouse IgG was used as a negative control. ∗∗p < 0.01.
Figure 3
Figure 3
Internalization of the 2G10 antibody in pancreatic cancer cells (A) Cells were seeded onto microscope cover glasses in a 12-well culture plates: PANC-1 (1 × 10⁵ cells), AsPC-1 (2 × 10⁵ cells), BxPC-3 (2 × 10⁵ cells), and MIA PaCa-2 (0.5 × 10⁵ cells). After blocking with a blocker for 30 min, cells were treated for 1 h at 4°C with 2G10 antibody (10 μg/mL) conjugated with the anti-mouse IgG-conjugated Alexa 488 (10 μg/mL). Lysosomes were stained with anti-LAMP-1 for 1 h, and the nuclei were counterstained with DAPI (100 nM) at room temperature. The fluorescent images were captured using a confocal microscope at 60× magnification. The experiments were repeated independently at least three times. (B) Pancreatic cancer cells were pre-incubated with CHX (75 μg/mL) and blocked with Fc blocker for 10 min to inhibit the Fc receptor-mediated internalization. The cells were then incubated in the presence or absence of 2G10 antibody (100 ng/mL) at 4°C or 37°C for 2 h and followed by flow cytometry analysis. The fluorescent signal of the 2G10 antibody/CDCP1 complex on the cell surface decreased after incubation at 37°C.
Figure 4
Figure 4
CDCP1 is highly correlated with expression levels of MDRs and topoisomerases in PDAC (A) The mRNA levels of various target genes, including those involved in cell division (TUBB3), transcription (POLR2A), DNA replication and recombination (TOP1, TOP2A, and TOP2B), DNA repair (ERCC6 and ERCC8), and genes involved in drug resistance (ABCB1, ABCG2, ABCC1, ABCC2, ABCC3, ABCC4, and ABCC5) were analyzed in silico using data from TCGA and GTEx databases. ∗∗∗ vs. their corresponding normal tissue. (B) In silico correlation analysis of CDCP1 and payload target genes or MDR gene expression levels in TCGA database. (C) IC50 values were determined in CDCP1-positive cell lines (PANC-1, AsPC-1, BxPC-3, MIA PaCa-2, and MDA-MB-468) and CDCP1-negative cell lines (CT26 and MCF-7) with the unconjugated 2G10 antibody and various 2G10-ADCs conjugated with MMAE, αAmanitin, Duocarmycin SA, or PNU159682. Cells were treated with serially diluted concentrations of the indicated test articles for 3 days. The cells were stained with Hoechst 33342 (3.3 μM), at 37°C for 60 min and analyzed using a Celigo Imaging Cytometer. The results represent the mean ± SEM of at least three independent experiments. ∗∗∗p < 0.001.
Figure 5
Figure 5
Generation and characterization of 2G10-PNU159682 (A) The unconjugated antibody and 2G10-PNU159682 were compared using non-reducing and reducing SDS-PAGE. R and C stand for reduced antibody and conjugated antibody with PNU159682, respectively. (B) The binding affinity of naked 2G10 antibody and 2G10-PNU159682 to pancreatic cancer cells was compared using flow cytometry. (C) PANC-1 or MCF-7 cells were treated with vehicle, isotype control antibody, 2G10 antibody (0.1 μg/mL), isotype-PNU159682 (0.1 μg/mL), or 2G10-PNU159682 (0.1 μg/mL) for 24, 36, and 48 h. Cells were then fixed and stained with propidium iodide, followed by cell-cycle analysis using a Celigo Imaging Cytometer (∗, ∗∗, and ∗∗∗ vs. their respective corresponding vehicle; #, ##, ### vs. isotype-PNU159682). 2G10-PNU159682 increased the S phase cell population in PANC-1. MCF-7 cells were used as the CDCP1-negative cells. The results represent mean ± SD from at least three independent experiments. (D) For apoptosis assay, PANC-1 or MCF-7 cells were seeded into 96-well plates and incubated with vehicle, isotype control antibody (0.1 μg/mL), 2G10 antibody (0.1 μg/mL), isotype-PNU159682 (0.1 μg/mL), or 2G10-PNU159682 (0.1 μg/mL) for 36 h. Cells were stained with caspase 3/7 reagent (2 μM) and Hoechst 33342 (10 μM) and analyzed using a Celigo Imaging Cytometer (∗∗∗, ### vs. their respective corresponding control, vehicle or isotype-PNU159682). MCF-7 cells were used as the CDCP1-negative cells. The results have been represented as mean ± SD from at least three independent experiments. (E) IC50 values of the indicated treatments in pancreatic cancer cells or breast cancer cells were evaluated. Cells were treated with serially diluted concentrations of the indicated test articles for 3 days. The cells were stained with Hoechst 33342 (3.3 μM) at 37°C for 60 min and analyzed using a Celigo Imaging Cytometer. The results represent mean ± SEM of at least three independent experiments. ∗, #p < 0.05; ∗∗, ##p < 0.01; ∗∗∗, ###p < 0.001.
Figure 6
Figure 6
2G10-PNU159682 suppresses PDAC tumor growth both as a monotherapy and in combination with standard chemotherapy (A–C) Mice with established tumors were randomized into treatment groups (n = 5–7) when tumors volume reached 150–250 mm3. The mice were intravenously administered the indicated test articles on days 0, 7, and 14. Isotype control antibody, isotype-PNU159682, and 2G10 antibody were administered at 0.5 mg/kg. PANC-1- or MIA PaCa-2-implanted groups were used as CDCP1-positive cancer model. HL-60-implanted groups were used as a CDCP1-negative control. Green arrows indicate the administration of test articles. ∗, ∗∗, ∗∗∗ vs. vehicle; #, ## vs. isotype-PNU159682. (D–I) When tumors volume reached ∼170 mm3, mice were randomized into treatment groups: vehicle (n = 10), GEM or FFX (n = 10), and combination of GEM or FFX with 2G10-PNU159682 (n = 10). (D) Drug administration schedules are depicted in schematic diagrams. (E and F) When the volume of tumors reached ∼200 mm3, mice were randomized into different treatment groups: vehicle (n = 10), GEM (n = 10), and a combination of GEM and 2G10-PNU159682 (n = 10). GEM (50 mg/kg, light blue arrow, i.p.) was administered on days 0, 3, 7, and 10, and 2G10-PNU159682 (0.1 mg/kg, blue arrow, i.v.) was administered on days 0, 7, and 14. Upon tumor relapse (volume 300–400 mm3) after GEM cessation, mice were re-randomized into vehicle and 2G10-PNU159682. 2G10-PNU159682 (0.5 mg/kg) was intravenously administered at the indicated days (deep blue arrowhead). ∗, ∗∗∗ vs. vehicle; ##, ### vs. GEM. (G) Schematic diagram for drug administration. (H and I) When the volume of tumors reached ∼200 mm3, mice were randomized into vehicle (n = 10), FFX (n = 10), and combination of FFX and 2G10-PNU159682 (n = 10). FFX (leucovorin at 50 mg/kg; 5-FU at 25 mg/kg; irinotecan at 25 mg/kg; oxaliplatin at 2.5 mg/kg, light purple arrow, i.p.) was administered on days 0 and 7, and 2G10-PNU159682 (0.1 mg/kg, purple arrow, i.v.) was administered on days 0, 7, and 14. Upon tumor relapse (volume 300–400 mm3) after FFX cessation, mice were re-randomized into vehicle and 2G10-PNU159682. 2G10-PNU159682 (0.5 mg/kg) was intravenously administered at the indicated days (deep purple arrowhead). i.p and i.v. stand for intraperitoneal injection and intravenous injection, respectively. ∗∗∗ vs. vehicle; #, ## vs. FFX. ∗, #p < 0.05; ∗∗, ##p < 0.01; ∗∗∗, ###p < 0.001.

References

    1. Mo S.P., Coulson J.M., Prior I.A. RAS variant signalling. Biochem. Soc. Trans. 2018;46:1325–1332. - PMC - PubMed
    1. Simanshu D.K., Nissley D.V., McCormick F. RAS proteins and their regulators in human disease. Cell. 2017;170:17–33. - PMC - PubMed
    1. Guerrero S.l., Casanova I., Farré L., Mazo A., Capellà G., Mangues R. K-ras codon 12 mutation induces higher level of resistance to apoptosis and predisposition to anchorage-independent growth than codon 13 mutation or proto-oncogene overexpression. Cancer Res. 2000;60:6750–6756. - PubMed
    1. Khan A.Q., Kuttikrishnan S., Siveen K.S., Prabhu K.S., Shanmugakonar M., Al-Naemi H.A., Haris M., Dermime S., Uddin S. Elsevier; 2019. RAS-Mediated Oncogenic Signaling Pathways in Human Malignancies. Paper Presented at: Seminars in Cancer Biology. - PubMed
    1. Prior I.A., Lewis P.D., Mattos C. A comprehensive survey of Ras mutations in cancer. Cancer Res. 2012;72:2457–2467. - PMC - PubMed

LinkOut - more resources