. 2025 Jul 23:16:1614301.
doi: 10.3389/fmicb.2025.1614301. eCollection 2025.

Overcoming challenges in metagenomic AMR surveillance with nanopore sequencing: a case study on fluoroquinolone resistance

Affiliations

Overcoming challenges in metagenomic AMR surveillance with nanopore sequencing: a case study on fluoroquinolone resistance

Bram Bloemen et al. Front Microbiol. .

Abstract

Introduction: Antimicrobial resistance is an alarming public health problem, and comprehensive surveillance across environments is required to reduce its impact. Phenotypic testing and whole-genome sequencing of isolates are efficient, but culture-free approaches like metagenomic sequencing potentially allow for broader investigation of resistance gene occurrence, evolution and spread. However, technical challenges such as difficulties in associating antimicrobial resistance genes with their bacterial hosts and the collapse of strain-level variation during metagenome assembly, hinder its implementation.

Methods: To illustrate how these challenges can be overcome, we applied Oxford Nanopore Technologies long-read metagenomic sequencing and novel bioinformatic methods to a case study focused on fluoroquinolone resistance in chicken fecal samples.

Results: We demonstrate plasmid-host linking based on detecting common DNA methylation signatures. Additionally, we use new bioinformatic approaches for strain haplotyping, enabling phylogenomic comparison and uncovering fluoroquinolone resistance determining point mutations in metagenomic datasets.

Discussion: We leverage long-read sequencing, including DNA methylation profiling and strain-level haplotyping, to identify antimicrobial resistance gene hosts, link plasmids to their bacterial carriers, and detect resistance-associated point mutations. Although some limitations remain, our work demonstrates how these improvements in metagenomic sequencing can enhance antimicrobial resistance surveillance.

Keywords: DNA methylation; antimicrobial resistance (AMR); metagenomic sequencing; nanopore sequencing; plasmid host prediction; strain-resolved metagenomics.


Conflict of interest statement

The authors declare that the research was conducted in the absence of any commercial or financial relationships that could be construed as a potential conflict of interest.

Figures
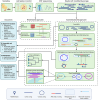
Flowchart illustrating the process of sequencing and analyzing microbiomes. It starts with sampling and adding spike-in controls, followed by ONT sequencing. Outputs include read-based and assembly-based approaches. The read-based approach enables resistome profiling and taxonomic classification, while the assembly-based approach involves binning, classification, and AMR detection. Methylation analysis and strain haplotyping provide insights into plasmid-host links and phylogenetic analysis. The diagram uses symbols for modified bases, contigs, ARGs, and resistance mutations to represent data flow and relationships.
Figure 1
Overview of metagenomic antimicrobial esistance (AMR) investigation. We sampled chicken feces from farms, added spike-in control bacteria, and used Oxford Nanopore Technologies sequencing with methylation calling to generate long reads with methylation base tags. Antimicrobial resistance genes (ARGs) were then identified using a read-based approach (A), and through metagenomic assembly and binning (assembly-based approach) (B). For the read-based approach, ARG-carrying reads were also retrieved from their taxonomic alignment for host linking. For the assembly-based approach, methylation motifs were used for bin improvement and plasmid-host linking (C). Strain haplotyping then allowed for phylogenomic investigation and detection of strain-level AMR, including point mutations associated with AMR, which we did for fluoroquinolone resistance (D).
Bar charts and network graphs comparing antibiotic resistance genes in samples A and B. The bar charts (top) show distribution of various resistance genes by type, including aminoglycosides and beta-lactams, with different color coding. The network graphs (bottom) map associations between bacterial species and resistance genes, highlighting connections between Fluoroquinolone resistance genes and their hosts.
Figure 2
(A, B) Resistome profile in terms of logarithmically scaled depth of coverage per antimicrobial resistance gene (ARG) for samples A and B, respectively, with fluoroquinolone (FQ) ARGs indicated in bold on the x-axis. (C, D) ARG-host links as determined via ARG detection in reads and read taxonomic alignment. FQ ARGs and their hosts are highlighted with bold nodes, bold text, and highlighted edges. In (C), both I. halotolerans and A. halotolerans are indicated as carrying an ARG. In (D), A. halotolerans is reported as ARG host as well. MLS-B: macrolide, lincosamide, streptogramin-B.
Four-panel figure displaying data analysis of methylation motifs and genome clustering. Panel A is a heatmap showing methylation percentage across contigs with various methylation motifs listed. Panel B is a scatter plot using UMAP dimensions highlighting plasmids and genomes like E. coli. Panel C is another heatmap illustrating methylation motifs, indicating hierarchical clustering of contigs. Panel D is a UMAP plot revealing clusters of different microbial species and genomic elements, depicted with various colored shapes indicating chromosomes, plasmids, and viruses, differentiated by depth. Panels A and B highlight the similar methylation motifs in E. coli, some unbinned plasmids, and a few other species with similar methylation motifs. Panels C and D include a broader range of species.
Figure 3
Contig methylation profiles in sample A, visualized in hierarchically clustered heatmaps (A, C) and UMAP plots (B, D). Colors next to the rows (representing contigs) in (A) and (C) indicate the metagenomic bins as determined by the Nanomotif-refined binning method, while columns represent methylation motifs. Cell colors represent methylation percentage. In the UMAP plots (B, D), contigs are shaped according to their genomad classification, and colored by bin [cfr (A, C)]. In all plots, motifs were only included if they were at least 50% methylated in at least a single contig. Bins with completeness <10% are excluded, and for each bin the largest 10 contigs are shown. The upper plots (A, B) focus on the unbinned plasmids (contig 847, 1,029, and 640, gray) and the bins with the most similar methylation profiles to these plasmid: E. coli (light red) and K. pneumoniae (green). The qnrS1-carrying plasmid [contig 847 in (A) and indicated in (B)] most closely resembles the E. coli genome in terms of methylation [contig 501 in (A), indicated in (B)]. Contig 866 (light red) is binned as E. coli, but clusters more closely with K. pneumoniae contigs in (A, B). The lower plots (C, D) show the overall methylation profiles of the metagenomic assembly. A legend shows al bins by color. Some bins (e.g., contig_bins_binned.tsv_23_sub) were >10% complete, but could not be classified to species or genus level using gtdb-tk.
Phylogenetic tree and heatmap displaying genetic relationships among isolates from different farms, labeled as Farm A to D, using ILMN and ONT sequencing methods. The tree indicates evolutionary distances, with numbers signifying branch support. The heatmap columns represent various genes, with colored blocks indicating gene presence or absence, and black blocks denoting IncHI2: MOBP plasmid presence. Tree scale is 0.1.
Figure 4
SNP-based phylogeny of E. coli ST10 isolates obtained from multiple farms and the sample A E. coli MAG. As reference sequence, a hybrid assembly of Farm A Isolate 3 was used, from which plasmids were removed. All Farm A isolates (red branch) cluster closely together, contain a similar antimicrobial resistance gene (ARG) profile and carry an IncFII, MOBP plasmid with the qnrS1 gene. All ARGs in the farm A isolates were carried on plasmids. The ILMN: Illumina short reads, ONT: Oxford Nanopore Technologies long reads. Branch length and three scale represent average number of substitutions per site. The numbers on the branches represent bootstrap values.

References

    1. Abramova A., Karkman A., Bengtsson-Palme J. (2024). Metagenomic assemblies tend to break around antibiotic resistance genes. BMC Genomics 25:959. 10.1186/s12864-024-10876-0 - DOI - PMC - PubMed
    1. Agustinho D. P., Fu Y., Menon V. K., Metcalf G. A., Treangen T. J., Sedlazeck F. J. (2024). Unveiling microbial diversity: harnessing long-read sequencing technology. Nat. Methods 21, 954–966. 10.1038/s41592-024-02262-1 - DOI - PMC - PubMed
    1. Anjum M. F., Zankari E., Hasman H. (2017). Molecular methods for detection of antimicrobial resistance. Microbiol. Spectr. 5. 10.1128/microbiolspec.ARBA-0011-2017 - DOI - PMC - PubMed
    1. Beaulaurier J., Zhu S., Deikus G., Mogno I., Zhang X.-S., Davis-Richardson A., et al. (2018). Metagenomic binning and association of plasmids with bacterial host genomes using DNA methylation. Nat. Biotechnol. 36, 61–69. 10.1038/nbt.4037 - DOI - PMC - PubMed
    1. BELMAP . (2024). BELMAP 2024: One Health Report of Antimicrobial Consumption and Resistance in Belgium. Brussels: BELMAP . 10.25608/v1x6-1e19 - DOI

LinkOut - more resources