. 2024 Feb 12:2:imag-2-00091.
doi: 10.1162/imag_a_00091. eCollection 2024.

Detection of respiration-induced field modulations in fMRI: A concurrent and navigator-free approach

Affiliations

Detection of respiration-induced field modulations in fMRI: A concurrent and navigator-free approach

Alexander Jaffray et al. Imaging Neurosci (Camb). .

Abstract

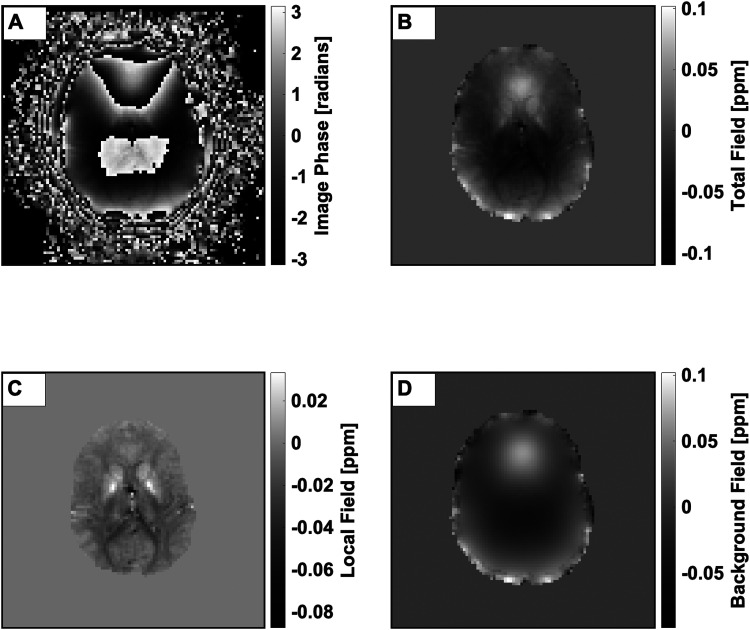
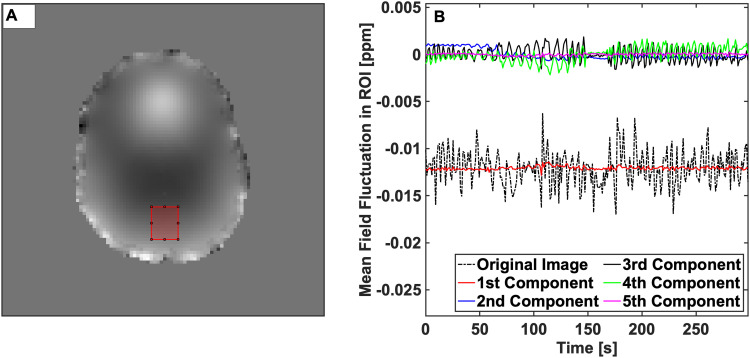
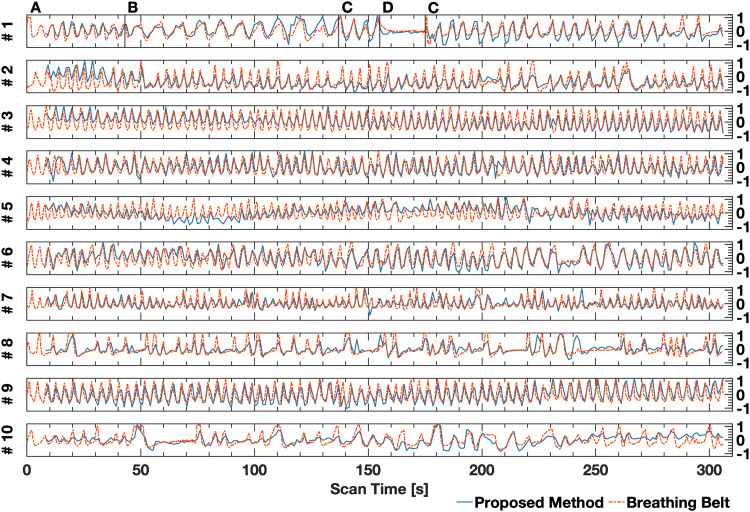
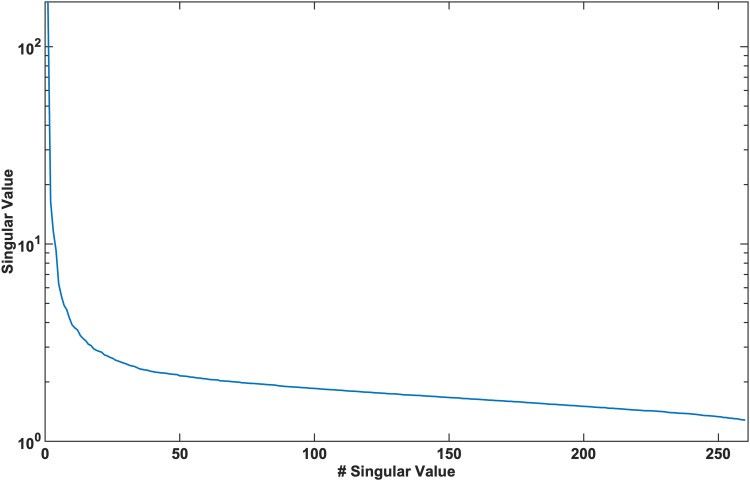
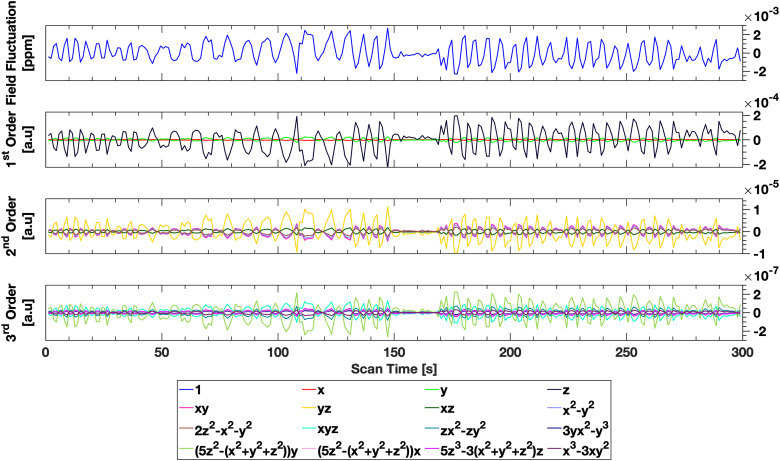
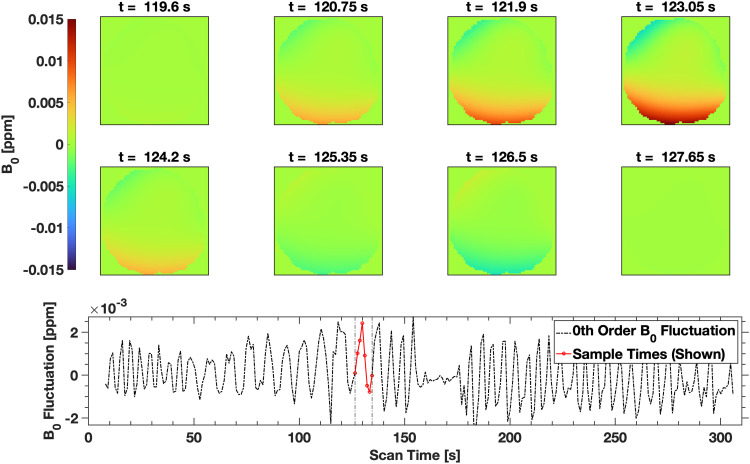
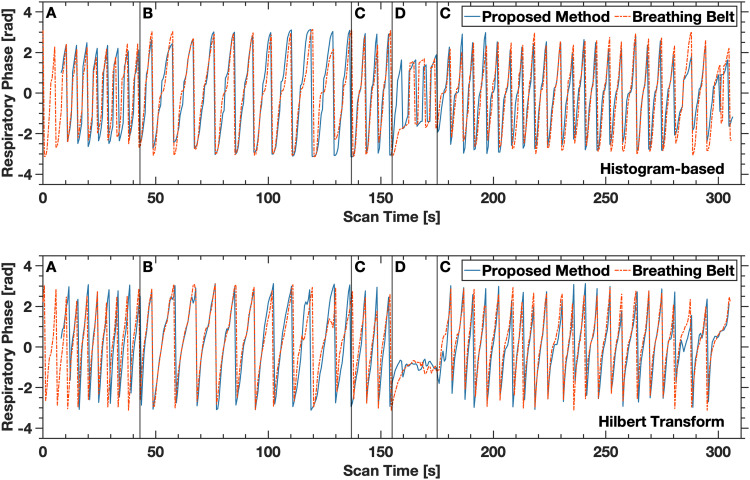
Functional Magnetic Resonance Imaging (fMRI) is typically acquired using gradient-echo sequences with a long echo time at high temporal resolution. Gradient-echo sequences inherently encode information about the magnetic field in the often discarded image phase. We demonstrate a method for processing the phase of reconstructed fMRI data to isolate temporal fluctuations in the harmonic fields associated with respiration by solving a blind source separation problem. The fMRI-derived field fluctuations are shown to be in strong agreement with breathing belt data acquired during the same scan. This work presents a concurrent, hardware-free measurement of respiration-induced field fluctuations, providing a respiratory regressor for fMRI analysis which is independent of local contrast changes, and with potential applications in image reconstruction and fMRI analysis.

Keywords: fMRI; field mapping; off-resonance; physiological noise; quantitative susceptibility mapping; respiratory monitoring.


Conflict of interest statement

The authors have no conflicts of interest to declare.

Figures

Fig. 1.
Fig. 1.
Illustration of the pipeline from raw image phase to harmonic background field. All images are of a single slice taken from the first timepoint of the fMRI time-series. (A) Raw image phase. (B) Image phase after unwrapping with Laplacian unwrapping. (C) The projection of the total field onto the local susceptibility sources within the volume of interest. Note the absence of low-frequency phase modulation across the slice. (D) The isolated harmonic field, obtained by subtraction of the local field in (C) from the total field depicted in (B).
Fig. 2.
Fig. 2.
(A) An example region of interest, depicted in red, overlaid onto the mean of the 1st component of the harmonic field decomposition in an example slice from the control subject. (B) Time-varying magnetic field within the region of interest shown as a dashed line. The colored lines show the first 5 right singular vectors in the time domain, which sum to the raw field evolution (dashed). The black (third) component is clearly periodic and contains most of the temporal variation in the measured magnetic field.
Fig. 3.
Fig. 3.
Respiration induced zeroth order field modulation derived from fMRI time-series data using the proposed method (blue) and externally monitored respiratory trace (red, dashed) for all fMRI scans (numbered #1-10). Strong agreement is shown between both the proposed method and the externally monitored respiratory trace. Each trace depicted (for both methods) was normalized to the interval [-1, 1] to facilitate visual comparison. The temporal range and sampling interval (x-axis) were identical for all fMRI scans. Controlled breathing intervals are indicated for subject #1 using the letters A, B, C, and D. Label A denotes shallow breathing, label B denotes deep breathing, label C denotes free-breathing, and label D denotes a breath hold. Breathing was unregulated for the other 9 scans.
Fig. 4.
Fig. 4.
Singular values of the matrix P demonstrating significant decay beyond the first 5 singular values. The first 5 singular vectors describe 97% of the variance in the data, validating the assumption in the proposed work that the matrix P can be well-characterized by a low-rank approximation.
Fig. 5.
Fig. 5.
Projection of the temporal evolution of the field onto solid harmonics (see legend for definition) for the control subject, obtained using the proposed method. The primary fluctuation observed is in the zeroth order coefficient, however strong correlations are seen across all coefficients, indicating that respiratory induced field fluctuations can likely be described by a single mode. Instructed breathing periods are seen in all coefficients. The zeroth order fluctuations demonstrate a maximal field excursion of 2.5 ppb, however local field excursions due to higher order coefficients can be up to 15 ppb.
Fig. 6.
Fig. 6.
Illustration of the respiration-induced field modulation during a single respiratory period for the control subject. Each image is a masked depiction of the field in the central axial slice of the imaging volume, sampled during the scan at time points indicated in the lower sub-figure. The maximal field excursion over the respiratory period in the imaging volume is [-5 ppb, +15 ppb].
Fig. 7.
Fig. 7.
Respiratory phase derived from fMRI time-series data (blue) and externally monitored respiratory phase (dashed red). The top image was generated using a histogram-based respiratory phase calculation method, and the bottom image was generated from instantaneous phase calculated using the Hilbert transform. Structured breathing patterns are denoted with the letters A through D. Shallow breathing is denoted with the letter A. Deep, slow breathing is denoted with the letter B. Free breathing is denoted with the letter C. A breath hold was conducted during the period denoted with the letter D. Strong agreement is shown between both the fMRI-derived respiratory phase and the externally monitored respiratory phase, with peak and trough locations showing good correspondence.

Similar articles

References

    1. Addeh, A., Vega, F., Medi, P. R., Williams, R. J., Pike, G. B., & MacDonald, M. E. (2023). Direct machine learning reconstruction of respiratory variation waveforms from resting state fMRI data in a pediatric population. NeuroImage, 269, 119904. 10.1016/j.neuroimage.2023.119904 - DOI - PubMed
    1. Agrawal, U., Brown, E. N., & Lewis, L. D. (2020). Model-based physiological noise removal in fast fMRI. NeuroImage, 205, 116231. 10.1016/j.neuroimage.2019.116231 - DOI - PMC - PubMed
    1. Ayaz, M., Boikov, A., McAuley, G., Schrag, M., Kido, D. K., Haacke, E. M., & Kirsch, W. (2011). Imaging cerebral microbleeds with SWI. In Susceptibility weighted imaging in MRI (pp. 191–214). John Wiley & Sons, Ltd. 10.1002/9780470905203.ch12 - DOI
    1. Bancelin, D., Bachrata, B., Bollmann, S., de Lima Cardoso, P., Szomolanyi, P., Trattnig, S., & Robinson, S. D. (2023). Unsupervised physiological noise correction of functional magnetic resonance imaging data using phase and magnitude information (PREPAIR). Human Brain Mapping, 44(3), 1209–1226. 10.1002/hbm.26152 - DOI - PMC - PubMed
    1. Birn, R. M., Diamond, J. B., Smith, M. A., & Bandettini, P. A. (2006). Separating respiratory-variation-related fluctuations from neuronal-activity-related fluctuations in fMRI. NeuroImage, 31(4), 1536–1548. 10.1016/j.neuroimage.2006.02.048 - DOI - PubMed

LinkOut - more resources