. 2024 Sep 13:2:imag-2-00288.
doi: 10.1162/imag_a_00288. eCollection 2024.

ACID: A comprehensive toolbox for image processing and modeling of brain, spinal cord, and ex vivo diffusion MRI data

Affiliations

ACID: A comprehensive toolbox for image processing and modeling of brain, spinal cord, and ex vivo diffusion MRI data

Gergely David et al. Imaging Neurosci (Camb). .

Abstract

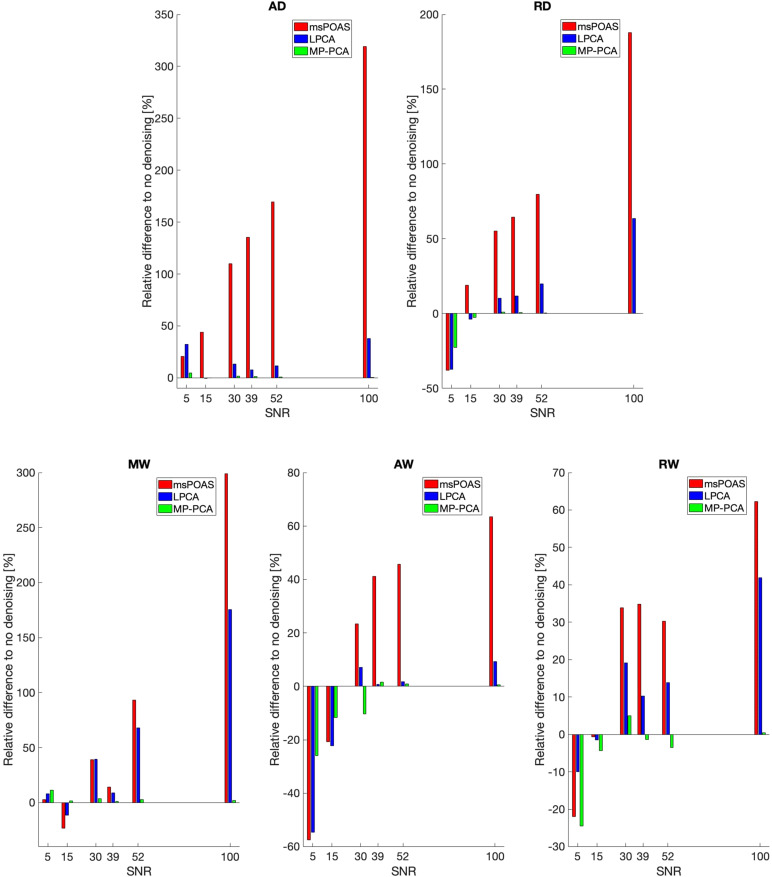
Diffusion MRI (dMRI) has become a crucial imaging technique in the field of neuroscience, with a growing number of clinical applications. Although most studies still focus on the brain, there is a growing interest in utilizing dMRI to investigate the healthy or injured spinal cord. The past decade has also seen the development of biophysical models that link MR-based diffusion measures to underlying microscopic tissue characteristics, which necessitates validation through ex vivo dMRI measurements. Building upon 13 years of research and development, we present an open-source, MATLAB-based academic software toolkit dubbed ACID:A Comprehensive Toolbox forImage Processing and Modeling of Brain, Spinal Cord, and Ex VivoDiffusion MRI Data. ACID is an extension to the Statistical Parametric Mapping (SPM) software, designed to process and model dMRI data of the brain, spinal cord, and ex vivo specimens by incorporating state-of-the-art artifact correction tools, diffusion and kurtosis tensor imaging, and biophysical models that enable the estimation of microstructural properties in white matter. Additionally, the software includes an array of linear and nonlinear fitting algorithms for accurate diffusion parameter estimation. By adhering to the Brain Imaging Data Structure (BIDS) data organization principles, ACID facilitates standardized analysis, ensures compatibility with other BIDS-compliant software, and aligns with the growing availability of large databases utilizing the BIDS format. Furthermore, being integrated into the popular SPM framework, ACID benefits from a wide range of segmentation, spatial processing, and statistical analysis tools as well as a large and growing number of SPM extensions. As such, this comprehensive toolbox covers the entire processing chain from raw DICOM data to group-level statistics, all within a single software package.

Keywords: BIDS; SPM12; artifact correction; biophysical modeling; brain and spinal cord; diffusion MRI.


Conflict of interest statement

The authors declare no competing interests.

Figures

Fig. 1.
Fig. 1.
Selected maps derived from diffusion kurtosis imaging (DKI) using an in vivo brain, in vivo spinal cord, and ex vivo dMRI dataset (refer toTable 4for details on the dataset). Shown are maps of fractional anisotropy (FA), mean diffusivity (MD), axial diffusivity (AD), radial diffusivity (RD), mean kurtosis (MK), axial kurtosis (AK), and radial kurtosis (RK).
Fig. 2.
Fig. 2.
Maps of biophysical parameters derived from the WMTI-Watson model using an in vivo brain, in vivo spinal cord, and ex vivo dMRI dataset (refer toTable 4for details on the dataset). Shown are maps of Watson concentration parameter (κ), axonal water fraction (f), parallel and perpendicular extra-axonal diffusivities (De,andDe,), and intra-axonal diffusivity (Da). Note that for the in vivo spinal cord dataset, the maximum b-value (b = 1500 s/mm2) was probably too low for an accurate estimation ofDe,, resulting in voxels with negative (hence unphysical) values within the spinal cord. Since WMTI-Watson is a white matter biophysical model, the parameter maps were masked for the white matter in the brain dataset. For the spinal cord and ex vivo specimen, we refrained from masking for the white matter due to the difficulty of obtaining an accurate white matter mask.
Fig. 3.
Fig. 3.
Standard processing pipelines for typical (A) in vivo brain, (B) in vivo spinal cord, and (C) ex vivo dMRI datasets (refer toTable 4for details on the datasets andTable 5for details on the pipeline settings). Example batches for each type of dMRI data are stored in the Example_Batches folder of the toolbox. The positions of the displayed slices of the dMRI data are indicated in purple on the corresponding structural images. For the ex vivo specimen (C), the brain region from which the sample was extracted is highlighted in an orange box. Although not explicitly shown here, noise estimation should be performed on the unprocessed data (seeAppendix C), which serves as input for msPOAS, Rician bias correction, and diffusion tensor fitting (for fitting methods WLS and robust fitting). However, in case of substantial misalignments across volumes, and when using therepeated measuresnoise estimation method, it might be beneficial to perform this step after ECMOCO to prevent an overestimation of noise. For msPOAS, a zoomed-in visual comparison is shown between a diffusion-weighted (DW) image before (middle row) and after applying msPOAS (bottom row); the msPOAS-corrected image appears less noisy while preserving tissue edges. For HySCO, contour lines of the corresponding structural image (displayed as red lines) are overlaid on a zoomed-in DW image both before (middle row) and after applying HySCO (bottom row). HySCO improves the alignment between the DW and the structural image. For the in vivo brain dMRI dataset (A), an inferior slice is shown that presents high susceptibility-related distortions, making the effect of HySCO more visible. For the ex vivo dMRI dataset (C), the effect of HySCO is shown in a slice (illustrated in yellow) orthogonal to the original one (illustrated in purple) to better visualize susceptibility-related distortions and their correction. Note that HySCO is applied as the final preprocessing step, that is, after applying msPOAS; however, the HySCO field map used for “unwarping” the diffusion-weighted images is estimated on the ECMOCO-corrected datasets, that is, before applying msPOAS. Rician bias correction (not explicitly shown here) should be applied either before (recommended: between msPOAS and HySCO, using the RBC module) or during model fitting (using the Rician bias correction option in NLLS). Diffusion signal models are fitted on the processed dataset; here, we display the maps of fractional anisotropy (FA) and mean kurtosis tensor (MW) from diffusion kurtosis imaging (DKI). The output from DKI can be used to compute biophysical parameters of the white matter; shown here is the map of Watson concentration parameter (κ) from the WMTI-Watson biophysical model. Note that for the in vivo brain dMRI dataset, the inferior slice displayed contains relatively little white matter; hence, we refrained from using a white matter mask. The less smooth appearance of theκmap is due to the low values in the gray matter.
Fig. 4.
Fig. 4.
(A) Illustration of differences in the cross-sectional area between the brain and spinal cord, displaying a single axial slice of the mean T2-weighted (b0) image (refer toTable 4for details on the datasets). (B) Schematic visualization of the spinal cord, highlighting the “butterfly-shaped” gray matter, which is located in the middle of the spinal cord and contains neuronal cell bodies and loosely aligned fibers, and the surrounding white matter, which contains highly aligned fibers.
Fig. 5.
Fig. 5.
Merging of two fractional anisotropy (FA) maps, covering the brain and cervical cord, respectively, into a unified FA map using theFusionutility function (Table 2). The two images should ideally share an overlapping region, but they may have different geometric properties such as resolution and number of slices. In the overlapping region, the voxel intensity values are computed as the average of the intensity values from the two images. The merging process requires a structural image as the registration target. The combined FA map is resampled onto the higher resolution structural image, resulting in a smoother appearance.
Appendix Fig. A1
Appendix Fig. A1
The left panel shows the location of the ACID toolbox in the SPM Batch Editor after successful installation (SPM -> Tools). The toolbox is organized into six modules, each of which may be further divided into submodules. The right panel provides an example of a submodule (Diffusion Tensor Imagingwithin theDiffusion tensor/kurtosis imagingmodule). Each (sub-) module requires at least one mandatory input, indicated by “X,” as well as several optional inputs and parameter settings, which can be adjusted for customization. Recommended settings for typical in vivo brain, in vivo spinal cord, and ex vivo dMRI datasets are presented inTable 5.
Appendix Fig. B1
Appendix Fig. B1
Registration scheme for an example dMRI dataset, which consists of two sets of nondiffusion-weighted (b0) volumes (nvolumes each) and two sets of diffusion-weighted (DW) volumes (Nvolumes each) interspersed with each other. The b0 and DW volumes form separate registration groups and are registered to their corresponding target volumes. First, the b0 volumes are registered using the rigid-body components of the specified degrees of freedom (DOF), followed by the registration of the DW volumes using all specified DOF. The parameter iteration for a given b0 or DW can be initialized using previously obtained transformation parameters (initialized registration).
Appendix Fig. B2
Appendix Fig. B2
Qualitative comparison of different motion correction techniques including no correction, volume-wise ECMOCO, and the combination of volume- and slice-wise ECMOCO. The plots show the concatenation of 1D cross-sections along the phase-encoding (PE) direction (anterior-posterior), extracted at fixed x- and z-coordinates from each of the 120 diffusion-weighted (DW) volumes in an in vivo spinal cord dMRI dataset. Additionally, zoomed-in views of a subset of DW volumes are provided to facilitate the assessment of improvements by ECMOCO. Substantial motion along the y-direction was initially observed, which was notably reduced after applying ECMOCO. Importantly, volume-wise ECMOCO did not entirely correct for spatial misalignments in all volumes (an example of failed correction is indicated by the red arrow). Conversely, the combination of volume- and slice-wise ECMOCO effectively corrected spatial misalignments in all DW volumes.
Appendix Fig. C1
Appendix Fig. C1
Definition of noise regions of interest (ROI) for therepeated measuresnoise estimation method (seeNoise estimationinTable 2). Binary noise ROIs are outlined in red. For in vivo brain and spinal cord dMRI, we recommend creating a noise ROI within the cerebrospinal fluid (CSF), such as the lateral ventricles in the brain and the subarachnoid space in the spinal cord, on the b0 images. Subsequently, we recommend estimating the noise on the images with the highest b-value (ideally above 1500 s/mm2) within the CSF mask. For ex vivo dMRI, the noise ROI is recommended to encompass the specimen itself, but noise estimation should be applied only on the b0 images. Since ex vivo dMRI is not affected by physiological artifacts, signal variations across the b0 images are considered noise.
Appendix Fig. E1
Appendix Fig. E1
Schematic illustration of how robust fitting down-weights outliers in the model fit. The scatter plot shows the logarithm of diffusion-weighted voxel intensities against the squared cosine of the angleψbetween the diffusion gradient direction (bvec) and the direction of the first eigenvector in a corpus callosum voxel (see blue crosshairs for location). Blue crosses in the scatter plot indicate data points not affected by artifacts (“No outliers”), while cyan crosses indicate data points affected by strong artifacts (“Outliers”). Outliers were generated by removing the center of the k-space of the original image to illustrate the effect of strong motion artifacts. Two example images corresponding to a nonartifactual (“No outlier,” top image) and an artifactual data point (“Outlier,” bottom image) are shown on the right. During the model fit, a linear curve is fitted to the logarithmic voxel intensities. The presence of outlier data points leads to a biased model fit (red line) and consequently biased tensor estimates when using ordinary least squares (OLS) model fitting. In contrast, robust fitting down-weights the influence of outliers, leading to a more accurate model fit (orange line) which is closer to the ground truth (green line) obtained by an OLS fit to the nonartifactual data points (blue crosses) only.
Appendix Fig. F1
Appendix Fig. F1
The impact of Rician bias correction (RBC) on maps of biophysical parameter estimates, derived from the NODDI-DTI and WMTI-Watson models, including Watson concentration parameter (κ) and axonal water fraction (AWF), in an in vivo brain and spinal cord dataset (refer toTable 4for details on the datasets). Being derived from white matter biophysical models, the parameter maps were masked for the white matter in the brain dataset. For the spinal cord, we refrained from masking due to the difficulty of obtaining an accurate white matter mask. These maps were computed both without (left column) and with (middle column) RBC; their voxel-wise difference, referred to as the Rician bias, is shown in the right column. RBC slightly decreased the mean of the kurtosis tensor in both the brain and spinal cord, which resulted in an increase inκ. The estimation of AWF using the NODDI-DTI model was not feasible in the spinal cord, as the mean diffusivity (MD) values derived from DTI fell below the range where the NODDI-DTI model provides a valid representation (refer to Equation (4) inEdwards et al., 2017). This discrepancy could be attributed to either the underestimation of MD due to kurtosis bias (Supplementary Fig. S3) or the invalidity of fixed compartmental diffusivities in the NODDI-DTI model.
Appendix Fig. G1
Appendix Fig. G1
Qualitative illustration of the effect of denoising on maps derived from diffusion kurtosis imaging (DKI). Shown are maps of axial diffusivity (AD), radial diffusivity (RD), mean kurtosis tensor (MW), axial kurtosis tensor (AW), and radial kurtosis tensor (RW). The maps were obtained by fitting the kurtosis model to simulated noisy dMRI data (signal + noise) with a signal-to-noise ratio (SNR) of 5, both before (no denoising) and after employing different denoising methods (msPOAS, LPCA, MP-PCA). The DKI metric maps obtained from the simulated noise-free dMRI data (signal only) are also shown for comparison (ground truth). The white matter mask used for calculating the normalized root-mean-square error (NRMSE) between the obtained DKI metrics and the ground truth is overlaid as a red segmentation line on the ground truth maps.
Appendix Fig. G2
Appendix Fig. G2
Quantitative illustration of the effect of denoising on maps derived from diffusion kurtosis imaging (DKI) (one noise realization). The plots show the normalized root-mean-square error (NRMSE) between (i) DKI metrics obtained from simulated noisy dMRI data (signal + noise) with varying signal-to-noise ratios (SNR), both before (no denoising) and after employing different denoising methods (msPOAS, LPCA, MP-PCA), and (ii) DKI metrics obtained from noise-free dMRI data (signal only). NRMSE was computed across white matter voxels (see Appendix Fig. G1 for the white matter mask) for the following DKI metrics: axial diffusivity (AD), radial diffusivity (RD), mean kurtosis tensor (MW), axial kurtosis tensor (AW), and radial kurtosis tensor (RW). Denoising methods reduced NRMSE from the ground truth compared with the “no denoising” scenario only in the low-SNR domain, although not consistently for all DKI metrics. At high SNRs (above 30–40), denoising increased NRMSE for all DKI metrics, except for the MP-PCA method, which yielded results comparable with the “no denoising” scenario.
Appendix Fig. G3
Appendix Fig. G3
Quantitative illustration of the effect of denoising on maps derived from diffusion kurtosis imaging (DKI). The plots show the relative difference in DKI metrics obtained from simulated noisy dMRI data (signal + noise) with varying signal-to-noise ratios (SNR) after employing different denoising methods (msPOAS, LPCA, MP-PCA) to those obtained without denoising (one noise realization). The relative difference was computed across white matter voxels (see Appendix Fig. G1 for the white matter mask) for the following DKI metrics: axial diffusivity (AD), radial diffusivity (RD), mean kurtosis tensor (MW), axial kurtosis tensor (AW), and radial kurtosis tensor (RW). Denoising introduced substantial improvements in the investigated DKI metrics only in the low-SNR domain, although not consistently across all DKI metrics. When using msPOAS and LPCA, the relative differences were greater compared with using MP-PCA, with msPOAS introducing the highest bias. At high SNRs (above 30–40), the relative difference to the “no denoising” scenario was negligible for MP-PCA.

References

    1. Ades-Aron , B. , Veraart , J. , Kochunov , P. , McGuire , S. , Sherman , P. , Kellner , E. , Novikov , D. S. , & Fieremans , E. ( 2018. ). Evaluation of the accuracy and precision of the diffusion parameter EStImation with Gibbs and NoisE removal pipeline . NeuroImage , 183 , 532 – 543 . 10.1016/j.neuroimage.2018.07.066 - DOI - PMC - PubMed
    1. Aja-Fernández , S. , Vegas-Sánchez-Ferrero , G. , & Tristán-Vega , A. ( 2014. ). Noise estimation in parallel MRI: GRAPPA and SENSE . Magnetic Resonance Imaging , 32 ( 3 ), 281 – 290 . 10.1016/j.mri.2013.12.001 - DOI - PubMed
    1. Alexander , D. C. , Dyrby , T. B. , Nilsson , M. , & Zhang , H. ( 2019. ). Imaging brain microstructure with diffusion MRI: Practicality and applications . NMR in Biomedicine , 32 ( 4 ), e3841 . 10.1002/nbm.3841 - DOI - PubMed
    1. Andersson , J. L. R. ( 2008. ). Maximum a posteriori estimation of diffusion tensor parameters using a Rician noise model: Why, how and but . NeuroImage , 42 ( 4 ), 1340 – 1356 . 10.1016/j.neuroimage.2008.05.053 - DOI - PubMed
    1. Andersson , J. L. R. , & Sotiropoulos , S. N. ( 2016. ). An integrated approach to correction for off-resonance effects and subject movement in diffusion MR imaging . NeuroImage , 125 , 1063 – 1078 . 10.1016/j.neuroimage.2015.10.019 - DOI - PMC - PubMed

LinkOut - more resources