. 2025 Jan 2:3:imag_a_00406.
doi: 10.1162/imag_a_00406. eCollection 2025.

Awake rodent fMRI: Gradient-echo echo planar imaging versus compressed-sensing fast low-angle shot

Affiliations

Awake rodent fMRI: Gradient-echo echo planar imaging versus compressed-sensing fast low-angle shot

Christopher Cover et al. Imaging Neurosci (Camb). .

Abstract

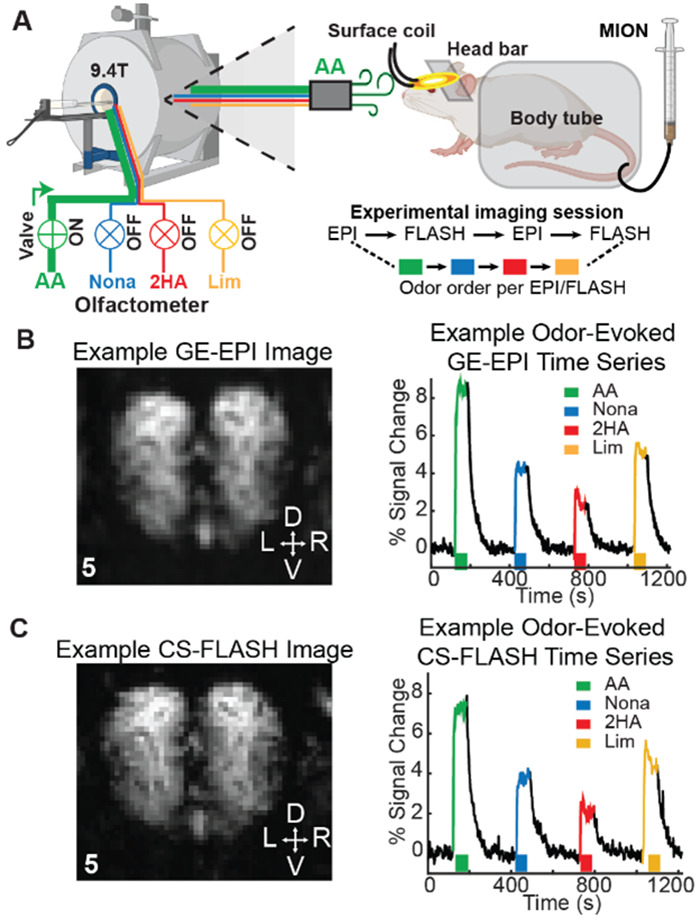
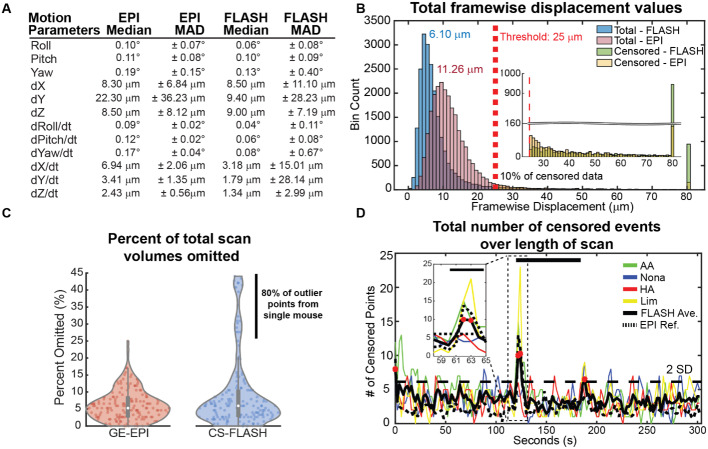
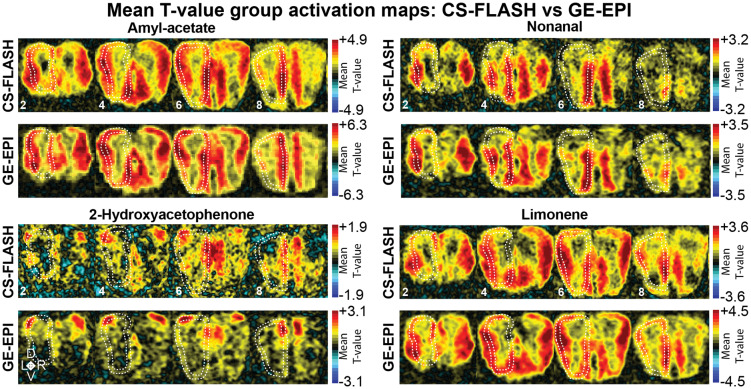
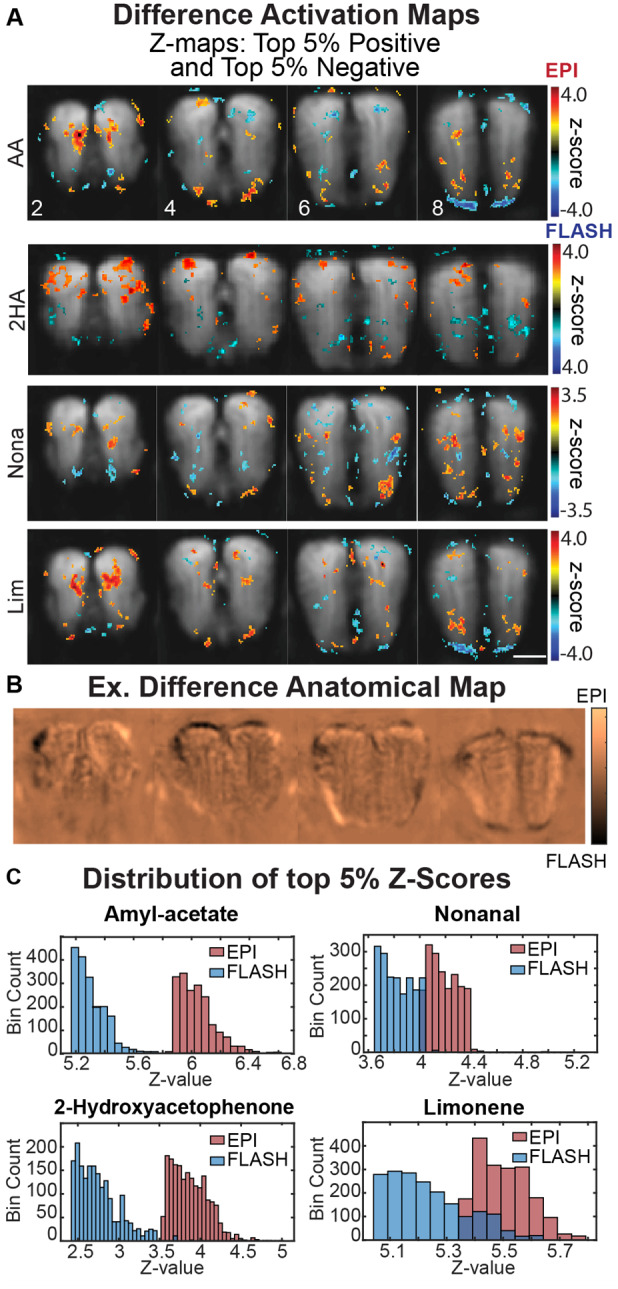
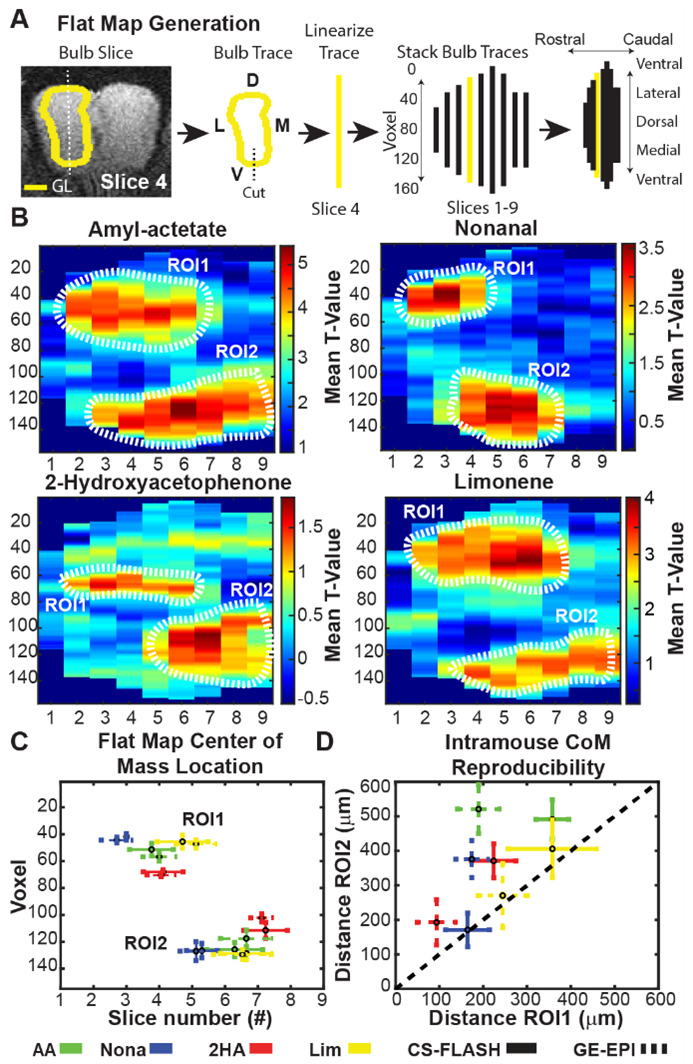
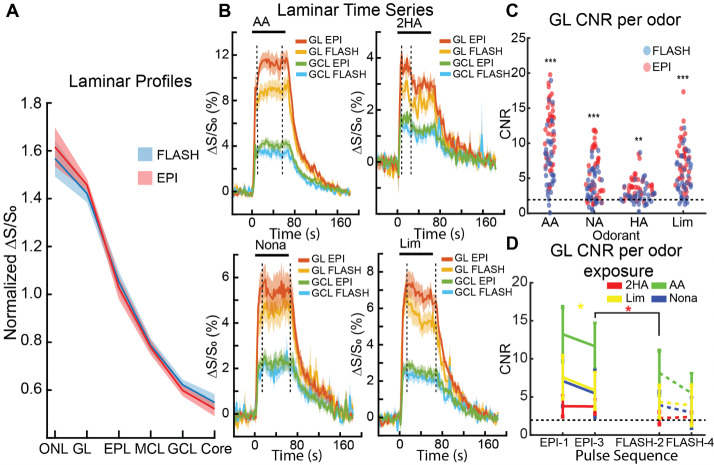
Awake rodent functional magnetic resonance imaging (fMRI) is increasingly becoming a reliable neuroimaging technique to study neuronal activity at both the whole-brain and high-resolution laminar scales. Prior studies have focused on developing acclimation protocols, experimental paradigms, and hardware to optimize outcomes. However, little effort has been made to address the impact of pulse sequence selection on detecting brain activation in awake fMRI experiments. In the current study, we compare gradient-echo echo planar imaging (GE-EPI) and compressed-sensing fast low-angle shot (CS-FLASH) sequences with cerebral blood volume-weighted (CBVw) contrast enhancement to investigate their sensitivity to hemodynamic activity in the olfactory bulb of awake rodents. Compared with GE-EPI, CS-FLASH had comparable motion parameters but was more sensitive to large motions, often resulting in corruption of the image quality. The use of framewise displacement as a motion censoring technique may over censor the data, requiring alternative approaches, such as spatial correlation censoring. CS-FLASH images were qualitatively sharper than GE-EPI; however, the contrast-to-noise ratio for odor activation was consistently greater for GE-EPI than for CS-FLASH that cannot be explained by olfactory adaptation alone. The activation maps of CS-FLASH to four different odors showed spatially unique patterns consistent with GE-EPI, but with lower z-scores or detection sensitivity. Activation maps were consistent with previously established histological findings. Additionally, odor-evoked laminar activation was greatest in the superficial layers that decreased with laminar depth, consistent with prior findings. We conclude that CS-FLASH produces sharper images with equivalent spatial activation maps to GE-EPI, albeit with lower statistical strength and contrast-to-noise ratio (CNR), and without being prohibited by motion-related image distortion.

Keywords: CBVw fMRI; awake rodent fMRI; functional pulse sequence comparison; high-resolution fMRI; olfactory bulb.


Conflict of interest statement

The authors declare that they have no competing or conflicts of interest.

Figures

Fig. 1.
Fig. 1.
Overview of awake multi-pulse CBVw odor experiments. (A) Four odorants were delivered to mice (n = 7) in a 9.4-T Bruker scanner using a modified air-dilution olfactometer. Odorants were amyl acetate (AA; 50 mL odorized air + 950 mL blank air or 5% air dilution), nonanal (Nona; 15% air dilution), 2-hydroxyacetophenone (2HA; 10% air dilution), and limonene (Lim; 20% air dilution). The four odors were repeatedly presented in a sequential manner (AA → Nona → 2HA → Lim) in a box-car design (2-min blank air, 64-s odor delivery, 2-min blank air). Scan sessions consisted of alternating blocks of four odors with GE-EPI followed by four odors with CS-FLASH within the same scan day (GE-EPI → CS-FLASH → GE-EPI → CS-FLASH). Subpanel created at BioRender.com. Green arrow indicates airflow and direction. Colors and colored boxed indicates odor type; green—AA, blue—NA, red—2HA, and yellow—Lim. Example contrast-enhanced GE-EPI (B) and CS-FLASH (C) mean baseline images and time series within the olfactory bulb acquired during awake CBVw fMRI scans. The slice number is indicated in the lower left corner. D—dorsal, V—ventral, L—left, R—right.
Fig. 2.
Fig. 2.
Comparative motion characteristics of awake mice during olfactory fMRI scans, GE-EPI versus CS-FLASH. (A) AFNI’s 3dVolReg motion parameter estimates of 5-min runs broken down into their median and median absolute deviation (MAD) rigid body components and first derivative components. (B) Histogram of framewise displacement (FD) values for all GE-EPI (i.e., EPI) and CS-FLASH (i.e., FLASH) volumes. Median values following censoring are 11.26 µm and 6.10 µm for GE-EPI and CS-FLASH, respectively. (C) Total percent of TR’s censored per GE-EPI or CS-FLASH scan. For GE-EPI, 5.26% ± 4.4% (8 ± 7 TR’s out of 152) was censored. For CS-FLASH, 4.61 ± 9.51% (7 ± 14 TR’s out of 152) was censored. (D) Total number of censored events in time for each ~5-min run. Red dots indicate time points 2 SD above mean and correspond to the scan initiation (1st TR), odor onset, and odor offset. The maximum possible number of censored points per time point is 38.
Fig. 3.
Fig. 3.
Mean t-value group activation maps: CS-FLASH versus GE-EPI. T-maps generated from 3dREMLfit were normalized and averaged (n = 19 sessions, 7 mice, 2–3 sessions/mouse) for each odorant and are displayed without a threshold applied. Rostral OB slices are indicated with a lower slice number (see Amyl acetate panels) and progress caudally. The input layer, GL, is outlined with dotted white lines. Mean t-maps are for contrast purposes only and are not intended for statistical inference.
Fig. 4.
Fig. 4.
Group difference activation maps and comparison between CS-FLASH and GE-EPI. (A) Difference maps (GE-EPI–CS-FLASH) were generated to highlight differences in activation patterns. Top and bottom 5% of the difference maps are presented to show GE-EPI (warm colors) versus CS-FLASH (cold colors) predominance. (B) Difference baseline fMRI maps (min-max normalized, GE-EPI–CS-FLASH) were generated to highlight anatomical differences with increased signal for GE-EPI (brighter colors) versus CS-FLASH (darker colors). (C) Histogram distribution of top 5% of voxel z-scores per odor. AA—amyl acetate, Nona—nonanal, 2HA—2-hydroxyacetophenone, Lim—limonene.
Fig. 5.
Fig. 5.
Odorant flat maps of the olfactory bulb with CS-FLASH versus GE-EPI. (A) Outline of flat map generation from the glomerular layer (GL, yellow line) of the olfactory bulb and orientation key of flat maps (far right). (B) Flat map representation of each odor. Vertical scale represents in-plane voxel number (50 µm/voxel), while horizontal scale represents slice number (300 µm/slice). Individual session t-maps (n = 17) were flattened and maps from both hemispheres were averaged (n = 34). Two regions of interests (ROI) were identified and outlined (dotted white line) in the dorsolateral and ventromedial bulb regions, ROI1 and ROI2, respectively. (C) Weighted center-of-mass (CoM) calculations (mean ± SD; n = 34 hemi-bulbs from 17 sessions) were performed on the top 5% of clustered, active voxels for all odorants (AA—green; Nona—blue; 2HA—red; Lim—yellow) for both pulse sequences (solid line—CS-FLASH; dashed line—GE-EPI). (D) Euclidean distance was used to capture intra-mouse variability between CoM across scan days (mean ± SE; n = 7 mice) to characterize reproducibility of GL activation patterns.
Fig. 6.
Fig. 6.
Laminar CBVw fMRI responses (A) Relative normalized fMRI response (ΔS/S0) to odor-evoked activation of the OB to show layer-specific CBVw responses (n = 19, no threshold applied). The value 1 represents the average laminar response of each odor. ONL—olfactory nerve layer, GL—glomerular layer, EPL—external plexiform layer, MCL—mitral cell layer, GCL—granule cell layer. (B) GE-EPI versus CS-FLASH time series between the superficial GL and deeper GCL. Time series were normalized to the baseline (full baseline not shown, -120–0 s and 160–184 s) for each session and averaged across sessions. Horizontal bars represent odor exposure (0–64 s). All graphs are mean ± SEM. (C) GL contrast-to-noise ratio (CNR) for GE-EPI (red dots) and CS-FLASH (blue dots) for each odor (n = 38 per odor & per pulse sequence). Dotted black line represents a t-statistic of 1.96 (i.e., p < 0.05). Wilcoxon Rank Sum: **p < 0.01, ***p < 0.001. (D) GL CNR comparison per pulse sequence. Note, pulse sequence order was GE-EPI (1) → CS-FLASH (2) → GE-EPI (3) → CS-FLASH (4). One-way repeated measures ANOVA with Šidák’s post hoc test for multiple comparisons: *p < 0.05. Asterisk color indicates the odor that was significant.

Similar articles

References

    1. Almeida, J., Severo, F., & Nunes, D. (2022). Impact of the sound of magnetic resonance imaging pulse sequences in awake mice. J Appl Anim Welf Sci, 25(1), 75–88. 10.1080/10888705.2021.1941023 - DOI - PubMed
    1. Becerra, L., Pendse, G., Chang, P. C., Bishop, J., & Borsook, D. (2011). Robust reproducible resting state networks in the awake rodent brain. PLoS One, 6(10), e25701. 10.1371/journal.pone.0025701 - DOI - PMC - PubMed
    1. Bergmann, E., Gofman, X., Kavushansky, A., & Kahn, I. (2020). Individual variability in functional connectivity architecture of the mouse brain. Commun Biol, 3(1), 738. 10.1038/s42003-020-01472-5 - DOI - PMC - PubMed
    1. Chen, X., Tong, C., Han, Z., Zhang, K., Bo, B., Feng, Y., & Liang, Z. (2020). Sensory evoked fMRI paradigms in awake mice. Neuroimage, 204, 116242. 10.1016/j.neuroimage.2019.116242 - DOI - PubMed
    1. Cover, C. G., Kesner, A. J., Ukani, S., Stein, E. A., Ikemoto, S., Yang, Y., & Lu, H. (2021). Whole brain dynamics during optogenetic self-stimulation of the medial prefrontal cortex in mice. Commun Biol, 4(1), 66. 10.1038/s42003-020-01612-x - DOI - PMC - PubMed

LinkOut - more resources