. 2025 May 9:3:imag_a_00574.
doi: 10.1162/imag_a_00574. eCollection 2025.

Auditory illusory models as proxies to investigate bottom-up and top-down neural networks of phantom perception

Affiliations

Auditory illusory models as proxies to investigate bottom-up and top-down neural networks of phantom perception

Feifan Chen et al. Imaging Neurosci (Camb). .

Abstract

Auditory phantom perception, exemplified by tinnitus, is characterized by a perceptual experience without external stimuli. This study utilized two auditory illusions, the Zwicker Tone (ZT) and Conditioned Hallucinations (CH), as proxies to investigate the neural correlates of bottom-up and top-down mechanisms underlying phantom auditory perception. Using a within-subject design, ZT, driven by temporary sensory deficits, and CH, influenced by multisensory expectations, were examined in a sample of healthy participants. Electrophysiological measures revealed distinct time-frequency patterns, with increased theta activity in central regions during ZT perception but decreased parietal theta power during CH perception. Key regions in the ZT network, including the medial prefrontal cortex, lateral orbitofrontal cortex, and ventral posterior cingulate cortex, suggested the involvement of the default mode network and predictive processing in compensating for sensory deficits. In contrast, CH perception implicated the parahippocampus, entorhinal cortex, and inferior temporal gyrus in modulating multisensory associations and cognitive expectations. Taken together, this study revealed the neural mechanism of two auditory illusions, which enhances understanding of tinnitus mechanism. The results also highlight potential neural targets for neuromodulation interventions addressing both sensory and cognitive components of chronic phantom perception.

Keywords: auditory illusions; connectivity; phantom perception; theta oscillation; tinnitus.


Conflict of interest statement

The authors report no potential conflicts of interest.

Figures

Fig. 1.
Fig. 1.
Trial structures of two illusion paradigms and demographical plot. (A) Zwicker Tone (ZT) paradigm. Noise stimuli in the ZT paradigm consisted of 4k notched noise, 1k notched noise, and white noise. The sequence of stimuli was pseudo-randomized by presenting the three different stimuli in a random order. During the experiment, participants were asked to direct their gaze at the fixation cross followed by a noise stimulus for 3 s. Participants were then required to rate the clearness of a ringing sound they may perceive during the silent time, via a visual analogue scale (VAS). (B) Trial number distributions for the Conditioned Hallucination (CH) paradigm. Four stimulation conditions were estimated individually based on the psychometric curves of the tone detection from the QUEST test and the proportion of four conditions was structured in a non-linear manner. Threshold tones were more likely early and absent tones were more likely later, with systematically varied steps over 12 blocks of 60 conditioning trials. (C) Trials in the CH paradigm consisted of a visual checkerboard and a simultaneous 1k Hz tone with a specific stimulation condition. During the experiment, participants were required to indicate whether they heard an auditory tone when a visual checkerboard was present by clicking the mouse. Participants were then asked to rate their confidence in this decision via a VAS from “Not sure” to “Very certain.” (D) The number of high and low perceivers for ZT and CH conditions. (E) Age comparison between high and lower perceivers in ZT and CH sessions. Sex distribution between high and low perceivers in ZT (F) and CH session (G). Hearing thresholds for high and low perceivers in ZT (H) and CH session (I). (J) Detection thresholds at 75% tone threshold between the CH high and low perceiver groups. Data are present with mean with the error bar of 95% CI.*p<.05.
Fig. 2.
Fig. 2.
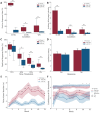
Behavioural data for the ZT and CH session. (A) Group difference of the positive response rate between the ZT high and low perceiver groups in the 4k-notch noise (NN), 1k-NN, and white noise (WN) conditions. (B) Group difference of the mean ZT illusion intensity between the two ZT groups in the 4k-NN, 1k-NN, and WN conditions. (C) Difference of the mean positive response rate between the CH high and low perceiver groups in four tone threshold conditions. (D) Group difference of the mean confidence rating in positive and negative responses between two CH groups. (E) Group difference of the false alarm number in the 0% threshold condition over the blocks between two CH groups. (F) Group difference of the confidence rating in positive and negative responses in four tone threshold conditions over the blocks between two CH groups. Data were present with mean with the error bar of 95% CI.*p<.05 **p<.01 *** p<.001.
Fig. 3.
Fig. 3.
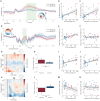
Neural representations for the two auditory illusions. ERP plot for the ZT (A) and CH illusions (D). The ERPs are grand averaged in each condition across the channels in black. Shaded regions represent the 95% CI of ERP for the illusion perception (i.e., ZT and FA) (in red) and non-illusion perception (i.e., NR and CR) (in blue) conditions. Green regions represent the time range that showed significant differences between the two groups. Topographical plot for the group difference. The mean amplitude was averaged across the time points that showed a significant difference between the two groups (regions in green). The channels of interest that showed significant differences are marked in black. Scatter plots for the correlation between the 4k-NN evoked ERP and ZT percentage (B), and ZT intensity rating (C). Scatter plots for the correlation between the absent tone evoked ERP and CH percentage (E), and CH confidence rating (F). Time–frequency representation for the group difference in the ZT (G) and CH (K) conditions. Time–frequency data were extracted and averaged from the channels labelled in the topographical plot. The box in red demonstrates the time–frequency representation that showed a significant difference between the two perceiver groups in individual illusion conditions (p<.05, two-tailed). Group comparison of the averaged total power across the significant time–frequency cluster in the ZT (H) and CH (L) conditions. Data are present with mean with the error bar of 95% CI. Scatter plots for the correlation between the theta power and ZT percentage (I), and ZT intensity rating (J). Scatter plots for the correlation between the theta power and CH percentage (M), and CH confidence rating (N).**p<.01.
Fig. 4.
Fig. 4.
The results of source localization during the illusory perception. The left panel shows the absolute t-value of condition difference in the ZT session (A) and CH session (B) by the scout-based permutation test. Scouts were defined by the Desikan–Killiany Atlas. The mean activity of each scout was averaged across the time of interest from the ERP analysis. The regions that showed significant differences between the two trial conditions after correcting for multiple comparisons are shown (p<.05, two-tailed). The right panel demonstrates the t-value of the significant regions in the ZT session (C) and CH session (D). Boxes represent either significantly increased (in red) or decreased (in blue) activation in the illusion conditions than non-illusion conditions in individual sessions (p<.025, two-tailed).
Fig. 5.
Fig. 5.
The directed connectivity of two auditory illusion networks. GC connectivity for the ZT network, with (A) showing the raw differences between the ZT and NR conditions and (B) showing significant connections after FDR correction. GC connectivity differences for the CH network, with (C) showing the raw differences between FA and CR conditions and (D) showing significant connections after FDR correction. Colour scales indicate GC strength differences: red represents stronger connections for the illusion condition, while blue indicates weaker connections. Direct comparison of GC connectivity between ZT and CH conditions, with (E) showing raw differences and (F) showing significant differences after FDR correction. Red represents stronger connections for the ZT condition, while blue indicates stronger connections for the CH condition.

References

    1. Adamchic , I. , Hauptmann , C. , & Tass , P. A. ( 2012. ). Changes of oscillatory activity in pitch processing network and related tinnitus relief induced by acoustic CR neuromodulation . Frontiers in Systems Neuroscience , 6 , 18 . 10.3389/fnsys.2012.00018 - DOI - PMC - PubMed
    1. Aleman , A. , & Vercammen , A. ( 2013. ). The “bottom-up” and “top-down” components of the hallucinatory phenomenon . In Jardri R. , Cachia A. , Thomas P. , & Pins D. (Eds.), The neuroscience of hallucinations (pp. 107 – 121 ). Springer; . 10.1007/978-1-4614-4121-2_6 - DOI
    1. Aminoff , E. M. , Kveraga , K. , & Bar , M. ( 2013. ). The role of the parahippocampal cortex in cognition . Trends in Cognitive Sciences , 17 ( 8 ), 379 – 390 . 10.1016/j.tics.2013.06.009 - DOI - PMC - PubMed
    1. Asko , O. , Blenkmann , A. O. , Leske , S. L. , Foldal , M. D. , LLorens , A. , Funderud , I. , Meling , T. R. , Knight , R. T. , Endestad , T. , & Solbakk , A.-K. ( 2024. ). Altered hierarchical auditory predictive processing after lesions to the orbitofrontal cortex . eLife , 13 , e86386 . 10.7554/eLife.86386 - DOI - PMC - PubMed
    1. Baguley , D. , McFerran , D. , & Hall , D. ( 2013. ). Tinnitus . The Lancet , 382 ( 9904 ), 1600 – 1607 . 10.1016/S0140-6736(13)60142-7 - DOI - PubMed

LinkOut - more resources