

Reliability of structural brain change in cognitively healthy adult samples
- PMID: 40800869
- PMCID: PMC12319936
- DOI: 10.1162/imag_a_00547
Reliability of structural brain change in cognitively healthy adult samples
Abstract
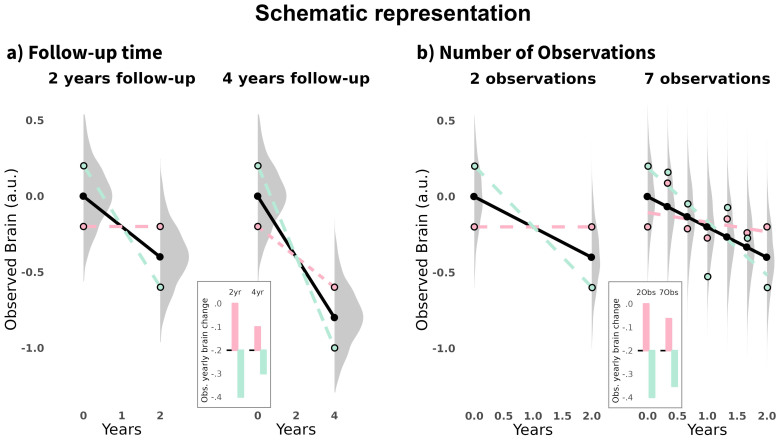
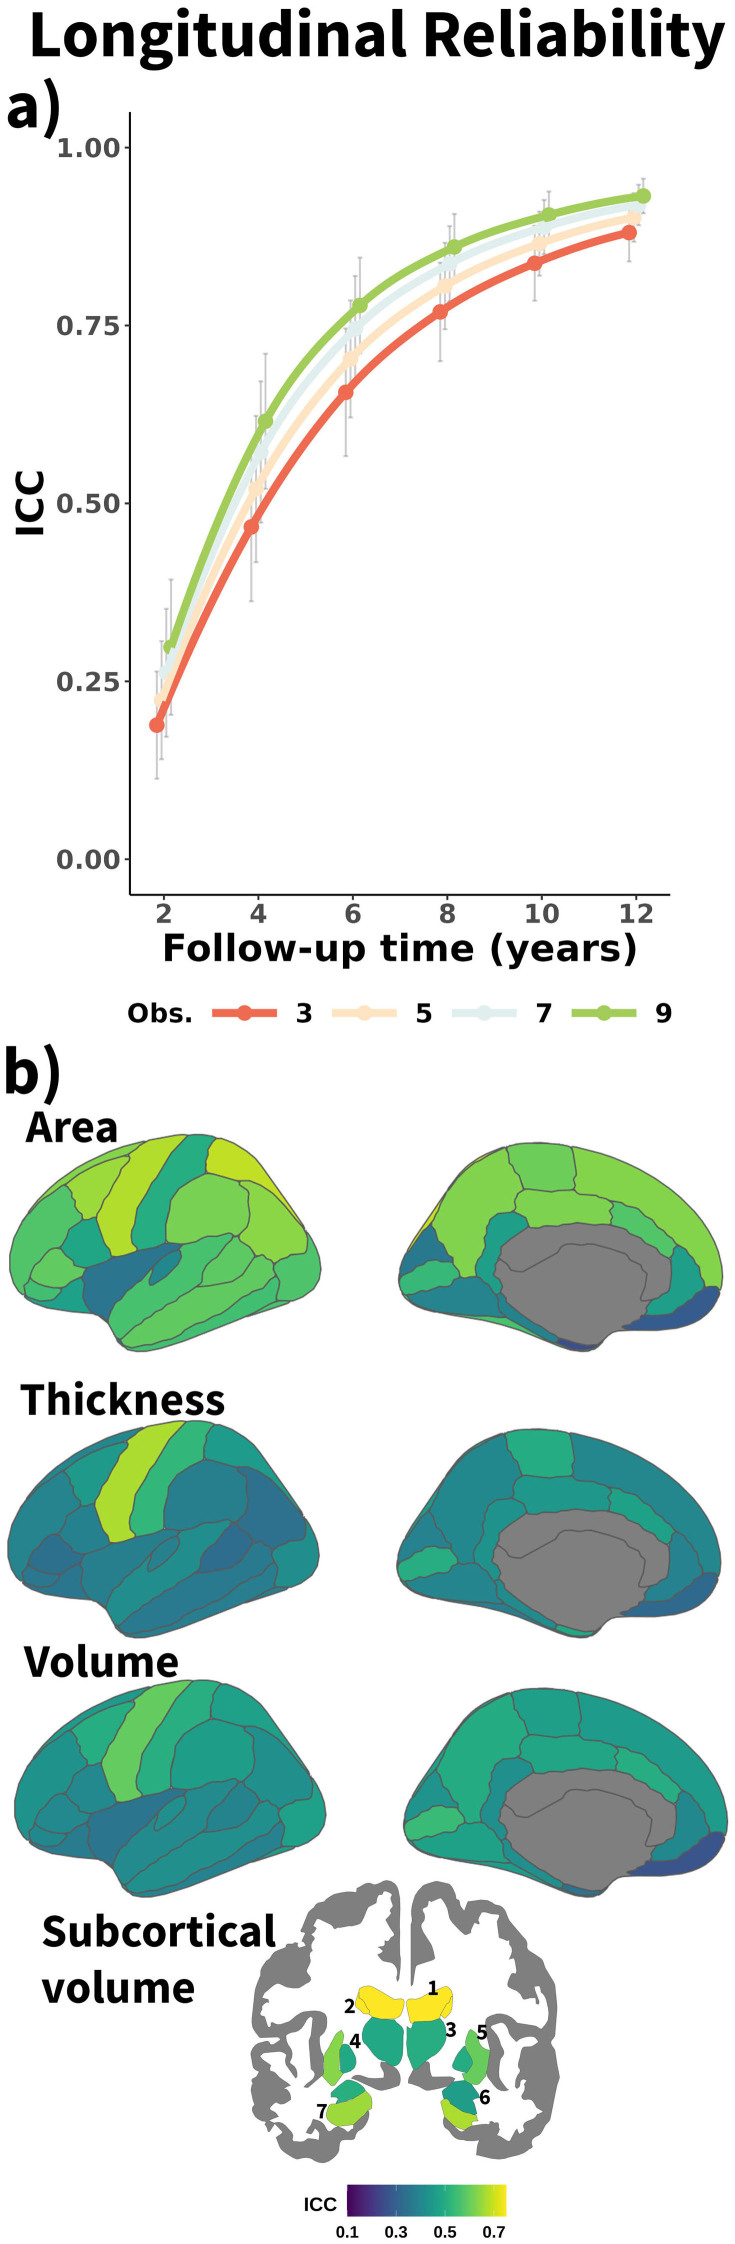
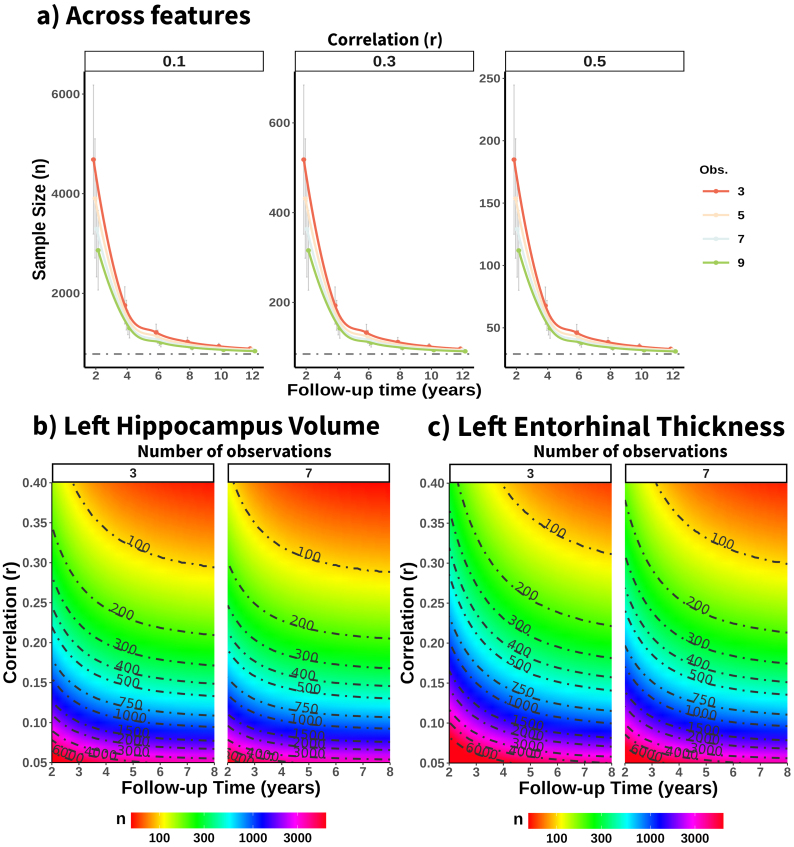
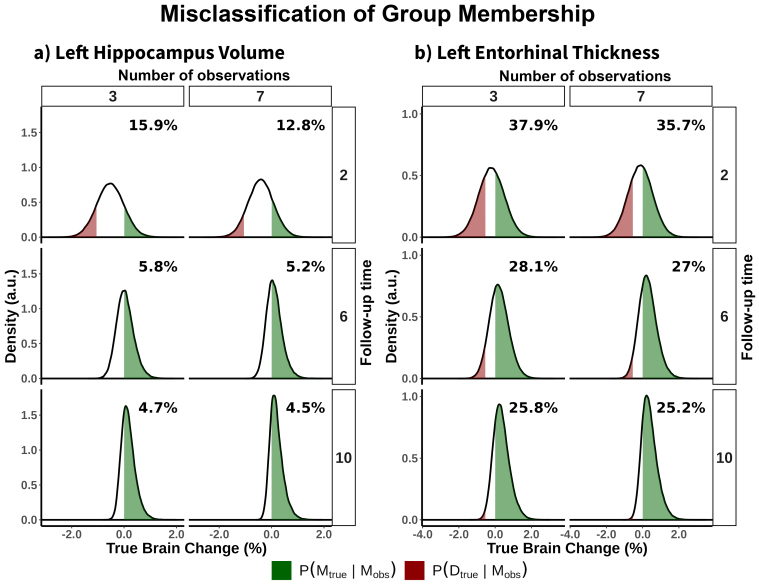
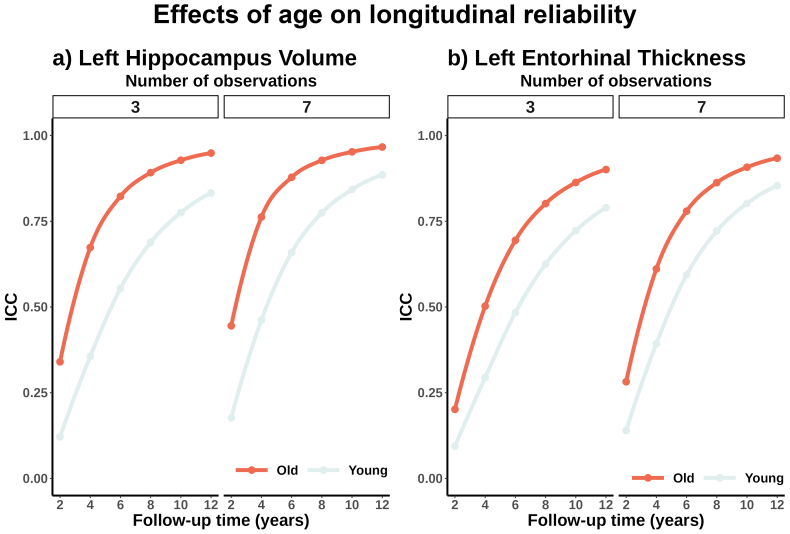
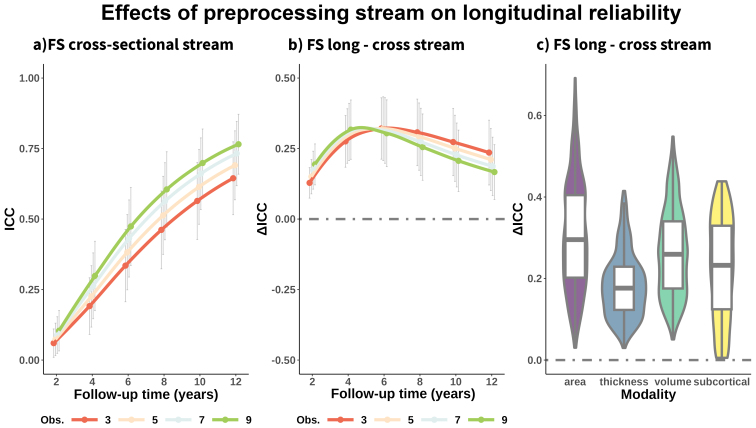
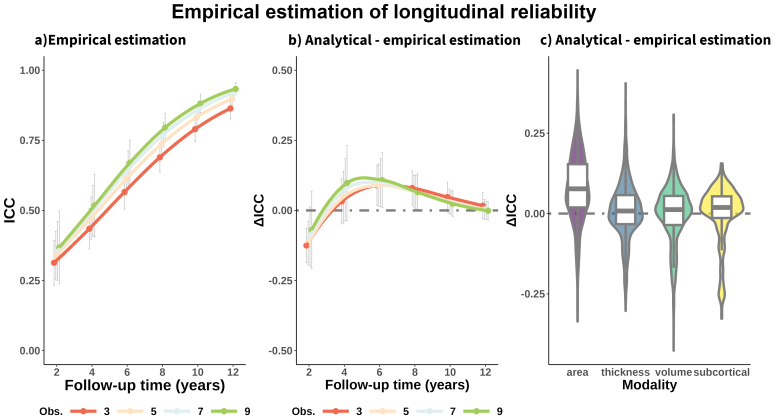
In neuroimaging research, tracking individuals over time is key to understanding the interplay between brain changes and genetic, environmental, or cognitive factors across the lifespan. Yet, the extent to which we can estimate the individual trajectories of brain change over time with precision remains uncertain. In this study, we estimated the reliability of structural brain change in cognitively healthy adults from multiple samples and assessed the influence of follow-up time and number of observations. Estimates of cross-sectional measurement error and brain change variance were obtained using the longitudinal FreeSurfer processing stream. Our findings showed, on average, modest longitudinal reliability with 2 years of follow-up. Increasing the follow-up time was associated with a substantial increase in longitudinal reliability, while the impact of increasing the number of observations was comparatively minor. On average, 2-year follow-up studies require ≈2.7 and ≈4.0 times more individuals than designs with follow-ups of 4 and 6 years to achieve comparable statistical power. Subcortical volume exhibited higher longitudinal reliability than cortical area, thickness, and volume. The reliability estimates were comparable with those estimated from empirical data. The reliability estimates were affected by both the cohort's age where younger adults had lower reliability of change and the preprocessing pipeline where the FreeSurfer's longitudinal stream was notably superior than the cross-sectional stream. Suboptimal reliability inflated sample size requirements and compromised the ability to distinguish individual trajectories of brain aging. This study underscores the importance of long-term follow-ups and the need to consider reliability in longitudinal neuroimaging research.
Keywords: aging; longitudinal; observations; reliability; structural MRI; study duration; validity.
© 2025 The Authors. Published under a Creative Commons Attribution 4.0 International (CC BY 4.0) license.
Conflict of interest statement
The authors declare no conflict of interest.
Figures

Similar articles
-
Reliability of structural brain change in cognitively healthy adult samples.bioRxiv [Preprint]. 2025 Feb 20:2024.06.03.592804. doi: 10.1101/2024.06.03.592804. bioRxiv. 2025. PMID: 40027710 Free PMC article. Preprint.
-
Falls prevention interventions for community-dwelling older adults: systematic review and meta-analysis of benefits, harms, and patient values and preferences.Syst Rev. 2024 Nov 26;13(1):289. doi: 10.1186/s13643-024-02681-3. Syst Rev. 2024. PMID: 39593159 Free PMC article.
-
Healthcare outcomes assessed with observational study designs compared with those assessed in randomized trials.Cochrane Database Syst Rev. 2014 Apr 29;2014(4):MR000034. doi: 10.1002/14651858.MR000034.pub2. Cochrane Database Syst Rev. 2014. Update in: Cochrane Database Syst Rev. 2024 Jan 4;1:MR000034. doi: 10.1002/14651858.MR000034.pub3. PMID: 24782322 Free PMC article. Updated.
-
Influence of atlas-choice on age and time effects in large-scale brain networks in the context of healthy aging.Imaging Neurosci (Camb). 2024 Apr 8;2:imag-2-00127. doi: 10.1162/imag_a_00127. eCollection 2024. Imaging Neurosci (Camb). 2024. PMID: 40800372 Free PMC article.
-
Sexual Harassment and Prevention Training.2024 Mar 29. In: StatPearls [Internet]. Treasure Island (FL): StatPearls Publishing; 2025 Jan–. 2024 Mar 29. In: StatPearls [Internet]. Treasure Island (FL): StatPearls Publishing; 2025 Jan–. PMID: 36508513 Free Books & Documents.
Cited by
-
Distinguishing Lifelong Individual Differences from Divergent Aging Trajectories of Adult Brain Volumes.bioRxiv [Preprint]. 2025 May 28:2025.05.26.655710. doi: 10.1101/2025.05.26.655710. bioRxiv. 2025. PMID: 40501598 Free PMC article. Preprint.
-
Reevaluating the Role of Education in Cognitive Decline and Brain Aging: Insights from Large-Scale Longitudinal Cohorts across 33 Countries.Res Sq [Preprint]. 2025 Feb 10:rs.3.rs-5938408. doi: 10.21203/rs.3.rs-5938408/v1. Res Sq. 2025. Update in: Nat Med. 2025 Jul 28. doi: 10.1038/s41591-025-03828-y. PMID: 39989967 Free PMC article. Updated. Preprint.
-
Precision Estimates of Longitudinal Brain Aging Capture Unexpected Individual Differences in One Year: Summary: A novel brain imaging method boosts precision to reveal variable brain aging trajectories.medRxiv [Preprint]. 2025 May 12:2025.02.21.25322553. doi: 10.1101/2025.02.21.25322553. medRxiv. 2025. PMID: 40061349 Free PMC article. Preprint.
-
Reevaluating the Role of Education in Cognitive Decline and Brain Aging: Insights from Large-Scale Longitudinal Cohorts across 33 Countries.medRxiv [Preprint]. 2025 Jan 29:2025.01.29.25321305. doi: 10.1101/2025.01.29.25321305. medRxiv. 2025. Update in: Nat Med. 2025 Jul 28. doi: 10.1038/s41591-025-03828-y. PMID: 39974127 Free PMC article. Updated. Preprint.
-
Vulnerability to memory decline in aging - a mega-analysis of structural brain change.bioRxiv [Preprint]. 2025 Mar 28:2025.03.27.642988. doi: 10.1101/2025.03.27.642988. bioRxiv. 2025. PMID: 40196574 Free PMC article. Preprint.
References
-
- Allen , M. J. , & Yen , W. M. ( 2001. ). Introduction to measurement theory . Waveland Press; . https://www.waveland.com/browse.php?t=367
-
- Appelbaum , M. , Cooper , H. , Kline , R. B. , Mayo-Wilson , E. , Nezu , A. M. , & Rao , S. M. ( 2018. ). Journal article reporting standards for quantitative research in psychology: The APA Publications and Communications Board task force report . American Psychologist , 73 , 3 – 25 . 10.1037/amp0000191 - DOI - PubMed
-
- Bates , D. , Mächler , M. , Bolker , B. , & Walker , S. ( 2015. ). Fitting linear mixed-effects models using lme4 . Journal of Statistical Software , 67 , 1 – 48 . 10.18637/jss.v067.i01 - DOI