. 2025 Jul 2:3:IMAG.a.64.
doi: 10.1162/IMAG.a.64. eCollection 2025.

The fluctuations of alpha power: Bimodalities, connectivity, and neural mass models

Affiliations

The fluctuations of alpha power: Bimodalities, connectivity, and neural mass models

Jesús Cabrera-Álvarez et al. Imaging Neurosci (Camb). .

Abstract

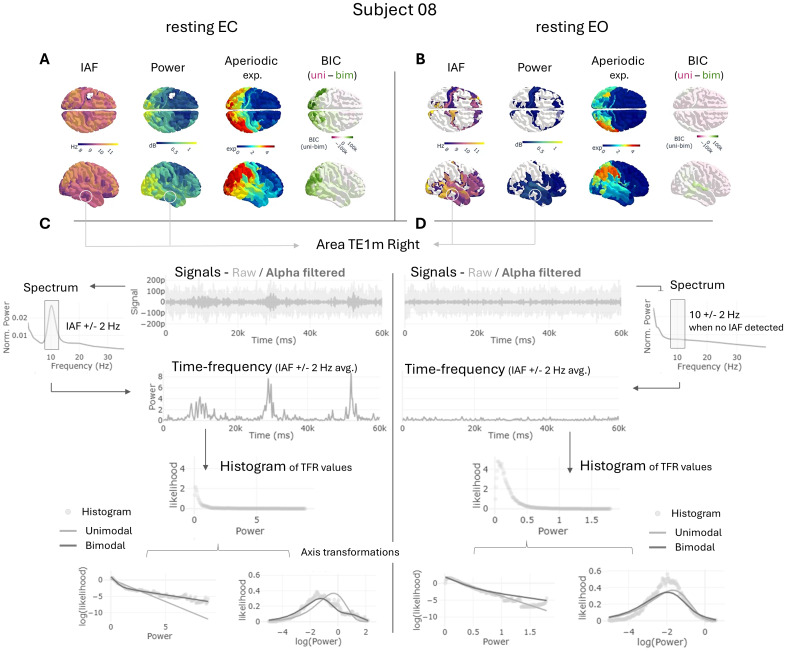
The alpha rhythm is a hallmark of electrophysiological resting-state brain activity, that serves as a biomarker in health and disease. Alpha power is far from uniform over time, exhibiting dynamic fluctuations. The likelihood of those power values can be captured by a decreasing exponential function, which in certain cases becomes bimodal. While alpha rhythm is usually evaluated through the averaged power spectra across entire recordings, its dynamic fluctuations have received less attention. In this study, we investigate the dynamic nature of alpha power, its relationship with functional connectivity (FC) within the default mode network (DMN), and the ability of the Jansen-Rit (JR) neural mass model to replicate these fluctuations. Using MRI and MEG data from 42 participants in resting state with eyes-closed and eyes-open, we evaluated the shape of the exponential distributions for alpha power fluctuations, and their relationship with other spectral variables as frequency, power, and the aperiodic exponent. Additionally, we assessed the temporal relationship between alpha power and FC using phase-based (ciPLV) and amplitude-based (cAEC) metrics. Finally, we employed diffusion-weighted MRI to construct brain network models incorporating JR neural masses to reproduce and characterize alpha fluctuations. Our results indicate that alpha power predominantly follows unimodal exponential distributions, with bimodalities associated to high-power in posterior regions. FC analyses revealed that ciPLV and cAEC were directly correlated with alpha power within the DMN in alpha and beta bands, whereas only theta-band ciPLV showed an inverse relationship with alpha power. JR model simulations suggested that post- supercritical fixed points better replicated alpha power fluctuations compared to limit cycle parameterizations and pre-saddle node fixed points. These results deepen our understanding of the dynamics of alpha rhythm and its intricate relationship with FC patterns, offering novel insights to refine biologically plausible brain simulations and advance computational models of neural dynamics.

Keywords: DMN; Jansen-Rit; MEG; alpha rhythm; computational model; resting state.


Conflict of interest statement

The authors declare no competing financial or non-financial interests related to this work.

Figures

Fig. 1.
Fig. 1.
Pipeline of analysis for a sample subject (sub-08) in both rEC (A, C) and rEO (B, D) conditions. (A, B) Results of the spectral modeling including IAF, power, and the exponent of the aperiodic component. White regions in IAF and power represent non-detected alpha peaks. In these cases, we analyzed the 10 +/- 2 Hz frequency band. BIC column shows the difference in goodness of fit between the unimodal and bimodal exponential functions (positive values in green favor bimodality). (C, D) Alpha fluctuations analysis for one sample region (TEm1 R) both in rEC and rEO. First row, showing the signals (raw and filtered in alpha band); second, the spectra derived from the raw signal that is used to detect the IAF; third, TFR analysis in the IAF +/- 2 Hz frequency band averaged through frequencies to obtain a single array of alpha power in time; fourth, histogram with 200 equally sized bins using the data array of alpha power (each dot represents a bin); fifth, axis transformations of original exponential distributions helps to evaluate visually the presence of bimodalities. The fit of the unimodal and bimodal functions are shown in light and dark gray lines, respectively. Shared y-axis for rEC and rEO.
Fig. 2.
Fig. 2.
Regional characterization of the exponential modeling and spectral variables in rEC/rEO. Values were averaged through subjects. (A) Topological descriptions including the BIC difference between the unimodal and bimodal exponential fits (positive values in green favoring bimodality), the KSD value of the best fitted model per region (lower values in dark blue indicate better fit), and three spectral variables including IAF, alpha power, and aperiodic exponent. (B) Relationship between the exponential modeling variables and spectral ones. Note again that positive values in the BIC(uni-bim) favor bimodality and that lower KSD values imply better model fit.
Fig. 3.
Fig. 3.
(A, B) Correlations between alpha power and FC in the DMN computed per frequency band and averaging across connections (each datapoint represent one subject), differentiating by FC metric (ciPLV/cAEC in panels A/B, respectively) and condition (rEC in blue and rEO in orange). Both panels share y-axis. (C, D) Correlations between alpha power and FC per band averaging out subjects to show each connection in the DMN differentiating by FC metric (ciPLV/cAEC in panels C/D, respectively). In color, the direction of the correlation with positive in red, negative in blue. (*) corresponds to statistical significance after correction for multiple comparisons, with p-corr < 0.01.
Fig. 4.
Fig. 4.
Parameter space explorations for a single node varying the mean intrinsic input (p) and standard deviation (sigma). In columns, 1) the bifurcation as the signal’s max-min voltage, 2) the alpha frequency peak, 3) the peak’s power and 4) aperiodic exponent as modeled with fooof toolbox, 5) the log(likelihood) of the unimodal exponential fit, and 6) the BIC difference between the unimodal and bimodal exponentials: the higher favors unimodal distributions. Blank values in columns 2) and 3) correspond to undetected alpha peaks by fooof modeling.
Fig. 5.
Fig. 5.
Three samples of the single-node simulations with p = [0.09, 0.22, 0.44] and sigma = 0.01. First row shows the bifurcation and two parameter spaces as reference for the picked simulations (in colored vertical lines and open circles). The following rows show: 1) the power spectrum calculated from the simulated signals (thick line), the modeled spectra (thin line), and the modeled aperiodic component (dashed line); 2) the exponential function in two different coordinate spaces (i.e., Linear-Log and Log-Linear) with the scatter representing the histogram of the simulated TFR(α) and the lines representing both the unimodal (light color) and the bimodal exponential models (dark color); 3) the raw signal (light color) and the TFR(α) values (dark color) in two different timeframes: 0–20 seconds for a broader overview, and 20–23 seconds for finer detail.
Fig. 6.
Fig. 6.
Parameter space explorations for network simulations with a fixed sigma = 0.001 and varying p and g. In columns, 1) the bifurcation as the signal’s max-min voltage, 2) the alpha frequency peak, 3) the peak’s power and 4) aperiodic exponent as modeled with fooof toolbox, 5) the BIC of the unimodal exponential fit, and 6) the BIC difference between the unimodal and bimodal exponentials: the higher favors unimodal distributions. Not shown values in columns 2 and 3 correspond to undetected alpha peaks by fooof modeling. Each row corresponds to analysis from simulated signals in different brain regions. Abbreviations: Orbito-Frontal Cortex (OFC), Medial Temporal Cortex (MT), Superior Parietal Cortex (sPC), Primary Visual Cortex (V1).

References

    1. Babiloni, C., Arakaki, X., Baez, S., Barry, R. J., Benussi, A., Blinowska, K., Bonanni, L., Borroni, B., Bayard, J. B., Bruno, G., Cacciotti, A., Carducci, F., Carino, J., Carpi, M., Conte, A., Cruzat, J., D’Antonio, F., Della Penna, S., Percio, C. D., … Kamondi, A. (2025). Alpha rhythm and Alzheimer’s disease: Has Hans Berger’s dream come true? Clinical Neurophysiology, 172, 33–50. 10.1016/j.clinph.2025.02.256 - DOI - PubMed
    1. Barry, R. J., Clarke, A. R., Johnstone, S. J., Magee, C. A., & Rushby, J. A. (2007). EEG differences between eyes-closed and eyes-open resting conditions. Clinical Neurophysiology, 118(12), 2765–2773. 10.1016/j.clinph.2007.07.028 - DOI - PubMed
    1. Belouchrani, A.,Abed-Meraim, K.,Cardoso, J.-F., & Moulines, E. (1997). A blind source separation technique using second-order statistics. IEEE Transactions on Signal Processing, 45(2), 434–444. https://doi.org/10.1109/78.554307
    1. Berger, H. (1929). Über das elektrenkephalogramm des menschen. Archiv für Psychiatrie und Nervenkrankheiten, 87(1), 527–570. 10.1007/bf01797193 - DOI
    1. Bonnefond, M., & Jensen, O. (2012). Alpha oscillations serve to protect working memory maintenance against anticipated distracters. Current Biology, 22(20), 1969–1974. 10.1016/j.cub.2012.08.029 - DOI - PubMed

LinkOut - more resources