. 2025 Jan 29:3:imag_a_00437.
doi: 10.1162/imag_a_00437. eCollection 2025.

Evidence for a compensatory relationship between left- and right-lateralized brain networks

Affiliations

Evidence for a compensatory relationship between left- and right-lateralized brain networks

Madeline Peterson et al. Imaging Neurosci (Camb). .

Abstract

The two hemispheres of the human brain are functionally asymmetric. At the network level, the language network exhibits left-hemisphere lateralization. While this asymmetry is widely replicated, the extent to which other functional networks demonstrate lateralization remains a subject of investigation. Additionally, it is unknown how the lateralization of one functional network may affect the lateralization of other networks within individuals. We quantified lateralization for each of 17 networks by computing the relative surface area on the left and right cerebral hemispheres. After examining the ecological, convergent, and external validity and test-retest reliability of this surface area-based measure of lateralization, we addressed two hypotheses across multiple datasets (Human Connectome Project = 553, Human Connectome Project-Development = 343, Natural Scenes Dataset = 8). First, we hypothesized that networks associated with language, visuospatial attention, and executive control would show the greatest lateralization. Second, we hypothesized that relationships between lateralized networks would follow a dependent relationship such that greater left lateralization of a network would be associated with greater right lateralization of a different network within individuals, and that this pattern would be systematic across individuals. A language network was among the three networks identified as being significantly left lateralized, and attention and executive control networks were among the five networks identified as being significantly right lateralized. Next, correlation matrices, an exploratory factor analysis, and confirmatory factor analyses were used to test the second hypothesis and examine the organization of lateralized networks. We found general support for a dependent relationship between highly left- and right-lateralized networks, meaning that across subjects, greater left lateralization of a given network (such as a language network) was linked to greater right lateralization of another network (such as a ventral attention/salience network) and vice versa. These results further our understanding of brain organization at the macro-scale network level in individuals, carrying specific relevance for neurodevelopmental conditions characterized by disruptions in lateralization such as autism and schizophrenia.

Keywords: asymmetry; attention; brain networks; fMRI; language; lateralization.


Conflict of interest statement

The authors have no known conflict of interest to disclose.

Figures

Fig. 1.
Fig. 1.
Participant age, data quality, and data availability. Panel (A) depicts participant age across each dataset following the implementation of exclusion criteria. HCP-Discovery participants included 276 individuals 22–36 years of age, HCP-Replication participants included 277 individuals 22–36 years of age, HCPD participants included 343 individuals 11–22 years of age, and NSD participants included 8 individuals 19–32 years of age. Panel (B) depicts the mean framewise displacement (FD) across each dataset following the implementation of exclusion criteria. HCP-Discovery mean FD was 0.08 mm (SD= 0.02 mm), range 0.04–0.14 mm; HCP-Replication mean FD was 0.07 mm (SD= 0.01 mm), range 0.04–0.12 mm; HCPD mean FD was 0.08 mm (SD= 0.02 mm), range 0.04–0.16 mm; NSD-Rest mean FD was 0.07 mm (SD= 0.03), range 0.04–0.11 mm; and NSD-Task mean FD was 0.07 mm (SD= 0.02 mm), range 0.04–0.1 mm. Panel (C) depicts the percentage of volumes remaining following motion-correction procedures for each dataset. HCP-Discovery mean percentage of volumes was 72.81% (SD= 12.12%), range 50.38–98.54%; HCP-Replication mean percentage of volumes was 72.09% (SD= 11.59%), range 50.04–97.62%; HCPD mean percentage of volumes was 73.6% (SD= 11.73%), range 50.05–99.63%; NSD-Rest mean percentage of volumes was 87.64% (SD= 10.51%), range 68.98–99.14%; and NSD-Task mean percentage of volumes was 94.27% (SD= 6.92), range 78.31–100%. Across each panel, a circle represents a single participant.
Fig. 2.
Fig. 2.
Illustration of the Multi-Session Hierarchical Bayesian Modeling (MS-HBM) individual parcellation pipeline. First, a connectivity profile is generated for each available fMRI run on an individual basis (illustrated here as a functional connectivity matrix). Next, group priors previously estimated (R. Kong et al., 2019) from 37 Genomic Superstruct Project (GSP) subjects were used. Third, the connectivity profiles from each available run and the group priors (more specifically, the intersubject functional connectivity variability, intrasubject functional connectivity variability, spatial smoothness, and intersubject spatial variability) are used to generate network parcellations for each participant. Finally, the network surface area ratio (NSAR) is calculated using the formula shown, where LH SA is the left hemisphere surface area for a given network and RH SA is the right hemisphere surface area for a given network. A negative NSAR value indicates left hemisphere lateralization for a given network while a positive value indicates right hemisphere lateralization.
Fig. 3.
Fig. 3.
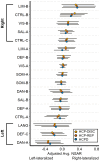
Lateralization for 17 networks across the HCP-Discovery, HCP-Replication, and HCPD datasets. On the y-axis are the 17 networks and on the x-axis are the adjusted NSAR values, with negative values representing left hemisphere lateralization and positive values representing right hemisphere lateralization. Bars represent the 2.5 and 97.5 percentiles. NSAR values were adjusted by regressing out the effects of mean-centered age, mean-centered mean framewise displacement, and sex using the following formula: NSARadjusted= NSARraw– [β1(mean-centered ageraw– mean of mean-centered ageraw) + β2(mean-centered FDraw– mean of mean-centered FDraw) + β3(sexraw– mean sexraw) + β4(handednessraw– mean handednessraw)]. NSAR adjustment occurred separately for each network within each dataset. Lines represent the standard error. Across the three datasets, eight networks were reliably and significantly lateralized (left lateralized: Language, Dorsal Attention-A, and Default-C; right lateralized: Visual-B, Salience/Ventral Attention-A, Control-B, Control-C, and Limbic-B).
Fig. 4.
Fig. 4.
Relationships between lateralized networks across the HCP-Discovery, HCP-Replication, and HCPD datasets. Correlation matrices were created from the model-adjusted NSAR values from the eight lateralized networks (Visual-B, Language, Dorsal Attention-A, Salience/Ventral Attention-A, Control-B, Control-C, Default-C, and Limbic-B), controlling for sex, mean-centered age, mean-centered framewise displacement, and handedness. Correlation values thresholded atp= .05 are displayed in the upper triangles, and consistent relationships have been highlighted with black boxes.
Fig. 5.
Fig. 5.
Negative correlations between highly left- and right-lateralized networks across the HCP-Discovery, HCP-Replication, and HCPD datasets. Panel (A) depicts the negative relationship between the Limbic-B and Dorsal Attention-A networks (HCP-Discovery:r(274) = -0.45, adjustedR2= 0.2; HCP-Replication:r(275) = -0.41, adjustedR2= 0.16; HCPD:r(341) = -0.47, adjustedR2= 0.22). Panel (B) depicts the negative relationship between the right-lateralized Limbic-B and left-lateralized Default-C networks (HCP-Discovery:r(274) = -0.42, adjustedR2= 0.17; HCP-Replication:r(275) = -0.31, adjustedR2= 0.09; HCPD:r(341) = -0.37, adjustedR2= 0.14). Panel (C) depicts the negative relationship between the right-lateralized Salience/Ventral Attention-A network and left-lateralized Language network (HCP-Discovery:r(274) = -0.3, adjustedR2= 0.09; HCP-Replication:r(275) = -0.25, adjustedR2= 0.06; HCPD:r(341) = -0.2, adjustedR2= 0.04). In each panel, a circle represents a single participant’s model-adjusted NSAR value, which was adjusted for mean-centered age, sex, handedness, and mean-centered mean framewise displacement.

Update of

References

    1. Allen , E. J. , St-Yves , G. , Wu , Y. , Breedlove , J. L. , Prince , J. S. , Dowdle , L. T. , Nau , M. , Caron , B. , Pestilli , F. , Charest , I. , Hutchinson , J. B. , Naselaris , T. , & Kay , K. ( 2022. ). A massive 7T fMRI dataset to bridge cognitive neuroscience and artificial intelligence . Nature Neuroscience , 25 ( 1 ), Article 1. 10.1038/s41593-021-00962-x - DOI - PubMed
    1. Amici , S. , Gorno-Tempini , M. L. , Ogar , J. M. , Dronkers , N. F. , & Miller , B. L. ( 2006. ). An overview on primary progressive aphasia and its variants . Behavioural Neurology , 17 ( 2 ), 77 – 87 . 10.1155/2006/260734 - DOI - PMC - PubMed
    1. Andrew , R. J. , Mench , J. , & Rainey , C. ( 1982. ). Right-left asymmetry of response to visual stimuli in the domestic chick . In Ingle D. J. , Goodale M. A. , & Mansfield R. J. W. , (Eds.), Analysis of Visual Behaviour , (pp. 197 – 209 ). MIT Press; . ISBN: 9780262090223.
    1. Anticevic , A. , Dierker , D. L. , Gillespie , S. K. , Repovs , G. , Csernansky , J. G. , Van Essen , D. C. , & Barch , D. M. ( 2008. ). Comparing surface-based and volume-based analyses of functional neuroimaging data in patients with schizophrenia . NeuroImage , 41 ( 3 ), 835 – 848 . 10.1016/j.neuroimage.2008.02.052 - DOI - PMC - PubMed
    1. Argall , B. D. , Saad , Z. S. , & Beauchamp , M. S. ( 2006. ). Simplified intersubject averaging on the cortical surface using SUMA . Human Brain Mapping , 27 ( 1 ), 14 – 27 . 10.1002/hbm.20158 - DOI - PMC - PubMed

LinkOut - more resources