. 2025 Aug 11;23(3):15593258251367627.
doi: 10.1177/15593258251367627. eCollection 2025 Jul-Sep.

Combined Effects of Metformin, Quercetin, and Fractionated Gamma Irradiation on MiR-107-Mediated Brain Injury in HFD/STZ-Induced Diabetic Rats

Affiliations

Combined Effects of Metformin, Quercetin, and Fractionated Gamma Irradiation on MiR-107-Mediated Brain Injury in HFD/STZ-Induced Diabetic Rats

Omayma A R Abozaid et al. Dose Response. .

Abstract

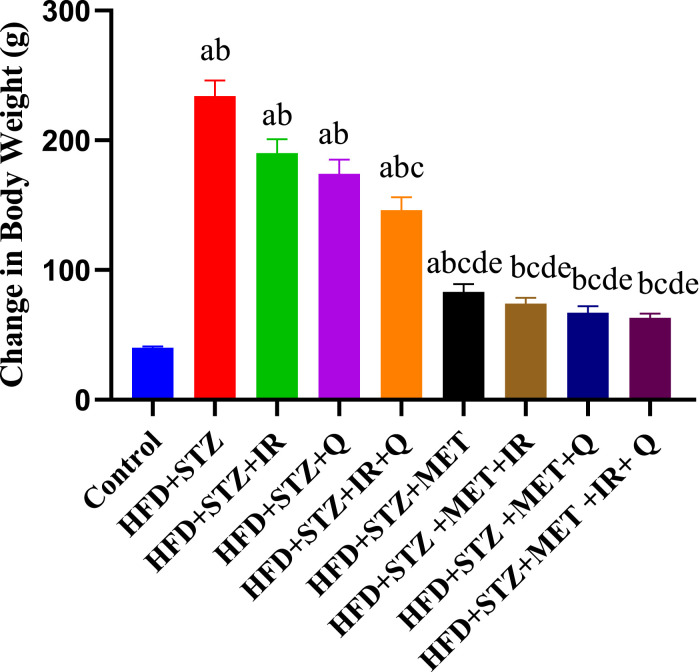
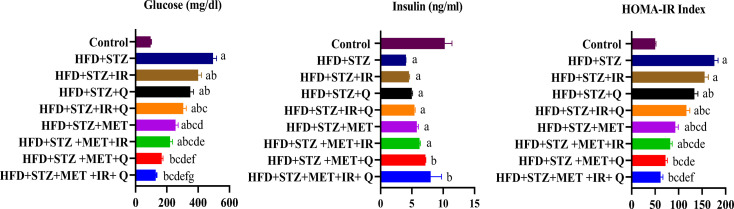
Objectives: MiR-107 upregulation represents a key target among the multiple pathways associated with T2DM. Given that drug combinations offer significant therapeutic potential, this study investigated the antidiabetic, antioxidant, and anti-inflammatory effects of γ-irradiation, the quercetin (common flavonol), and the metformin (biguanide) on HFD/STZ-induced diabetic rats' brains. Methods: Diabetic rats were treated with metformin (200 mg/kg b.w./day) alone or in combination with quercetin (30 mg/kg b.w./day) and/or γ-radiation (fractionated 4 Gy) for 4 weeks. Results: The diabetic group exhibited increased body weight, blood glucose, HOMA-IR, AChE, MMP-2, and lipid peroxidation, while serum insulin and brain GPx antioxidant enzyme activity were significantly decreased. Similarly, BDNF and SIRTI transcript levels and IRS1 protein expression were reduced, whereas NF-κB and MiR-107 transcript levels were elevated in diabetic rats compared to controls. Histopathological examination of diabetic brain tissue corroborated the biochemical findings. Treatment with metformin alone or in combination with γ-irradiation and/or quercetin effectively mitigated these effects by downregulating miR-107 and improving brain function, with optimal results achieved through combined therapy. Conclusion: The synergistic combination of Metformin, fractionated gamma-irradiation, and quercetin effectively attenuates brain injury in diabetic rats by enhancing IRS1/SIRT1/BDNF signaling while suppressing MiR-107/NF-κB pathways.

Keywords: BDNF; IRS1; MiR-107; NF-κB; SIRT1; biguanide.


Conflict of interest statement

The authors declared no potential conflicts of interest with respect to the research, authorship, and/or publication of this article.

Figures

Graphical Abstract
Graphical Abstract
Figure 1.
Figure 1.
Effect of Different Treatments on Body Weight Change. Each Value Represents Mean ± SEM (n = 6). Mean ± SEM (n = 6). Each Value Represents Mean ± SEM (n = 6). Columns Denoted With ˝a˝ Significant From Control, ˝b˝: Significant From HFD + STZ, c˝ Significant From HFD + STZ + IR, ˝d˝ Significant From HFD + STZ + Q, ˝e˝ Significant From HFD + STZ + IR+Q, ˝f˝ Significant From HFD + STZ + MET, ˝g˝ Significant From HFD + STZ + MET+IR, ˝h˝ Significant From HFD + STZ + MET+Q and ˝i˝ Significant From HFD + STZ + MET+IR + Q at (P < 0.001). Two-Way ANOVA Followed by Tukys Post Analytic Test
Figure 2.
Figure 2.
Effect of Different Treatments on Blood Glucose Change Level. Mean ± SEM (n = 6). Each Value Represents Mean ± SEM (n = 6). Columns Denoted With ˝a˝ Significant From Control, ˝b˝: Significant From HFD + STZ, c˝ Significant From HFD + STZ + IR, ˝d˝ Significant From HFD + STZ + Q, ˝e˝ Significant From HFD + STZ + IR+Q, ˝f˝ Significant From HFD + STZ + MET, ˝g˝ Significant From HFD + STZ + MET+IR, ˝h˝ Significant From HFD + STZ + MET+Q and ˝i˝ Significant From HFD + STZ + MET+IR + Q at (P < 0.001). Two-Way ANOVA Followed by Turkey’s Post Analytic Test
Figure 3.
Figure 3.
The Concentration of (A) Serum Glucose, (b) Serum Insulin (C) HOMA-IR Index in Various Animal Groups after 4 weeks of Continuous Treatment. Each Value Represents Mean ± SEM (n = 6). Columns Denoted With ˝a˝ Significant From Control, ˝b˝: Significant From HFD + STZ, c˝ Significant From HFD + STZ + IR, ˝d˝ Significant From HFD + STZ + Q, ˝e˝ Significant From HFD + STZ + IR+Q, ˝f˝ Significant From HFD + STZ + MET, ˝g˝ Significant From HFD + STZ + MET+IR, ˝h˝ Significant From HFD + STZ + MET+Q and ˝i˝ Significant From HFD + STZ + MET+IR + Q at (P < 0.001)
Figure 4.
Figure 4.
Effect of Different Treatments on AchE Level. Each Value Represents Mean ± SEM (n = 6). Columns Denoted With ˝a˝ Significant From Control, ˝b˝: Significant From HFD + STZ, c˝ Significant From HFD + STZ + IR, ˝d˝ Significant From HFD + STZ + Q, ˝e˝ Significant From HFD + STZ + IR+Q, ˝f˝ Significant From HFD + STZ + MET, ˝g˝ Significant From HFD + STZ + MET+IR, ˝h˝ Significant From HFD + STZ + MET+Q and ˝i˝ Significant From HFD + STZ + MET+IR + Q at (P < 0.001). One-Way ANOVA Followed by Turkey’s Test
Figure 5.
Figure 5.
Effect of Different Treatments on MMP-2. Each Value Represents Mean ± SEM (n = 6). Columns Denoted With ˝a˝ Significant From Control, ˝b˝: Significant From HFD + STZ, c˝ Significant From HFD + STZ + IR, ˝d˝ Significant From HFD + STZ + Q, ˝e˝ Significant From HFD + STZ + IR+Q, ˝f˝ Significant From HFD + STZ + MET, ˝g˝ Significant From HFD + STZ + MET+IR, ˝h˝ Significant From HFD + STZ + MET+Q and ˝i˝ Significant From HFD + STZ + MET+IR + Q at (P < 0.001). One-Way ANOVA Followed by Tukey’s Test
Figure 6.
Figure 6.
The Brain Concentration of IRS1 Protein and β-actin in Normal Control Rats (G1), Diabetic Rats (HFD + STZ, G2), and Those Diabetic Rats Treated With Gamma Radiation (IR, G3), Quercetin (Q, G4), Combination of (IR + Q, G5), Metformin (MET, G6), or a Combination of These Treatments (G7), (G8) and (G9). Each Vertical Column With bar Represents the Mean ± SEM (From 6 Rats in Each Group). Columns Denoted With ˝a˝ Significant From Control, ˝b˝: Significant From HFD + STZ, ˝c˝ Significant From HFD + STZ + IR, ˝d˝ Significant From HFD + STZ + Q, ˝e˝ Significant From HFD + STZ + IR+Q, ˝f˝ Significant From HFD + STZ + MET, ˝g˝ Significant From HFD + STZ + MET+IR, ˝h˝ Significant From HFD + STZ + MET+Q and ˝i˝ Significant From HFD + STZ + MET+IR + Q at (P < 0.001)
Figure 7.
Figure 7.
Quantitative RT-PCR Analysis of the mRNA Levels of MiR-107, BDNF, SIRT1 and NF-κB in Different Treated Diabetic Rats. Each Column and Vertical bar Represent Mean ± SEM (n = 6). Differences Between the Groups Were Assessed by One-Way Analysis of Variance (ANOVA) Followed by Tukey Test, Each Vertical Column With bar Represents the Mean ± SEM (From 6 Rats in Each Group). Columns Denoted With ˝a˝ Significant From Control, ˝b˝: Significant From HFD + STZ, c˝ Significant From HFD + STZ + IR, ˝d˝ Significant From HFD + STZ + Q, ˝e˝ Significant From HFD + STZ + IR+Q, ˝f˝ Significant From HFD + STZ + MET, ˝g˝ Significant From HFD + STZ + MET+IR, ˝h˝ Significant From HFD + STZ + MET+Q and ˝i˝ Significant From HFD + STZ + MET+IR + Q at (P < 0.001)
Figure 8.
Figure 8.
Representative Photographs Sections of Brain Tissues (x 400) and Morphometric Variations Across Different Experimental Groups in Cerebral Cortex and Hippocampus. Figure A represents Normal Control Showed (A1) Normal Histological Structure of Cerebral Cortex; (A2) Normal Histological Structure of Hippocampal Dentate Gyrus Arrow. Figure B Represents the Diabetic Group (HFD + STZ) Showed (B1) Focal Gliosis (Red) and Apoptosis of Neuronal Cells (Black) Arrow; (B2) Atrophy With Cellular Disorganization Black Arrow (A) Focal Gliosis (Red) and Apoptosis of Neuronal Cells (Black) Arrow (B) Atrophy With Cellular Disorganization Black Arrow. Figure C Represents the Diabetic Group Treated With Gamma Radiation (HFD + STZ + IR) Showed (C1) Numerous Numbers of Apoptotic Neuronal Cells Black Arrow; (C2) Atrophy, Neuronal Degeneration and Nuclear Pyknosis of Molecular Cells Black Arrow in Hippocampal. Figure D Represents the Diabetic Group Treated With Quercetin (HFD + STZ + Q) Showed (D1) Apoptosis of Neuronal Cells which Surround by Halo Zone Black Arrow; (D2) Cellular Disorganization and Apoptosis of Granular Cells Arrow in Hippocampal. Figure E Represents the Diabetic Group Treated With 2 Last Groups (HFD + STZ + IR+Q) Showed (E1) Apoptosis of Neuronal Cells Black Arrow; (E2) Nuclear Pyknosis of Molecular Cells Black Arrow. Figure F Represents the Diabetic Group Treated With Metformin (HFD + STZ + MET) Showed (F1) Apoptosis of Neuronal Cells which Associated With Focal Gliosis Black Arrow; (F2) Swelling of Granular Cells and Shrinkage of Pyramidal Cells Black Arrow. Figure G represents the Treated Group With (HFD + STZ + MET+IR) Showed (G1) Swelling of Neuronal Cells (Red) and Gliosis Black Arrow; (G2) Cellular Disorganization and Vacuolar Degeneration of Granular Cells Black Arrow. Figure H Represents the Treated Group With (HFD + STZ + MET+Q) Showed (H1) Mild Swelling of Neuronal Cells Black Arrow; (H2) Cellular Organization and Vacuolations of Granular Cell Layers Black Arrow. Figure I Represents the Treated Group With (HFD + STZ + MET+IR + Q) Showed (I1) Few Numbers of Degenerated Neuronal Cells Black Arrow; (I2) Cellular Organization and Shrinkage in Size of Pyramidal Cells Black Arrow. Scale Bars Represent 10 µm
Figure 9.
Figure 9.
Mechanisms Underlying Insulin Resistance, Oxidative and Inflammatory Pathway Suppression by Combining Metformin With Gamma Radiation and Quercetin. They Promote the Activation of Insulin Signaling Molecules IRS1through Caveolin1 (CAV-1). In Addition, They Enhance the Cellular Function via MIR-107 Downregulation. They Alleviate Diabetic Complications by Inhibition of Stressful Stimuli and Improve Antioxidant Capacity Through NF-κB Downregulation which Influenced by Acetylation Caused by Activation of SIRT1 .Also, They Improve Glucose and Insulin Homeostasis by Activation BDNF. They Exert Their Anti-inflammatory Efficiencies by Interrupting the ROS Mediated Inflammation and Down-Regulate all Inflammatory Mediators. (↑): Up-Regulated Targets; (↓) Down-Regulated Targets

Similar articles

References

    1. Wang HJ, Zhang LB, Sun SP, et al. Duodenal-jejunal bypass improves hypothalamic oxidative stress and inflammation in diabetic rats via glucagon-like peptide 1-mediated Nrf2/HO-1 signaling. World J Diabetes. 2024;15(2):287-304. doi: 10.4239/wjd.v15.i2.287 - DOI - PMC - PubMed
    1. Chen Y, Liu X, Zhang Y, et al. Type 3 diabetes and metabolic reprogramming of brain neurons: causes and therapeutic strategies. Mol Med. 2025;31(1):1. doi: 10.1186/s10020-025-01101-z - DOI - PMC - PubMed
    1. Carreras A, Diaz-Torga G, Morales C, et al. MicroRNAs as regulators of insulin signaling: research updates and potential therapeutic perspectives in type 2 diabetes. Int J Mol Sci. 2018;19(12):3705. doi: 10.3390/ijms19123705 - DOI - PMC - PubMed
    1. Bhattacharya S, Ahsan CR, Dutta P, et al. Metformin: beyond diabetes management to neuroprotection and cognitive enhancement. Curr Pharmacol Rep. 2025;11:1-18. doi: 10.1007/s40495-025-00395-1 - DOI
    1. Zou J, Chen Z, Liang C, et al. Metformin in elderly type 2 diabetes mellitus: dose-dependent dementia risk reduction. Brain. 2024;147(4):1474-1484. doi: 10.1093/brain/awad347 - DOI - PubMed

LinkOut - more resources