. 2025 Aug;13(8):e70239.
doi: 10.1002/iid3.70239.

Human Umbilical Cord Mesenchymal Stem Cells Modulate Cytokine Secretion of CD4+ T Cell in Systemic Lupus Erythematosus by Inhibiting HSP90AA1 in the Glucose-Activated PI3K-AKT Pathway

Affiliations

Human Umbilical Cord Mesenchymal Stem Cells Modulate Cytokine Secretion of CD4+ T Cell in Systemic Lupus Erythematosus by Inhibiting HSP90AA1 in the Glucose-Activated PI3K-AKT Pathway

Lu Jin et al. Immun Inflamm Dis. 2025 Aug.

Abstract

Objective: Treatment with human umbilical cord mesenchymal stem cells (hUC-MSCs) attenuated the clinical manifestations of systemic lupus erythematosus (SLE). We investigated the metabolic mechanism whereby hUC-MSCs modify CD4+ T cell cytokine secretion in lupus.

Methods: The study enrolled 30 untreated lupus patients and 20 sex, age, and body mass index matched healthy controls (HCs). CD4+ T cells were isolated by magnetic sorting, and stimulated with anti-CD3/CD28. The hUC-MSCs treatment (MSCT) groups were coculturing hUC-MSCs to CD4+ T cells from moderate and severe SLE (SLE-MS) groups for 72 h at ratios of 1:25 (T1), 1:10 (T2), and 1:5 (T3). Cytokine concentration and proliferation of the CD4+ T cells were measured by Luminex liquid chip assay and cell counting kit-8, respectively. Glucose metabolic capacity was measured by Seahorse real-time metabolic analysis. The role of hUC-MSCs on cytokine secretion was analyzed by transcriptome sequencing. Glucose enzymes levels and HSP90AA1/PI3K/AKT pathway activity were analyzed by real-time quantitative PCR and western blot. The CD4+ T cell subsets were detected by flow cytometry.

Results: Compared with HCs, the enhanced glycolysis and mitochondrial oxygen consumption of SLE-CD4+ T cells were positively associated with disease activity. Treatment with hUC-MSCs proportionally decreased glucose metabolism and proliferation of SLE-CD4+ T cells. The hUC-MSCs treatment significantly diminished supernatant concentrations of interferon-γ, tumor necrosis factor-α, interleukin (IL)-4, and IL-17 in SLE-MS group, as well as inhibited HSP90AA1 in the glucose-activated PI3K-AKT pathway. In animal experiment, the systemic administration of hUC-MSCs and inhibition of HSP90AA1 resulted in a reduction of glucose metabolites, enzymes, pro-inflammatory factor levels, and HSP90AA1/PI3K/AKT signaling pathway activity.

Conclusions: The hUC-MSCs treatment inhibited overactive glucose metabolism of SLE-CD4+ T cells. HSP90AA1 in the PI3K-AKT pathway induced by the glucose metabolism may be involved in the anti-inflammatory function of hUC-MSCs treatment.

Keywords: CD4+ T cell; HSP90AA1; Lupus; PI3K‐AKT pathway; cytokine; glucose metabolism; mesenchymal stem cell.


Conflict of interest statement

The authors declare no conflicts of interest.

Figures

Figure 1
Figure 1
Clinical base line of lupus patients. ACL, antiphospholipid antibody; ANA, antinuclear antibody; C3, complement factor 3; C4, complement factor 4; dsDNA, double‐strand DNA; LA, lupus anticoagulants; SLEDAI‐2K, Systemic Lupus Erythematosus Disease Activity Index‐2000.
Figure 2
Figure 2
Identification and differentiation of hUC‐MSCs. (A) The expression of CD90, CD105, and CD73 were 99.94%, 99.78%, and 99.84%, respectively. The expression of CD45, CD34, and HLA‐DR were 0.26%, 0.46%, and 0.01%, respectively. (B) hUC‐MSCs showed spindle form such as fibroblast‐like cells in vitro culture (×100 magnification; scale bar, 200 μm). (C–E) The differentiate capacity of hUC‐MSCs was analyzed by culturing the cells in a differentiation medium for 3–4 weeks. After incubation, the osteocytes, adipocytes and chondrocytes were visualized as red color after alizarin red (C) and oil red o staining (D), blue color after alcian blue staining (E), respectively (magnification, ×100, ×400, and ×40, respectively; scale bar, 262.8, 65.7, and 657 μm, respectively).
Figure 3
Figure 3
Glucose metabolism analysis of CD4+ T cells in lupus patients. (A–D) The OCR (A), spare respiration capacity (B), ECAR (C), and compensatory glycolysis (D) of CD4+ T cells in SLE group and controls. (E–H) The OCR (E), spare respiration capacity (F), ECAR (G), and compensatory glycolysis (H) of CD4+ T cells in SLE patients with different activity and controls. (I) The correlation between glucose metabolism and expansion of CD4+ T cells, and disease activity in SLE. SLE group, n = 30; SLE‐severe group, n = 7; SLE‐moderate group, n = 11; SLE‐mild group, n = 12; HCs, n = 20. 2‐DG, 2‐deoxyglucos; ECAR, extracellular acidification rate; FCCP, mitochondrial oxidative phosphorylation uncouple carbonyl cyanide 4‐trifluoromethoxy phenylhydrazone; HCs, healthy controls; OCR, oxygen consumption rate; OD, optical density; Rot/AA, rotenone/antimycin A; SRC, spare respiration capacity. *p < 0.05, ***p < 0.001.
Figure 4
Figure 4
The hUC‐MSCs treatment effects on glycometabolic capacity and proliferation of CD4+ T cell in lupus patients with moderate and severe activity. The OCR (A) and ECAR (B) of CD4+ T cells from SLE‐MS group, MSCT groups, and HCs. (C–E) The spare respiratory capacity (C), compensatory glycolysis (D) and OD (E) of CD4+ T cells in a fixed number cocultured with hUC‐MSCs at different ratios in SLE‐MS group. HCs, n = 20; SLE‐MS group, n = 18; T1, T2, and T3 groups, n = 6; respectively. 2‐DG, 2‐deoxyglucos; ECAR, extracellular acidification rate; FCCP, mitochondrial oxidative phosphorylation uncouple carbonyl cyanide 4‐ trifluoromethoxy phenylhydrazone; HCs, healthy controls; MSCT, hUC‐MSCs treatment; OCR, oxygen consumption rate; OD optical density; Rot/AA, rotenone/antimycin A; SLE‐MS, patients with moderate and severe SLE; SRC, spare respiration capacity. ***p < 0.001.
Figure 5
Figure 5
The hUC‐MSCs treatment effects on CD4+ T cell cytokine secretion in lupus patients with moderate and severe activity. (A–E) Treatment with hUC‐MSCs significantly decreased the supernatant levels of IFN‐γ (A), TNF‐α (B), IL‐4 (C), and IL‐17 (E), while increased IL‐10 level (D). SLE‐MS group, patients with moderate and severe SLE, n = 6; MSCT group, CD4+ T cells from SLE‐MS group cocultured with hUC‐MSCs at the ratio of 10: 1, n = 6; HCs, healthy controls, n = 6. IFN‐γ, interferon γ; IL, interleukins; TNF‐α, tumor necrosis factor‐α. *p < 0.05, ***p < 0.001.
Figure 6
Figure 6
Transcriptomic analysis of CD4+ T cells in lupus patients with moderate and severe activity cocultured with or without hUC‐MSCs and HCs. (A) RNA sequencing shows gene expression profiling of DEGs in three groups. (B) Volcano plots of DEGs of two sets of gene clusters and the downregulated genes of MSCT group. (C) Wayne diagram of two sets of DEGs clusters. (D–F) KEGG enrichment analysis (D), GO enrichment analysis (E), and Sankey plot (F) of DEGs from the intersecting cluster. SLE‐MS group, patients with moderate and severe SLE, n = 3; MSCT group, CD4+ T cells from SLE‐MS group cocultured with hUC‐MSCs at the ratio of 10: 1, n = 3; HCs, healthy controls, n = 3. DEGs, differentially expressed genes; GO, gene ontology; KEGG, Kyoto encyclopedia of gene and genomes.
Figure 7
Figure 7
Identification of hub gene and glucose metabolism association analysis. (A) Gene interaction network analysis of DEGs from the intersecting cluster. (B) The mRNA expression of HSP90AA1 in CD4+ T cells from patients with moderate and severe SLE cocultured with or without hUC‐MSCs, 2‐DG, and metformin. SLE‐MS group, patients with moderate and severe SLE, n = 3; MSCT group, CD4+ T cells from SLE‐MS group cocultured with hUC‐MSCs at the ratio of 10: 1, n = 3; SLE + 2‐DG group, CD4+ T cells from SLE‐MS group cocultured with 2‐DG at the concentration of 1 mM, n = 3; SLE+Met group, CD4+ T cells from SLE‐MS group cocultured with metformin at the concentration of 5 mM, n = 3; HCs, healthy controls, n = 3. 2‐DG, 2‐deoxyglucos; Met, metformin. *p < 0.05; **p < 0.01.
Figure 8
Figure 8
Systemic administration of hUC‐MSCs relieved MRL/lpr mice disease manifestations. (A) Changes of proteinuria from Week 10 to 20. Systemic administration of hUC‐MSCs significantly decreased the urine protein of lupus prone mice at Weeks 17–20. (B) Systemic administration of hUC‐MSCs particularly inhibited anti‐dsDNA antibodies formation in the serum of MRL/lpr mice. All n = 5. *p < 0.05, ***p < 0.001, ****p < 0.0001.
Figure 9
Figure 9
Systemic administration of hUC‐MSCs revised pro‐inflammatory profile in MRL/lpr mice. Treatment with hUC‐MSCs inhibited the serum levels of (A) IFN‐γ, (B) TNF‐α, (C) IL‐4, and (D) IL‐17A, and increased the expression of (E) IL‐10 and (F) TGF‐β1. All n = 5.*p < 0.05, **p < 0.01, ***p < 0.001.
Figure 10
Figure 10
Systemic administration of hUC‐MSCs inhibited serum levels of glucose metabolites, mRNA, and protein expressions of glucose enzymes, HSP90AA1, PI3K, and AKT in the splenic CD4+ T cells of MRL/lpr mice. Treatment with hUC‐MSCs decreased the serum levels of (A) glucose and (B) lactate in MRL/lpr mice, n = 5. (C) The mRNA qualification and (D) relative protein expressions of glucose enzymes, HSP90AA1, PI3K, and AKT of splenic CD4+ T cells in MRL/lpr mice. (E) Representative immunoblot analysis of proteins in splenic CD4+ T cell in each group, n = 3. *p < 0.05, **p < 0.01, ***p < 0.001, ****p < 0.0001.
Figure 11
Figure 11
In vitro animal experiment, cocultured with hUC‐MSCs inhibited supernatant levels of glucose metabolites, mRNA, and protein expressions of glucose enzymes, HSP90AA1, PI3K, and AKT in the splenic CD4+ T cells of MRL/lpr mice. Cocultured with hUC‐MSCs decreased the serum levels of (A) lactate and (B) LDH in MRL/lpr mice, both n = 5. (C) The mRNA qualification and (D) relative protein expressions of glucose enzymes, HSP90AA1, PI3K, and AKT of splenic CD4+ T cells in MRL/lpr mice. (E) Representative immunoblot analysis of proteins in splenic CD4+ T cell in each group, all n = 3. *p < 0.05, **p < 0.01, ***p < 0.001, ****p < 0.0001.
Figure 12
Figure 12
In vitro animal experiment, cocultured with hUC‐MSCs revised pro‐inflammatory profile in MRL/lpr mice. Cocultured with hUC‐MSCs inhibited the supernatant levels of (A) IFN‐γ, (B) TNF‐α, (C) IL‐4, and (D) IL‐17A, and increased the expression of (E) IL‐10 and (F) TGF‐β1. All n = 5. *p < 0.05, **p < 0.01, ***p < 0.001,****p < 0.0001.
Figure 13
Figure 13
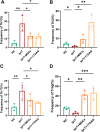
Flow cytometry analysis of splenic CD4+ T cell in vitro animal experiment. The frequency of (A) Th1, (B) Th2, (C) Th17, and (D) Treg cells of each mice group. All n = 3, *p < 0.05, **p < 0.01, ***p < 0.001.
Figure 14
Figure 14
CD4+ T cells in SLE exhibit overactive glucose metabolism. Treatment with hUC‐MSCs effectively inhibits pro‐inflammatory milieu to promote disease remission by decreasing the expression of HSP90AA1 in the PI3K‐AKT pathway induced by CD4+ T cell glucose metabolic activation.

Similar articles

References

    1. Li H., Boulougoura A., Endo Y., and Tsokos G. C., “Abnormalities of T Cells in Systemic Lupus Erythematosus: New Insights in Pathogenesis and Therapeutic Strategies,” Journal of Autoimmunity 132 (2022): 102870. - PubMed
    1. Huang J., Li X., Zhu Q., Wang M., Xie Z., and Zhao T., “Imbalance of Th17 Cells, Treg Cells and Associated Cytokines in Patients With Systemic Lupus Erythematosus: A Meta‐Analysis,” Frontiers in immunology 15 (2024): 1425847. - PMC - PubMed
    1. Xiang S., Zhang J., Zhang M., et al., “Imbalance of Helper T Cell Type 1, Helper T Cell Type 2 and Associated Cytokines in Patients With Systemic Lupus Erythematosus: A Meta‐Analysis,” Frontiers in Pharmacology 13 (2022): 988512. - PMC - PubMed
    1. Ding M., Jin L., Zhao J., et al., “Add‐On Sirolimus for the Treatment of Mild or Moderate Systemic Lupus Erythematosus via T Lymphocyte Subsets Balance,” Lupus Science & Medicine 11 (2024): e001072. - PMC - PubMed
    1. Yuliasih Y., Rahmawati L. D., and Putri R. M., “Th17/Treg Ratio and Disease Activity in Systemic Lupus Erythematosus,” Caspian Journal of Internal Medicine 10 (2019): 65–72. - PMC - PubMed

MeSH terms