. 2025 Oct;34(20):e70081.
doi: 10.1111/mec.70081. Epub 2025 Aug 13.

Museum Genomics Reveals Temporal Genetic Stasis and Global Genetic Diversity in Arabidopsis thaliana

Affiliations

Museum Genomics Reveals Temporal Genetic Stasis and Global Genetic Diversity in Arabidopsis thaliana

Lua Lopez et al. Mol Ecol. 2025 Oct.

Abstract

Global patterns of population genetic variation through time offer a window into evolutionary processes that maintain diversity. Over time, lineages may expand or contract their distribution, causing turnover in population genetic composition. At individual loci, migration, drift and selection (among other processes) may affect allele frequencies. Museum specimens of widely distributed species offer a unique window into the genetics of understudied populations and changes over time. Here, we sequenced genomes of 130 herbarium specimens and 91 new field collections of Arabidopsis thaliana and combined these with published genomes. We sought a broader view of genomic diversity across the species and to test if population genomic composition is changing through time. We documented extensive and previously uncharacterised diversity in a range of populations in Africa, populations that are under threat from anthropogenic climate change. Through time, we did not find dramatic changes in genomic composition of populations. Instead, we found a pattern of genetic change every 100 years of the same magnitude seen when comparing Eurasian populations that are 185 km apart, potentially due to a combination of drift and changing selection. We found only mixed signals of polygenic adaptation at phenology and physiology QTL. We did find that genes conserved across eudicots show altered levels of directional allele frequency change, potentially due to variable purifying and background selection. Our study highlights how museum specimens can reveal new dimensions of population diversity and show how wild populations are evolving in recent history.

Keywords: allele frequency change; genomic diversity; museum specimens; population structure; time series genomics.


Conflict of interest statement

The authors declare no conflicts of interest.

Figures
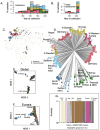
FIGURE 1
FIGURE 1
Sequenced accessions showing their distribution over time (A‐B) and coloured according to geography (C) or ADMIXTURE cluster (G) and with shapes indicating whether they were herbarium specimens (triangles) or sequenced from stock centre or newly collected accessions (circles). Neighbour joining tree (D) includes sample codes with country abbreviation and year collected from the wild (Table S1–S14). Two‐dimensional MDS for the entire dataset (E) highlights the divergence between Africa and Eurasia and (F) for Eurasia highlights the distinctness of the Iberian relicts. Specimens from countries of note are labelled on the tree. Cross validation error was lowest for ADMIXTURE K = 6 so these results are shown (G), with triangles at bottom indicating herbarium specimens. Shown are only accessions included in population genetic analyses (after filtering for balance between modern collections and herbarium).
FIGURE 2
FIGURE 2
Accessions from East and South Africa, with shapes indicating whether they were herbarium specimens (triangles) or sequenced from fresh tissue from stock centre or newly collected accessions (circles). Mountains of origin are labelled on the neighbour‐joining tree (A) and map (B). (C) MDS in two dimensions with mountains labelled. (D) Cross validation error lowest for ADMIXTURE K = 4; so these results are shown, with triangles at bottom indicating herbarium specimens.
FIGURE 3
FIGURE 3
Isolation by distance across the range of Arabidopsis. (A) Pairwise genetic distances within regions, comparing Eurasian non‐relicts to East African populations and (B) a truncated version focused on distances < 1000 km. (C) Comparing pairwise genetic distance within two of the best sampled regions in East Africa with Eurasian non‐relicts. (D) Scale‐specific wavelet genetic dissimilarity (line = mean among sampled locations, ribbon = ±1 SD) showed the much greater genetic turnover at scales ~100–500 km for both East African regions compared to Eurasian non‐relicts.
FIGURE 4
FIGURE 4
Genetic cluster membership over time (inset barplots) for regional subsets of genotypes (dashed boxes) with individual genotypes shown as pie charts indicating cluster assignment by ADMIXTURE with K = 6. Each genetic cluster that was most common in a region showed no significant change in the proportion of assigned ancestry for local genotypes over time (Spearman's rank correlation test, all p > 0.08). Herbarium specimens and stock centre genotypes are included here.
FIGURE 5
FIGURE 5
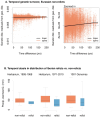
There is modest temporal genetic turnover (A) shown through residuals from a geographic mixed model versus time difference, with a linear model (black) and spline (red) fitted, while (B) at coarser levels of relatedness the distribution of relicts in drier parts of Iberia remains consistent through time. Note the changing y‐axis scales in (A) to show the statistically significant, albeit noisy, temporal turnover. (B) excludes Pyrenees because we did not have these populations sampled from herbaria.
FIGURE 6
FIGURE 6
Allele frequency trajectories for different subsets of SNPs (lines) and regions, modelled using generalised additive models (GAMs) for visualisation. Allele frequency trajectories are signed so that the y‐axis indicates the increase in frequency of the allele more common in recent years (the ‘new allele’) compared to the beginning of the time series. SNPs with significant temporal allele frequency change in linear mixed models controlling for kinship and geography (p < 0.05 for A–D, p < 0.01 for E, F) are shown in black. The random SNPs and the genic/intergenic SNPs shown are single draws from the indicated categories.

Update of

References

    1. Ågren, J. , Oakley C. G., Lundemo S., and Schemske D. W.. 2017. “Adaptive Divergence in Flowering Time Among Natural Populations of Arabidopsis thaliana: Estimates of Selection and QTL Mapping.” Evolution 71, no. 3: 550–564. 10.1111/evo.13126. - DOI - PubMed
    1. Ågren, J. , and Schemske D. W.. 2012. “Reciprocal Transplants Demonstrate Strong Adaptive Differentiation of the Model Organism <styled-content style="fixed-case"> Arabidopsis thaliana </styled-content> in Its Native Range.” New Phytologist 194, no. 4: 1112–1122. 10.1111/j.1469-8137.2012.04112.x. - DOI - PubMed
    1. Akbari, A. , Barton A. R., Gazal S., et al. 2024. “Pervasive Findings of Directional Selection Realize the Promise of Ancient DNA to Elucidate Human Adaptation.” Preprint, bioRxiv, September 15. 10.1101/2024.09.14.613021. - DOI
    1. Alexander, D. H. , Novembre J., and Lange K.. 2009. “Fast Model‐Based Estimation of Ancestry in Unrelated Individuals.” Genome Research 19, no. 9: 1655–1664. 10.1101/gr.094052.109. - DOI - PMC - PubMed
    1. Allentoft, M. E. , Sikora M., Fischer A., et al. 2024. “100 Ancient Genomes Show Repeated Population Turnovers in Neolithic Denmark.” Nature 625, no. 7994: 329–337. 10.1038/s41586-023-06862-3. - DOI - PMC - PubMed

LinkOut - more resources