. 2025 Jul 25;14(15):1145.
doi: 10.3390/cells14151145.

Oligodendrocyte-Specific STAT5B Overexpression Ameliorates Myelin Impairment in Experimental Models of Parkinson's Disease

Affiliations

Oligodendrocyte-Specific STAT5B Overexpression Ameliorates Myelin Impairment in Experimental Models of Parkinson's Disease

Yibo Li et al. Cells. .

Abstract

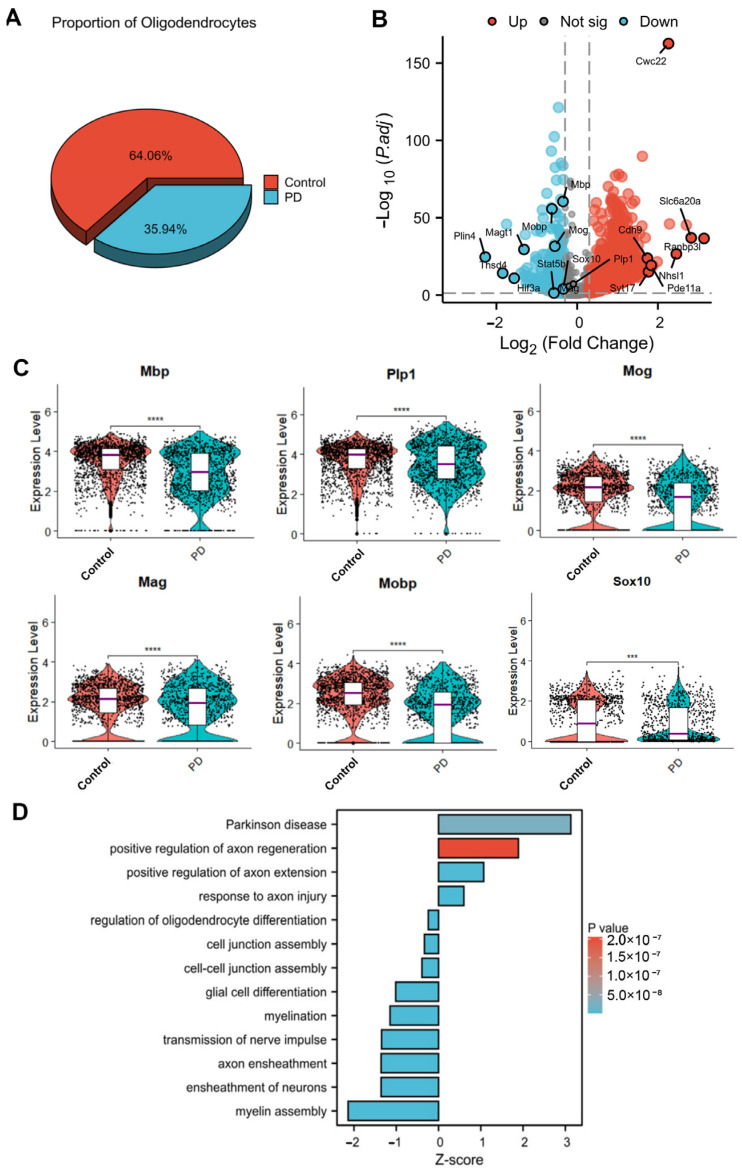
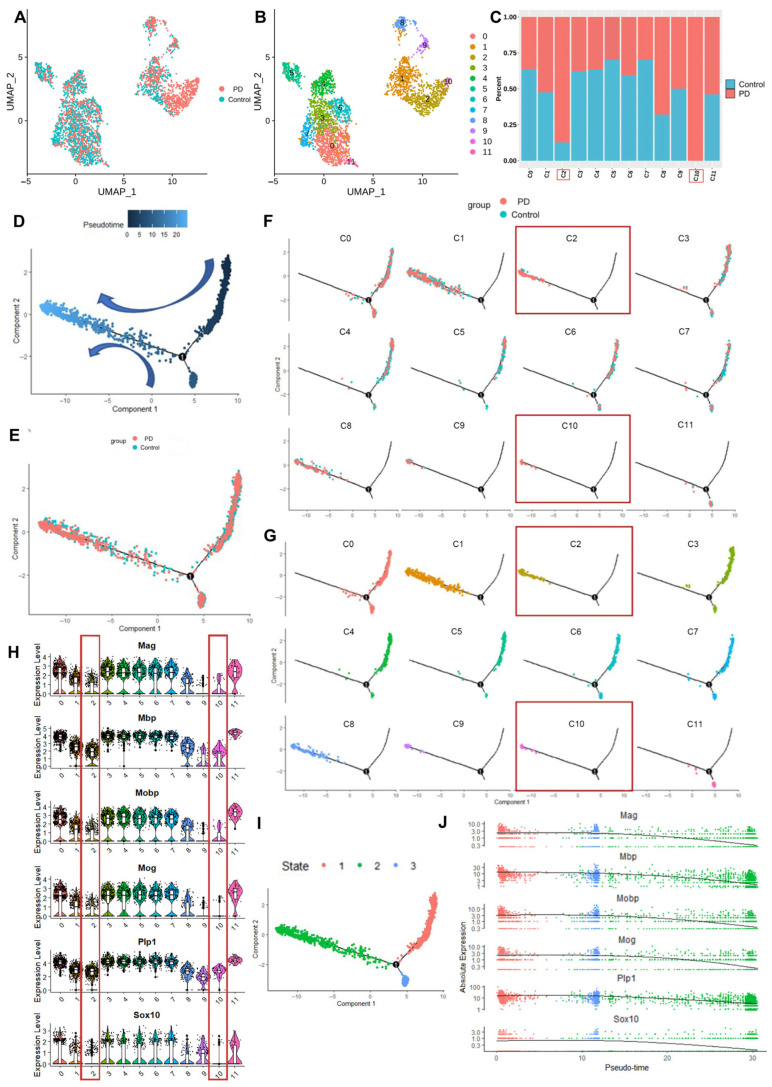
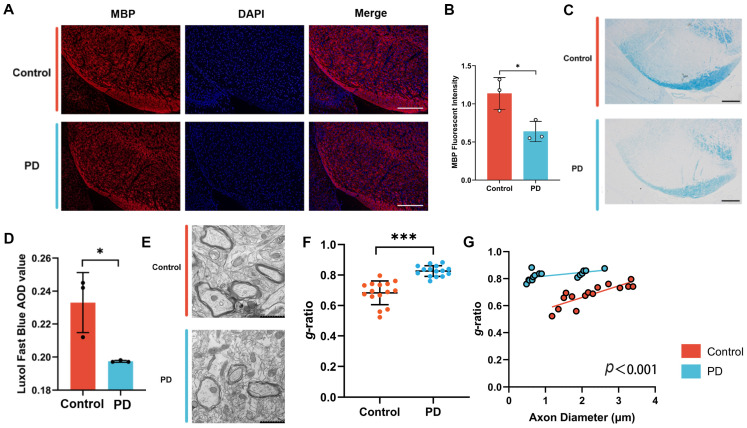
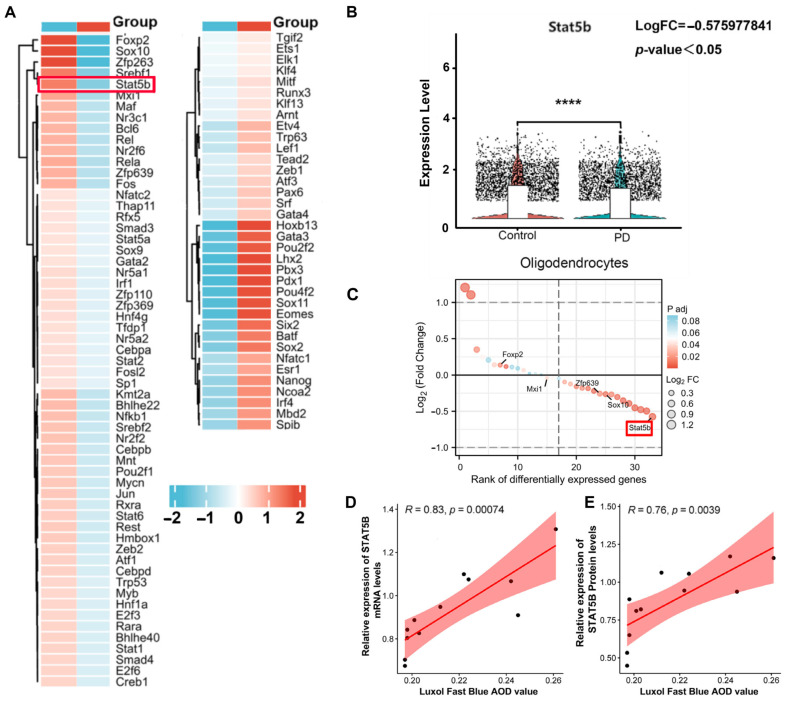
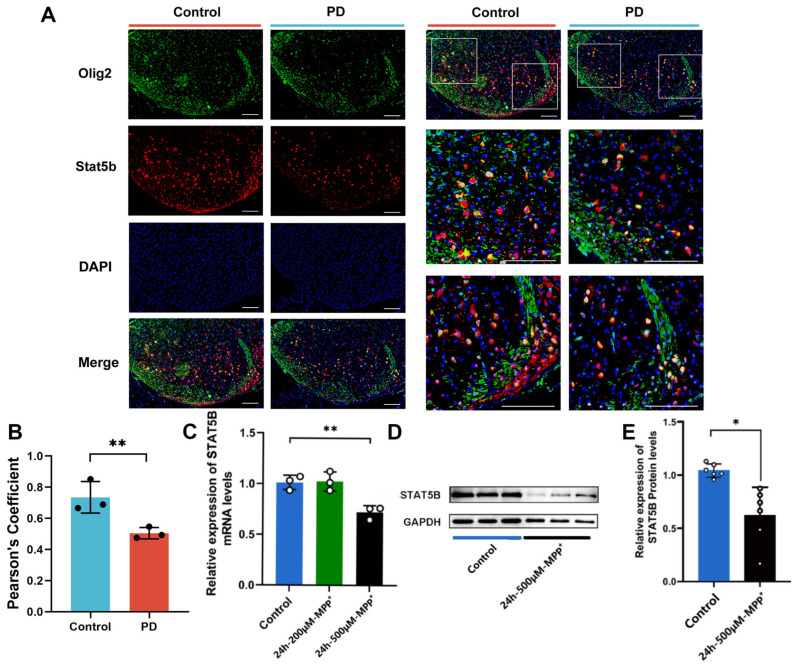
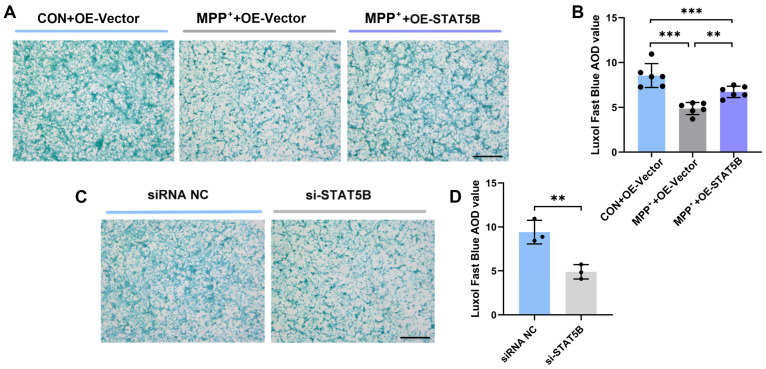
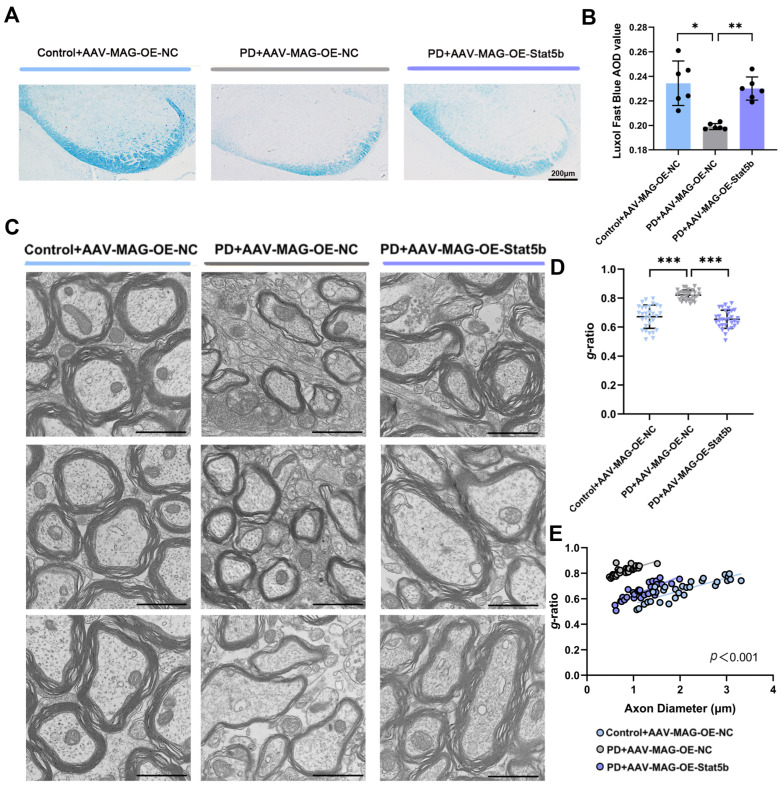
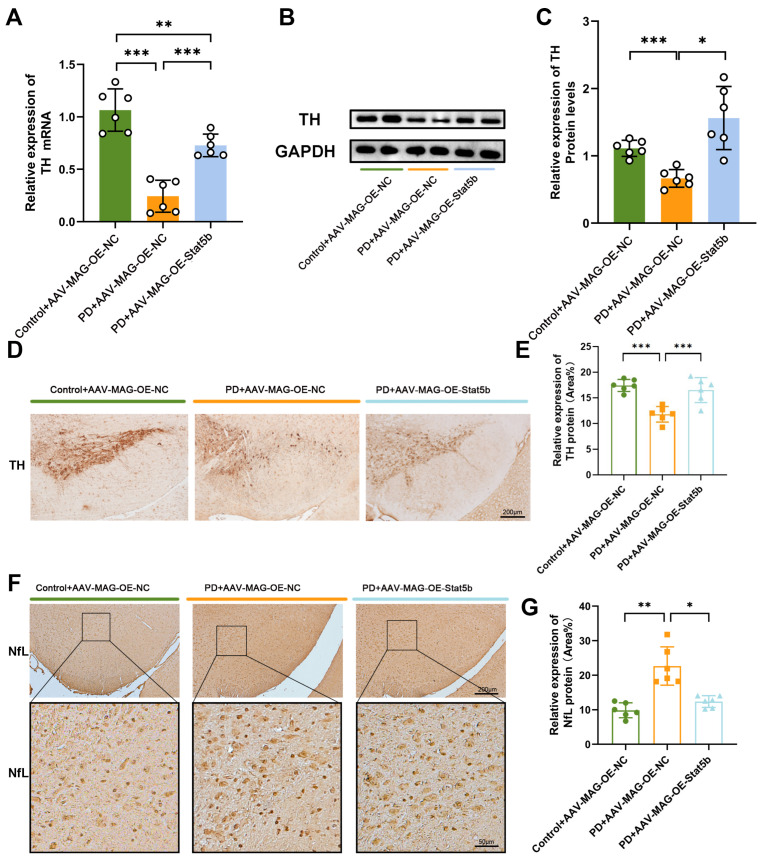
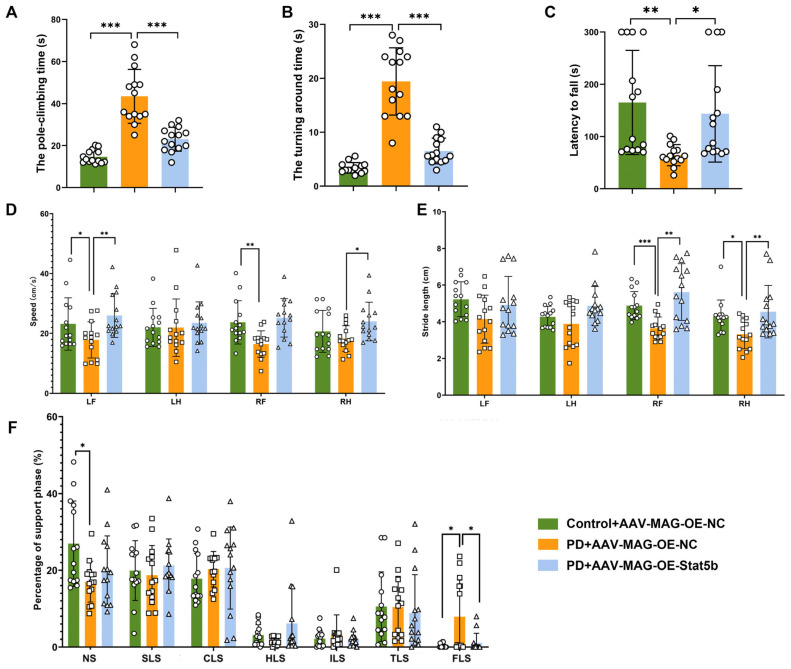
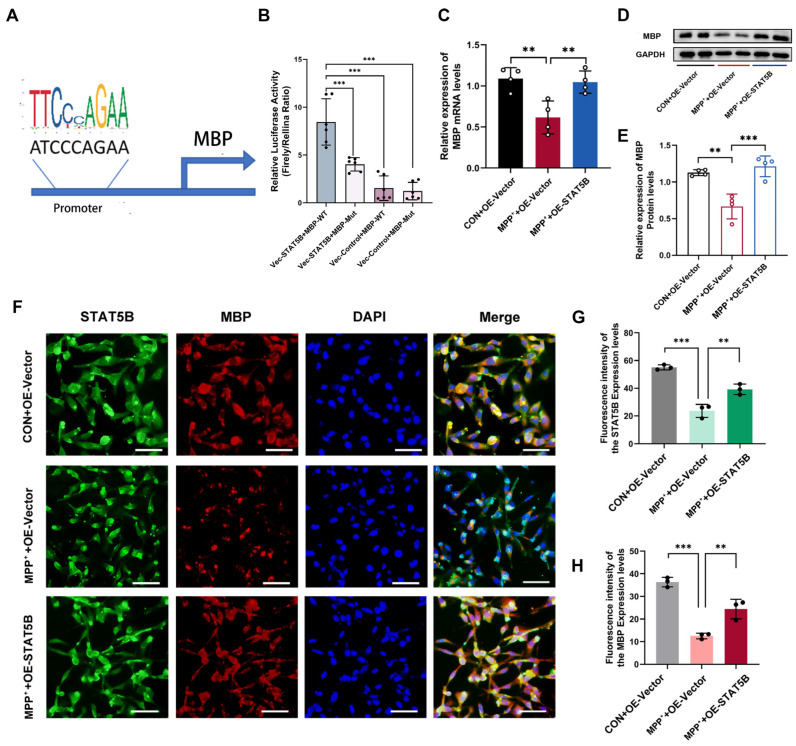
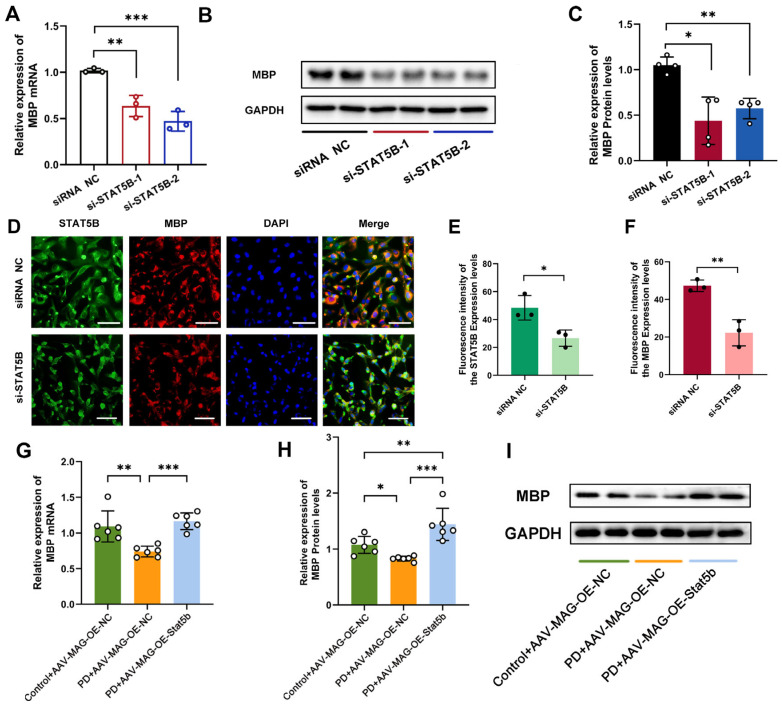
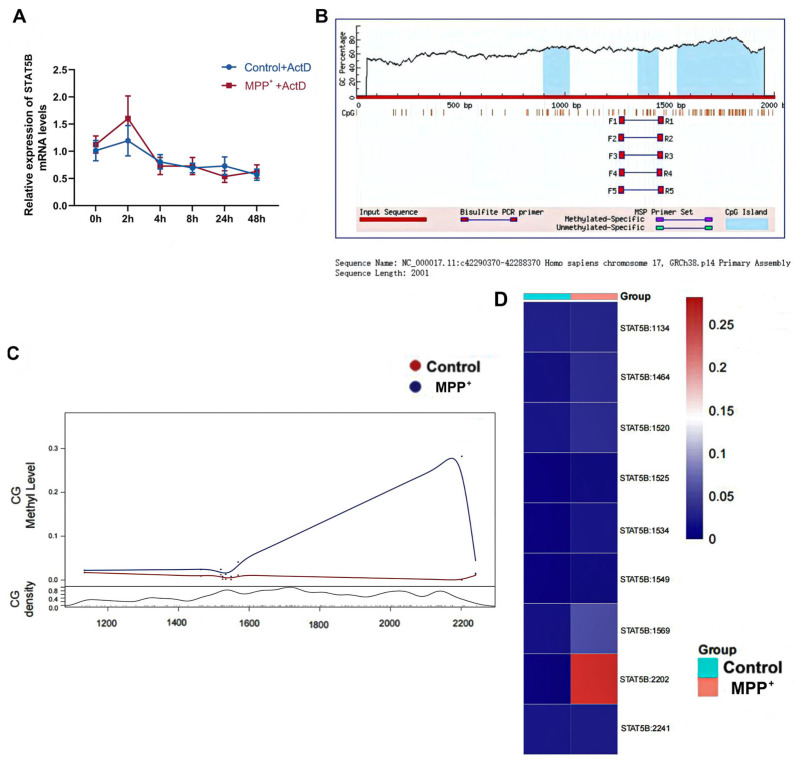
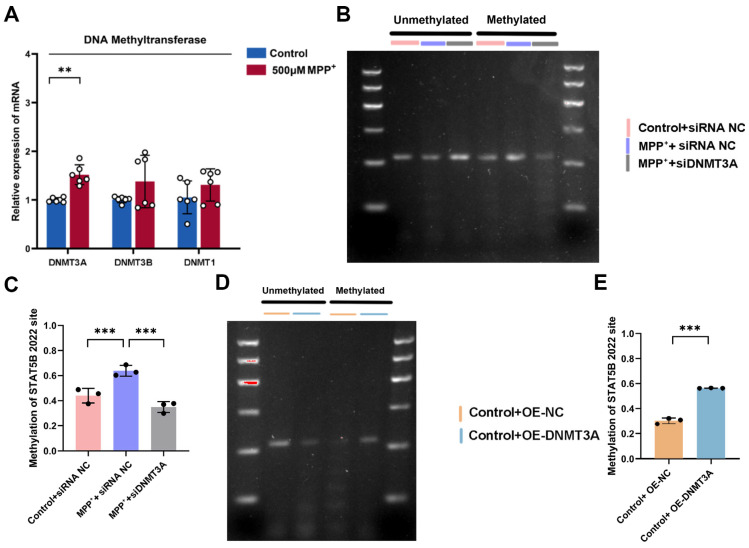
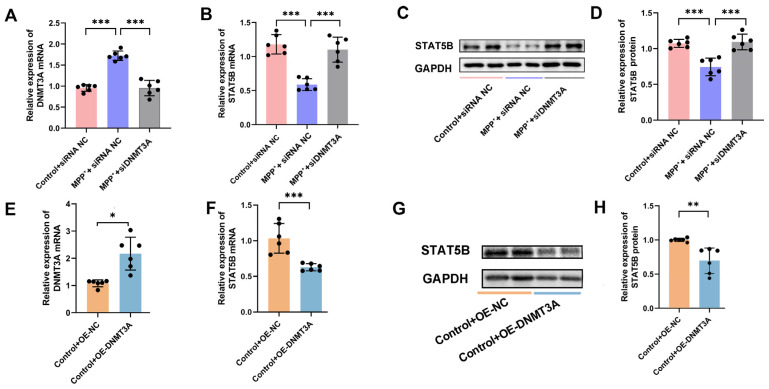
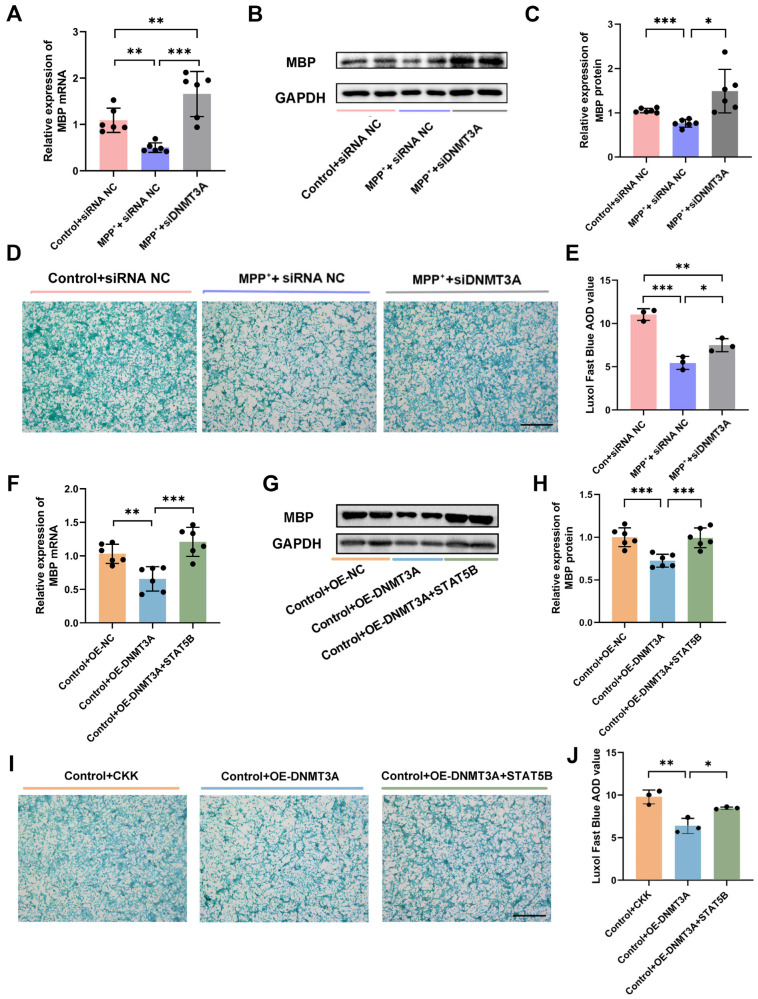
Background: Parkinson's disease (PD) involves progressive dopaminergic neuron degeneration and motor deficits. Oligodendrocyte dysfunction contributes to PD pathogenesis through impaired myelination. Methods: Single-nucleus RNA sequencing (snRNA-seq) of PD mice revealed compromised oligodendrocyte differentiation and STAT5B downregulation. Pseudotemporal trajectory analysis via Monocle2 demonstrated impaired oligodendrocyte maturation in PD oligodendrocytes, correlating with reduced myelin-related gene expression (Sox10, Plp1, Mbp, Mog, Mag, Mobp). DoRothEA-predicted regulon activity identified STAT5B as a key transcriptional regulator. Results: Oligodendrocyte-specific STAT5B activation improved myelin integrity, as validated by Luxol Fast Blue staining and transmission electron microscopy; attenuated dopaminergic neuron loss; and improved motor function. Mechanistically, STAT5B binds the MBP promoter to drive transcription, a finding confirmed by the luciferase assay, while the DNMT3A-mediated hypermethylation of the STAT5B promoter epigenetically silences its expression, as verified by MethylTarget sequencing and methylation-specific PCR. Conclusions: DNMT3A inhibited the expression of STAT5B by affecting its methylation, which reduced the transcription of MBP, caused oligodendrocyte myelin damage, and eventually led to dopamine neuron damage and motor dysfunction in an MPTP-induced mouse model. This DNMT3A-STAT5B-MBP axis underlies PD-associated myelin damage, connecting epigenetic dysregulation with oligodendrocyte dysfunction and subsequent PD pathogenesis.

Keywords: Parkinson’s disease; methylation; myelin sheath; oligodendrocyte; single-nuclear RNA sequencing; substantia nigra.


Conflict of interest statement

The authors declare no conflicts of interest.

Figures

Figure 1
Figure 1
Characterization of the single-nucleus transcriptome profile of oligodendrocytes in the PD model. (A) The proportion of oligodendrocytes in the control group and MPTP-induced model (PD) group in the total oligodendrocyte cluster. (B) Volcano plot of DEGs in oligodendrocytes. (C) Violin plots showing the changes in the expression of myelin-related genes (***, p < 0.001; ****, p < 0.0001). (D) Bar plots of GO and KEGG term enrichment for DEGs in oligodendrocytes.
Figure 2
Figure 2
Molecular characteristics of oligodendrocyte maturation impairment. (A) UMAP embedding of oligodendrocyte nuclei, colored by group (control vs. PD). (B) UMAP embedding of oligodendrocyte nuclei, colored by cluster (11 subclusters). (C) Proportional representation of cells in the 11 subclusters, highlighting that clusters C2 and C10 primarily consist of oligodendrocytes from the PD group. (D) Monocle2 pseudotime analysis of the 11 clusters. (E,F) Time trajectory plots showing disease progression over time in control and PD groups. (G) Time trajectory plot of subclusters, indicating that oligodendrocyte clusters C2 and C10 are at the end of the differentiation trajectory. The C2 and C10 are marked in red rectangular frames. (H) Violin plot of the 11 subclusters, showing the significant downregulation of myelin-related genes in clusters C2 and C10. (I) Division of the time trajectory into three states. (J) Scatter plot demonstrating the dynamic expression of myelin-related genes across the three states.
Figure 3
Figure 3
Myelin in the SN was injured in the MPTP-induced mouse model. (A,B) Immunofluorescence staining reveals a significant reduction in MBP expression levels in the SN of the MPTP-induced mouse model. The results are expressed as the mean ± SD (10× scale bars = 200 μm). Data are presented from male (n = 3) mice, aged 8 weeks. (C,D) Luxol Fast Blue (LFB) staining shows a decrease in myelin density in the SN of the MPTP-induced mouse model. The results are expressed as the mean ± SD (10× scale bars = 200 μm). Data are presented from male (n = 3) mice, aged 8 weeks. (E,F) Transmission electron microscopy (TEM) showed that axonal myelin sheaths were loose, with a reduced thickness and significantly increased g-ratio, in the SN of the MPTP-induced mouse model. The results are expressed as the mean ± SD (5 randomly selected myelinated axons per SN field; 20.0 k× scale bars = 1 μm). Data are presented from male (n = 3) mice, aged 8 weeks. (G) Scatter plot illustrating the individual g-ratio values and the distribution of axonal sizes (*, p < 0.05; ***, p < 0.001).
Figure 4
Figure 4
Discovery and validation of STAT5B as a key regulatory factor. (A) DoRothEA analysis identifies 32 TFs with significantly altered activity in oligodendrocytes in the PD group (12 activated, 20 downregulated). (B) Differential ranking of TFs reveals significant downregulation of STAT5B mRNA in snRNA-seq results (****, p < 0.0001). (C) Violin plot confirms significant decrease in STAT5B expression in oligodendrocytes from the PD group compared to the control group. (D,E) LFB staining shows decreased myelin density correlating with STAT5B mRNA (r = 0.83, p < 0.00074) and protein (r = 0.76, p < 0.0039) expression in the SN of mice.
Figure 5
Figure 5
The expression of STAT5B was significantly reduced in the PD model. (A) Representative image of immunofluorescence staining in the SN of the MPTP-induced mouse model (scale bars = 100 μm). (B) Quantification of co-localization using Pearson’s correlation coefficient (PCC). The y-axis represents the PCC, which quantifies the degree of spatial overlap between the STAT5B and Olig2 signals. PCC values range from −1 to +1, where +1 indicates perfect co-localization, 0 indicates no correlation (random distribution), and -1 indicates perfect segregation. Each data point represents the PCC calculated from individual image fields. The data are presented as the means ± SEMs of 3 independent experiments. Data are presented from male (n = 3) mice, aged 8 weeks. (C) qRT-PCR analysis of STAT5B mRNA expression in MO3.13 cells treated with 200 and 500 μM MPP+ for 24 h. The data are presented as the means ± SEMs of 3 independent experiments. (D,E) Western blot analysis of STAT5B protein expression in MO3.13 cells treated with 500 μM MPP+ for 24 h. The data are presented as the means ± SEMs of 6 independent experiments (*, p < 0.05; **, p < 0.01).
Figure 6
Figure 6
LFB staining of myelin in co-cultures of differentiated MO3.13 cells and SH-SY5Y neuronally differentiated cells. (A,B) LFB staining of STAT5B overexpression in MPP+-treated MO3.13 cells. (C,D) LFB staining of STAT5B knockdown in MO3.13 cells. The results are expressed as the mean ± SD (n = 3; 10× scale bars = 200 μm; **, p < 0.01; ***, p < 0.001).
Figure 7
Figure 7
Overexpression of oligodendrocyte STAT5B improved myelin damage in MPTP-induced mice. (A,B) LFB staining showed that overexpression of oligodendrocyte STAT5B increased myelin density in MPTP-induced mice. The results are expressed as the mean ± SD (10× scale bars = 200 μm). Data are presented from male (n = 6) mice, aged 8 weeks. (C,D) TEM analysis revealed that oligodendrocyte STAT5B overexpression increased axonal myelin thickness and significantly reduced g-ratio in MPTP-treated mice. The results are expressed as the mean ± SD (5 randomly selected myelinated axons per SN field; 20.0 k× scale bars = 1 μm). (E) Scatter plot illustrating the individual g-ratio values and the distribution of axonal sizes. Data are presented from male (n = 3) mice, aged 8 weeks (*, p < 0.05; **, p < 0.01; ***, p < 0.01).
Figure 8
Figure 8
Overexpression of oligodendrocyte STAT5B ameliorated dopamine neuronal damage in MPTP-treated mice. (A) qRT-PCR analysis of TH mRNA expression in the mouse SN. (B) Western blot analysis and (C) quantification of TH protein levels in the mouse SN. (D,E) Immunohistochemical staining of TH protein in the mouse SN. (F,G) Immunohistochemical staining of NfL protein in the mouse SN. The results are expressed as the mean ± SD (10× scale bars = 200 μm; 40× scale bars = 50 μm; *, p < 0.05; **, p < 0.01; ***, p < 0.001). Data are presented from male (n = 6) mice, aged 8 weeks.
Figure 9
Figure 9
Overexpression of oligodendrocyte STAT5B improved motor function in MPTP-treated mice. (A,B) Pole test results showing total time and turn time. (C) Rotarod test results showing fall latency. (DF) Gait analysis results showing movement speed, stride length, and support time. NS: no support, SLS: single-leg support, CLS: contralateral limb support, HLS: homologous limb support, ILS: ipsilateral limb support, TLS: three-limb support, FLS: four-limb support. The results are expressed as the mean ± SD (*, p < 0.05; **, p < 0.01; ***, p < 0.001). Data are presented from male (n = 14) mice, aged 8 weeks.
Figure 10
Figure 10
STAT5B overexpression promoted MBP expression and reduced myelin injury. (A,B) Luciferase reporter assay showing the binding efficiency of STAT5B to the MBP promoter region (n = 6). (CH) In MO3.13 cells overexpressing STAT5B: (C) qRT-PCR and (D,E) Western blot analysis of MBP expression (n = 4). (FH) Immunofluorescently stained STAT5B and MBP expression (n = 3, scale bars = 50 μm). The results are expressed as the mean ± SD (**, p < 0.01; ***, p < 0.001).
Figure 11
Figure 11
Knockdown of STAT5B decreases MBP expression and aggravates myelin damage. (AF) In STAT5B-knockdown MO3.13 cells: (A) qRT-PCR analysis of MBP mRNA expression (n = 4), (B,C) Western blot analysis of MBP protein expression (n = 4), and (DF) immunofluorescently stained STAT5B and MBP expression (n = 3, scale bars = 50 μm). (G) qRT-PCR analysis of MBP mRNA expression in the mouse SN. (H,I) Western blot analysis and quantification of MBP protein levels in the mouse SN. The results are expressed as the mean ± SD (*, p < 0.05; **, p < 0.01; ***, p < 0.001). Data are presented from male (n = 6) mice, aged 8 weeks.
Figure 12
Figure 12
STAT5B mRNA stability and promoter methylation study. (A) Actinomycin D transcription inhibition assay to detect STAT5B mRNA stability. Line chart showing STAT5B mRNA expression at different time points after treatment with actinomycin D. The results are expressed as the mean ± SD (n = 6). (B) The MethPrimer website predicts that there are extensive CpG islands in the promoter region of STAT5B (light blue areas are CpG island regions). (C,D) Top 10 CpG sites with significantly increased methylation in the PD group compared to the control group, as determined by MethylTarget sequencing: (C) MethylTarget sequencing scatter plot—Y-axis: “CG methyl level”, “CG density”; X-axis: methylation site positions. (D) MethylTarget sequencing heatmap—Y-axis: methylation sites; X-axis: groups.
Figure 13
Figure 13
Effects of DNMT3A on methylation levels in the STAT5B promoter region. (A) mRNA expression of DNA methylation-related genes assessed by qRT-PCR (n = 6, **, p < 0.01; ***, p < 0.001). (B,C) Methylation-specific PCR (MSP) analysis of the STAT5B promoter region at site 2202 in DNMT3A-knockdown and MPP+-induced MO3.13 cells. (D,E) MSP analysis of the STAT5B promoter region at site 2202 in DNMT3A-overexpression MO3.13 cells.
Figure 14
Figure 14
DNMT3A knockdown and overexpression affect STAT5B expression. (AD) In DNMT3A-knockdown MO3.13 cells: (AD) qRT-PCR and (C,D) Western blot analysis of STAT5B expression (n = 6). (EH) In MO3.13 cells with DNMT3A overexpression or STAT5B co-overexpression with DNMT3A: (E,F) qRT-PCR analysis of DNMT3A and STAT5B mRNA and (G,H) Western blot analysis of STAT5B protein expression (n = 6). The results are expressed as the mean ± SD (*, p < 0.05; **, p < 0.01; ***, p < 0.001).
Figure 15
Figure 15
DNMT3A-mediated downregulation of MBP via STAT5B in oligodendrocytes. (AE) In DNMT3A-knockdown MO3.13 cells: (AC) qRT-PCR and Western blot analysis of MBP expression (n = 6). (D,E) LFB staining indicates improved myelin integrity in SH-SY5Y neuronally differentiated cells co-cultured with differentiated DNMT3A-knockdown MO3.13 cells (n = 3, scale bars = 200 μm). The results are expressed as the mean ± SD (*, p < 0.05; **, p < 0.01; ***, p < 0.001). (FJ) In MO3.13 cells with DNMT3A and STAT5B co-overexpression: (FH) qRT-PCR and Western blot analysis of MBP expression (n = 6). (I,J) LFB staining shows improved myelin integrity in SH-SY5Y neuronally differentiated cells co-cultured with MO3.13 cells co-overexpressing STAT5B and DNMT3A (n = 3). The results are expressed as the mean ± SD (*, p < 0.05; **, p < 0.01; ***, p < 0.001).

Similar articles

References

    1. Bloem B.R., Okun M.S., Klein C. Parkinson’s disease. Lancet. 2021;397:2284–2303. doi: 10.1016/S0140-6736(21)00218-X. - DOI - PubMed
    1. Armstrong M.J., Okun M.S. Diagnosis and Treatment of Parkinson Disease: A Review. JAMA. 2020;323:548–560. doi: 10.1001/jama.2019.22360. - DOI - PubMed
    1. McTigue D.M., Tripathi R.B. The life, death, and replacement of oligodendrocytes in the adult CNS. J. Neurochem. 2008;107:1–19. doi: 10.1111/j.1471-4159.2008.05570.x. - DOI - PubMed
    1. Fern R. The Leukocentric Theory of Neurological Disorder: A Manifesto. Neurochem. Res. 2017;42:2666–2672. doi: 10.1007/s11064-017-2279-8. - DOI - PubMed
    1. Jung J.H., Kim Y.J., Chung S.J., Yoo H.S., Lee Y.H., Baik K., Jeong S.H., Lee Y.G., Lee H.S., Ye B.S., et al. White matter connectivity networks predict levodopa-induced dyskinesia in Parkinson’s disease. J. Neurol. 2022;269:2948–2960. doi: 10.1007/s00415-021-10883-1. - DOI - PubMed

LinkOut - more resources