. 2025 Jul 25;14(15):1150.
doi: 10.3390/cells14151150.

Long-Term Engraftment and Satellite Cell Expansion from Human PSC Teratoma-Derived Myogenic Progenitors

Affiliations

Long-Term Engraftment and Satellite Cell Expansion from Human PSC Teratoma-Derived Myogenic Progenitors

Zahra Khosrowpour et al. Cells. .

Abstract

Skeletal muscle regeneration requires a reliable source of myogenic progenitor cells capable of forming new fibers and creating a self-renewing satellite cell pool. Human induced pluripotent stem cell (hiPSC)-derived teratomas have emerged as a novel in vivo platform for generating skeletal myogenic progenitors, although in vivo studies to date have provided only an early single-time-point snapshot. In this study, we isolated a specific population of CD82+ ERBB3+ NGFR+ cells from human iPSC-derived teratomas and verified their long-term in vivo regenerative capacity following transplantation into NSG-mdx4Cv mice. Transplanted cells engrafted, expanded, and generated human Dystrophin+ muscle fibers that increased in size over time and persisted stably long-term. A dynamic population of PAX7+ human satellite cells was established, initially expanding post-transplantation and declining moderately between 4 and 8 months as fibers matured. MyHC isoform analysis revealed a time-based shift from embryonic to neonatal and slow fiber types, indicating a slow progressive maturation of the graft. We further show that these progenitors can be cryopreserved and maintain their engraftment potential. Together, these findings give insight into the evolution of teratoma-derived human myogenic stem cell grafts, and highlight the long-term regenerative potential of teratoma-derived human skeletal myogenic progenitors.

Keywords: PAX7; iPS cells; regeneration; satellite cells; skeletal muscle; teratoma; transplantation; xenograft.


Conflict of interest statement

The authors declare no conflicts of interest.

Figures

Figure 1
Figure 1
Scheme outlining the key steps of the study. hiPSCs were injected into TA muscles of NSG mice, and teratomas were harvested two months later. Tissue was digested, and skeletal myogenic progenitor cells co-expressing CD82, ERBB3, and NGFR were sorted by FACS, cultured in vitro, tested for differentiation into myotubes, and, in parallel, transplanted into tibialis anterior (TA) muscles of injured NSG-mdx4Cv mice following X-ray and cardiotoxin injection. TA muscle tissue was harvested at various time points, and stained sections were analyzed with different antibodies to assess human cell contribution, muscle regeneration, and fiber type differentiation.
Figure 2
Figure 2
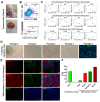
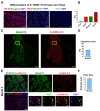
(A) Morphology of teratomas formed in TA muscles of NSG mice two months after injection of hiPSCs. (B) Isolation of skeletal myogenic progenitor cells co-expressing CD82, ERBB3, and NGFR by FACS from TA teratomas. (C) Expression levels of various myogenic and fibroblastic markers under different growth factor conditions, as determined by RNA sequencing, presenting mean ratio normalized counts. (D) Morphology of isolated skeletal myogenic cells cultured at different passages. PAX7 staining of cells in the proliferative phase at confluency, from the same passage used for transplantation. (E) MyoD, Myogenin, MF-20, and PAX7 staining of teratoma-derived skeletal myogenic cells in differentiation medium at passage 3, highlighting their capacity to form myotubes. (F) Percentage of cells positive for PAX7 in proliferative and differentiation media, and for MyoD, Myogenin, and MF-20 in differentiation medium. Data were obtained from five fields per sample across three replicates.
Figure 3
Figure 3
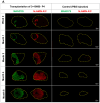
(A) Engraftment and muscle size over time, showing both human Dystrophin (MANDYS), which marks fibers, and human-specific Lamin A/C, which marks all human nuclei. Representative images were captured at various time points to assess engraftment in TA muscle sections. The engraftment area was measured relative to the total tissue area in each section. The engrafted area increased progressively over time, reflecting enhanced tissue integration. In contrast, the control group, irradiated and injected with PBS, exhibited a consistent decrease in muscle area, indicating atrophy. The transplanted group, however, maintained stable muscle size, demonstrating the ability of the transplanted cells to preserve muscle integrity and prevent degeneration throughout the study period. Scale bar = 500 µm. (B) Morphological changes in the TA muscle over time. (C) The percentage of the engrafted area relative to the total TA size at each time point (p < 0.0001). (D) Quantification of the total TA CSA over time (p < 0.0001).
Figure 3
Figure 3
(A) Engraftment and muscle size over time, showing both human Dystrophin (MANDYS), which marks fibers, and human-specific Lamin A/C, which marks all human nuclei. Representative images were captured at various time points to assess engraftment in TA muscle sections. The engraftment area was measured relative to the total tissue area in each section. The engrafted area increased progressively over time, reflecting enhanced tissue integration. In contrast, the control group, irradiated and injected with PBS, exhibited a consistent decrease in muscle area, indicating atrophy. The transplanted group, however, maintained stable muscle size, demonstrating the ability of the transplanted cells to preserve muscle integrity and prevent degeneration throughout the study period. Scale bar = 500 µm. (B) Morphological changes in the TA muscle over time. (C) The percentage of the engrafted area relative to the total TA size at each time point (p < 0.0001). (D) Quantification of the total TA CSA over time (p < 0.0001).
Figure 4
Figure 4
(A) Morphology of muscle fibers in transplanted muscles over time. Fiber diameter progressively increased from week 2 through month 4, stabilizing by month 8. These results indicate significant growth up to month 4, followed by a plateau, suggesting sustained muscle regeneration and maturation driven by the transplanted cells. Scale bar = 100 µm. (B) Average size (diameter) of engrafted fibers at various time points (p < 0.0001).
Figure 5
Figure 5
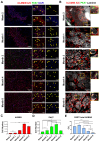
(A) PAX7-positive satellite cells in transplanted TA muscles are shown at various time points. Double staining with hLamin A/C and DAPI confirms their human origin and nuclear localization. Yellow arrowheads denote cells positive for PAX7, hLamin A/C, and DAPI staining. Scale bar = 100 µm. (B) Double staining with human Lamin A/C, PAX7, and laminin revealed PAX7-positive cells located beneath the basal lamina of newly formed muscle fibers at all time points. However, due to the small size of the fibers at week 2, this localization is less obvious. Scale bar = 50 µm. (C) Number of human Lamin A/C-positive cells (hLMNA) at different time points (p < 0.0001). (D) The number of human PAX7-positive cells per section was quantified over time. All PAX7-positive cells were confirmed to be double-positive for human Lamin A/C at the time of counting (p < 0.0001). (E) Percentage of human PAX7-positive cells relative to total hLamin A/C-positive cells at various time points (p < 0.0001).
Figure 6
Figure 6
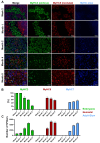
(A) MyHC isoform expression over time in transplanted fibers. Scale bar = 100 µm. (B) Percentage of newly formed fibers of each fiber type across time points (p < 0.0001). (C) Total number of newly formed fibers of each fiber type across time points (p < 0.0001). At two weeks post-transplantation, all fibers exclusively expressed embryonic MyHC3. By one month, MyHC3 remained predominant. At two months, a subset began expressing neonatal MyHC8 and MyHC-slow, indicating partial maturation. By four months, most fibers expressed neonatal MyHC8 and MyHC-slow, with reduced embryonic MyHC3. At eight months, neonatal MyHC8 and MyHC-slow dominated, with minimal embryonic MyHC3, reflecting sustained maturation.
Figure 7
Figure 7
(A) MyoD, Myogenin, MF-20, and PAX7 staining of frozen and later thawed teratoma-derived skeletal myogenic cells in differentiation medium at passage 4. Scale bar = 100 µm. (B) Percentage of cells positive for PAX7, MyoD, Myogenin, and MF-20 in differentiation medium. Data were obtained from five fields per sample across three replicates. (C) Engraftment of frozen and later thawed teratoma-derived skeletal myogenic cells analyzed after three months, showing both human Dystrophin (MANDYS), which marks fibers, and human-specific Lamin A/C, which marks all human nuclei. Representative images were captured to assess engraftment in TA muscle sections. Scale bar = 500 µm. (D) The percentage of the engrafted area relative to the total TA size. (E) hDystrophin+ fibers and PAX7+ cells in the engrafted area, the human origin double-confirmed by co-staining with hLamin A/C. Yellow arrowheads denote cells positive for PAX7, hLamin A/C, and DAPI staining. Scale bar = 100 µm. (F) Average size (diameter) of engrafted fibers. (G) Number of human PAX7, hLamin A/C-positive cells (hLMNA). (H) Percentage of human PAX7-positive cells relative to total hLamin A/C-positive cells.
Figure 7
Figure 7
(A) MyoD, Myogenin, MF-20, and PAX7 staining of frozen and later thawed teratoma-derived skeletal myogenic cells in differentiation medium at passage 4. Scale bar = 100 µm. (B) Percentage of cells positive for PAX7, MyoD, Myogenin, and MF-20 in differentiation medium. Data were obtained from five fields per sample across three replicates. (C) Engraftment of frozen and later thawed teratoma-derived skeletal myogenic cells analyzed after three months, showing both human Dystrophin (MANDYS), which marks fibers, and human-specific Lamin A/C, which marks all human nuclei. Representative images were captured to assess engraftment in TA muscle sections. Scale bar = 500 µm. (D) The percentage of the engrafted area relative to the total TA size. (E) hDystrophin+ fibers and PAX7+ cells in the engrafted area, the human origin double-confirmed by co-staining with hLamin A/C. Yellow arrowheads denote cells positive for PAX7, hLamin A/C, and DAPI staining. Scale bar = 100 µm. (F) Average size (diameter) of engrafted fibers. (G) Number of human PAX7, hLamin A/C-positive cells (hLMNA). (H) Percentage of human PAX7-positive cells relative to total hLamin A/C-positive cells.

References

    1. Seale P., Ishibashi J., Scimè A., Rudnicki M.A. Pax7 Is Necessary and Sufficient for the Myogenic Specification of CD45+: Sca1+ Stem Cells from Injured Muscle. PLoS Biol. 2004;2:E130. doi: 10.1371/journal.pbio.0020130. - DOI - PMC - PubMed
    1. Mauro A. SATELLITE CELL OF SKELETAL MUSCLE FIBERS. J. Biophys. Biochem. Cytol. 1961;9:493–495. doi: 10.1083/jcb.9.2.493. - DOI - PMC - PubMed
    1. Günther S., Kim J., Kostin S., Lepper C., Fan C.M., Braun T. Myf5-Positive Satellite Cells Contribute to Pax7-Dependent Long-Term Maintenance of Adult Muscle Stem Cells. Cell Stem Cell. 2013;13:590–601. doi: 10.1016/j.stem.2013.07.016. - DOI - PMC - PubMed
    1. Von Maltzahn J., Jones A.E., Parks R.J., Rudnicki M.A. Pax7 Is Critical for the Normal Function of Satellite Cells in Adult Skeletal Muscle. Proc. Natl. Acad. Sci. USA. 2013;110:16474–16479. doi: 10.1073/pnas.1307680110. - DOI - PMC - PubMed
    1. Murach K.A., White S.H., Wen Y., Ho A., Dupont-Versteegden E.E., McCarthy J.J., Peterson C.A. Differential Requirement for Satellite Cells during Overload-Induced Muscle Hypertrophy in Growing versus Mature Mice. Skelet Muscle. 2017;7:14. doi: 10.1186/s13395-017-0132-z. - DOI - PMC - PubMed

LinkOut - more resources