. 2025 Jul 31;14(15):1185.
doi: 10.3390/cells14151185.

Structure of the Secretory Compartments in Goblet Cells in the Colon and Small Intestine

Affiliations

Structure of the Secretory Compartments in Goblet Cells in the Colon and Small Intestine

Alexander A Mironov et al. Cells. .

Abstract

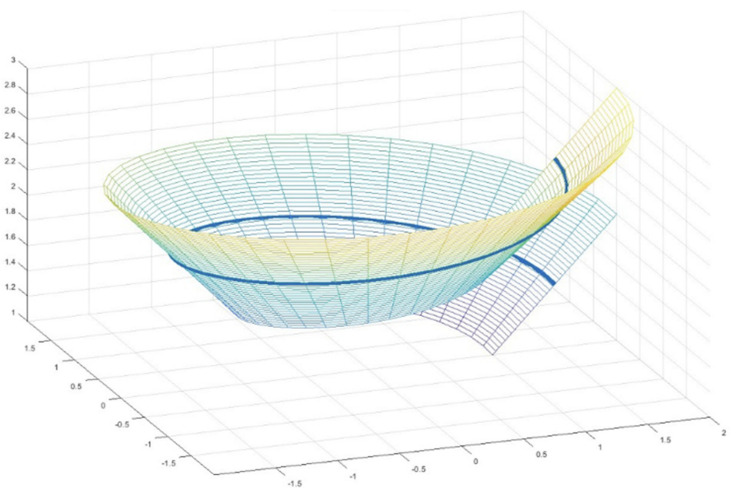
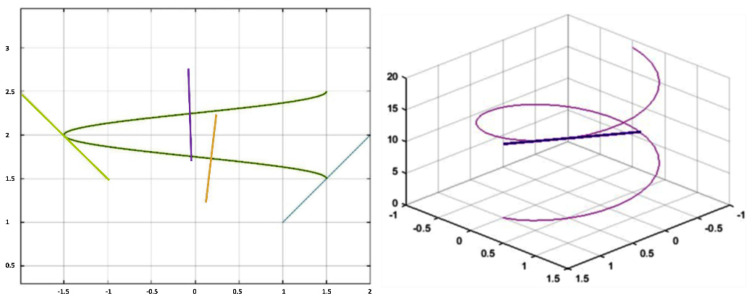
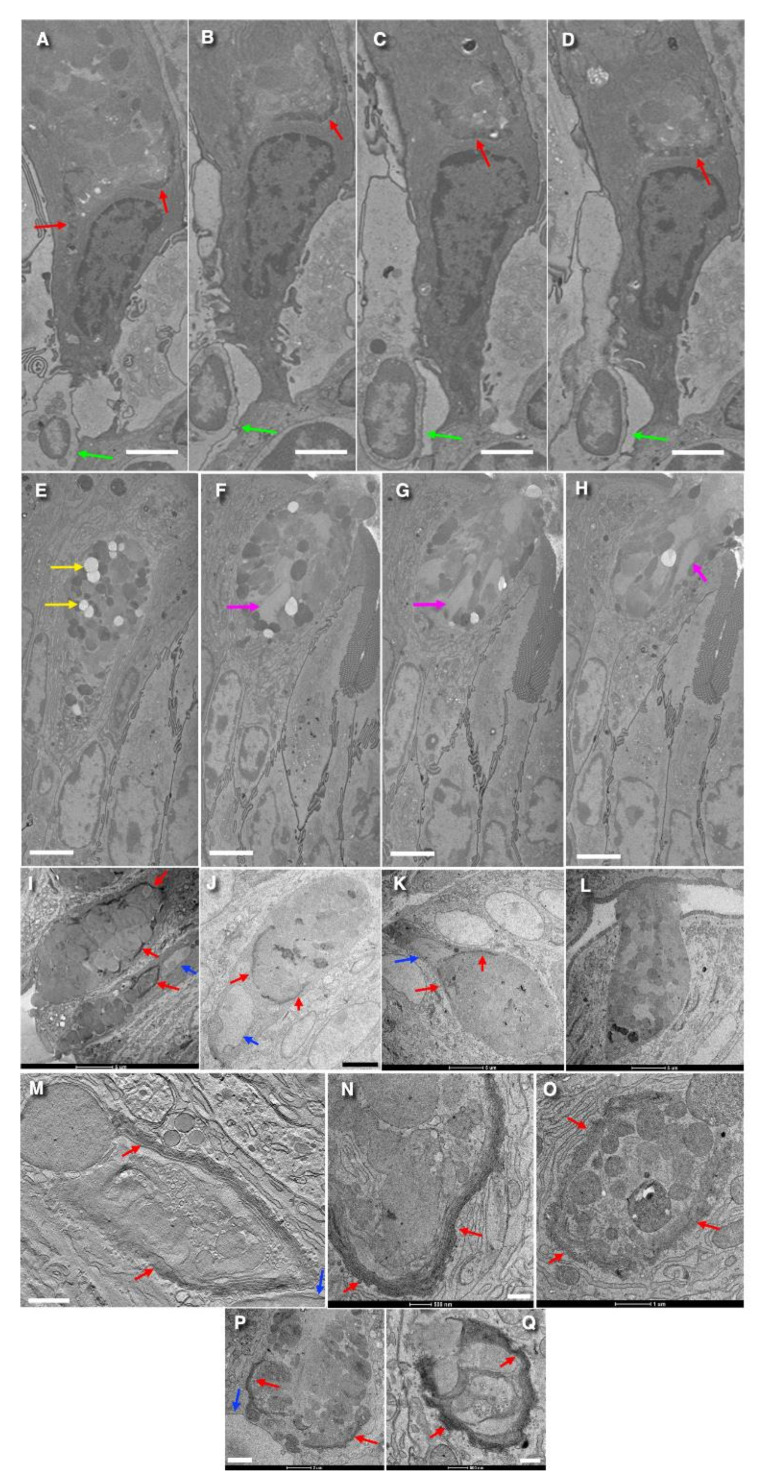
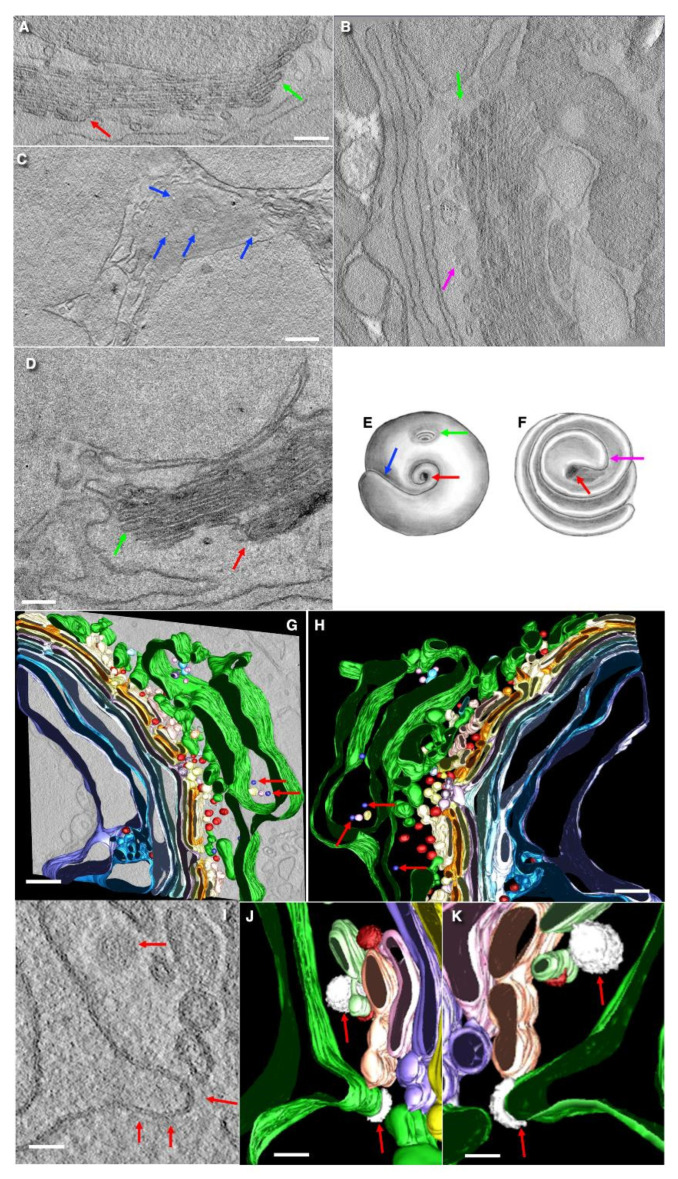
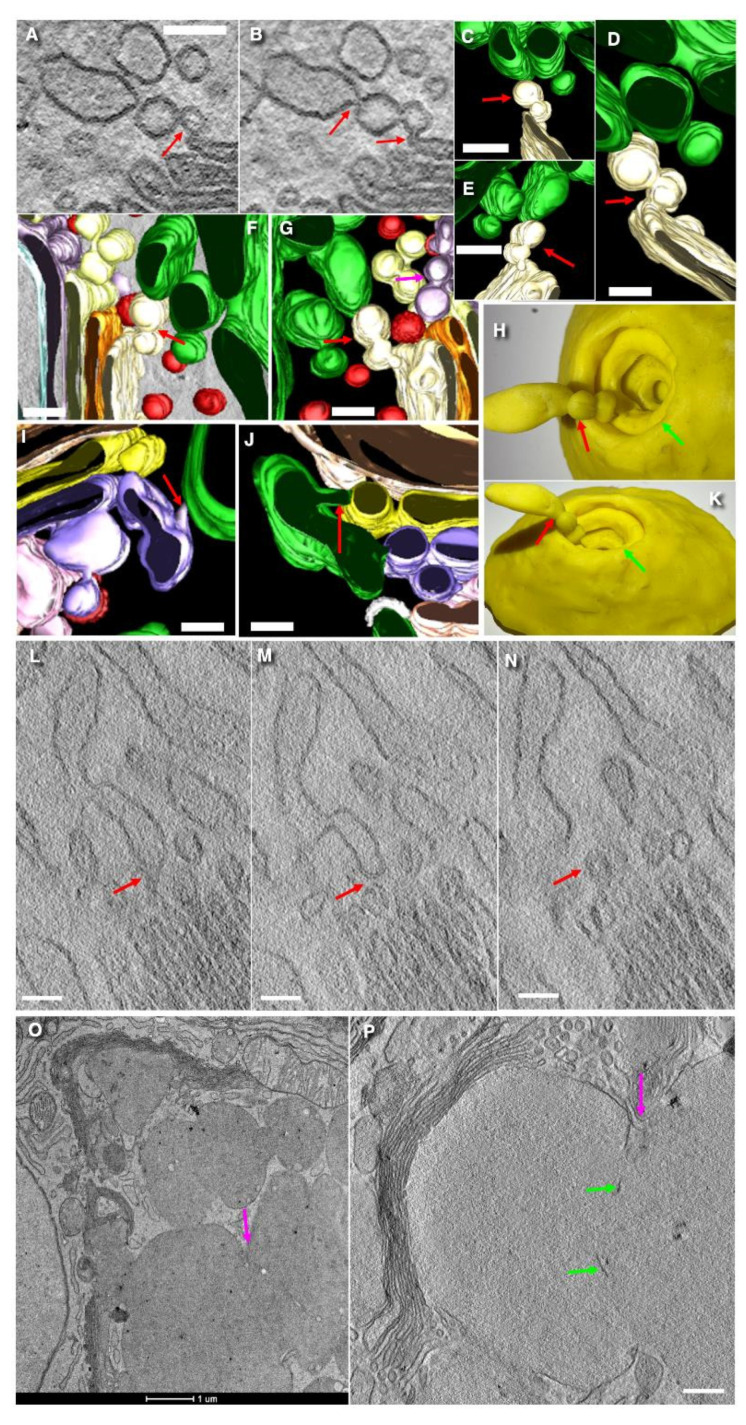
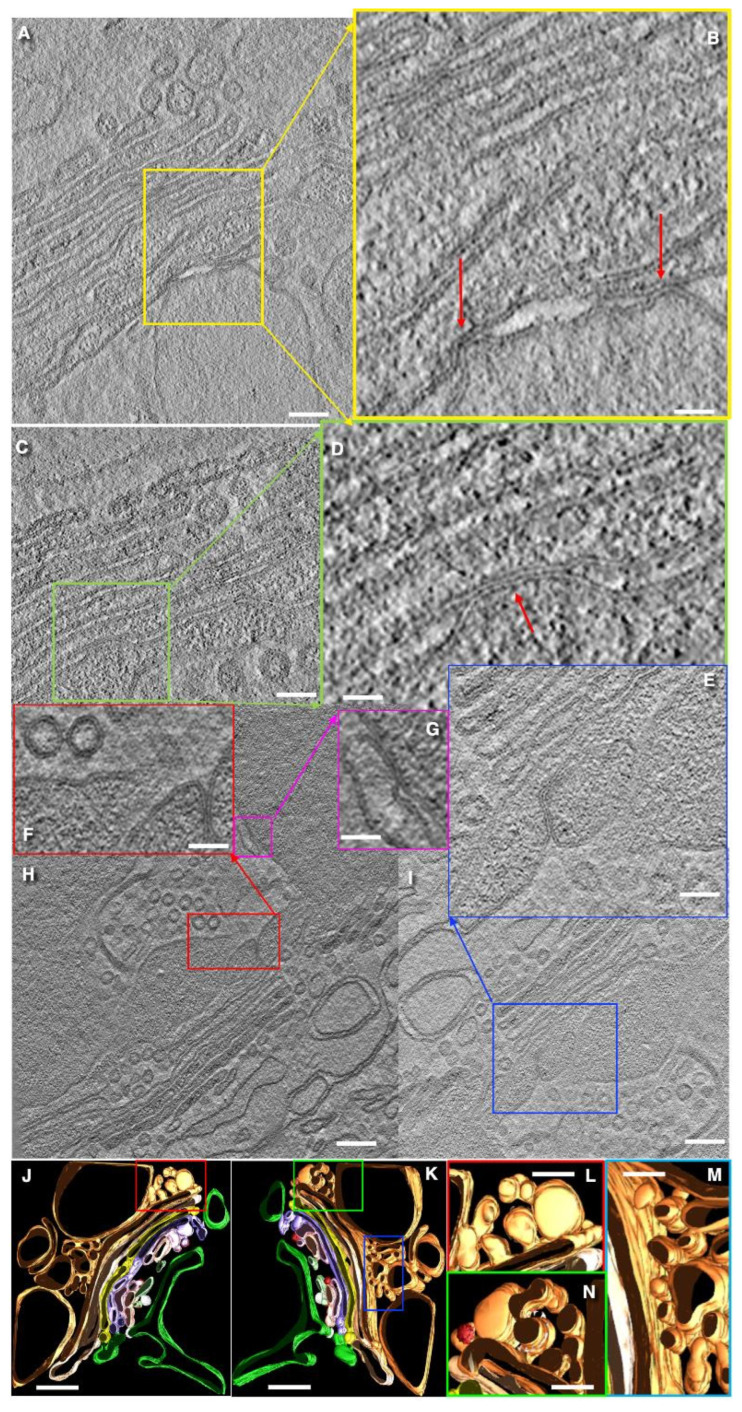
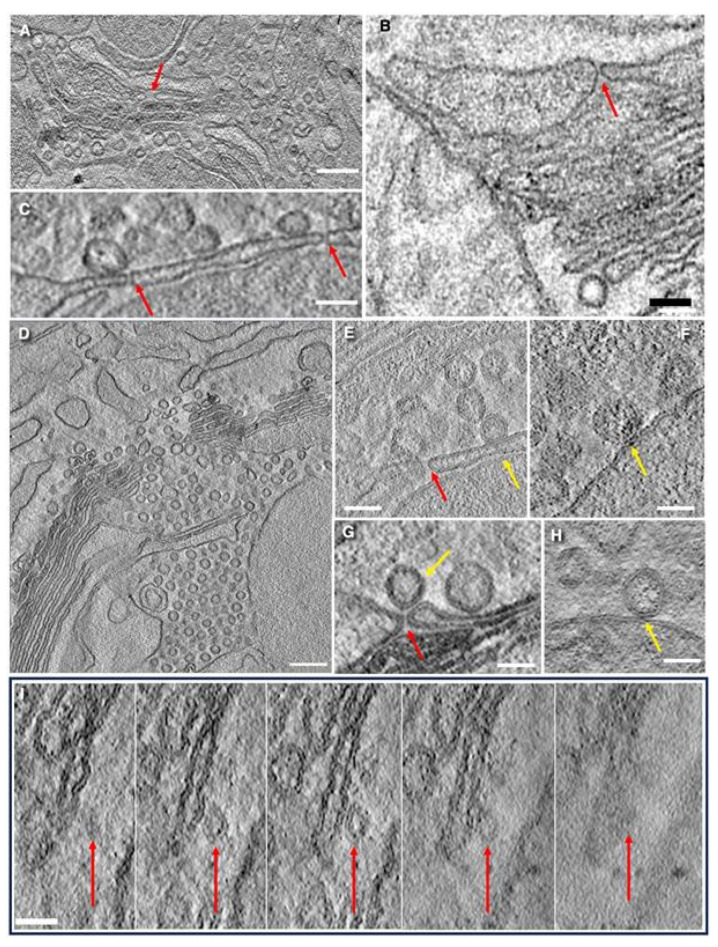
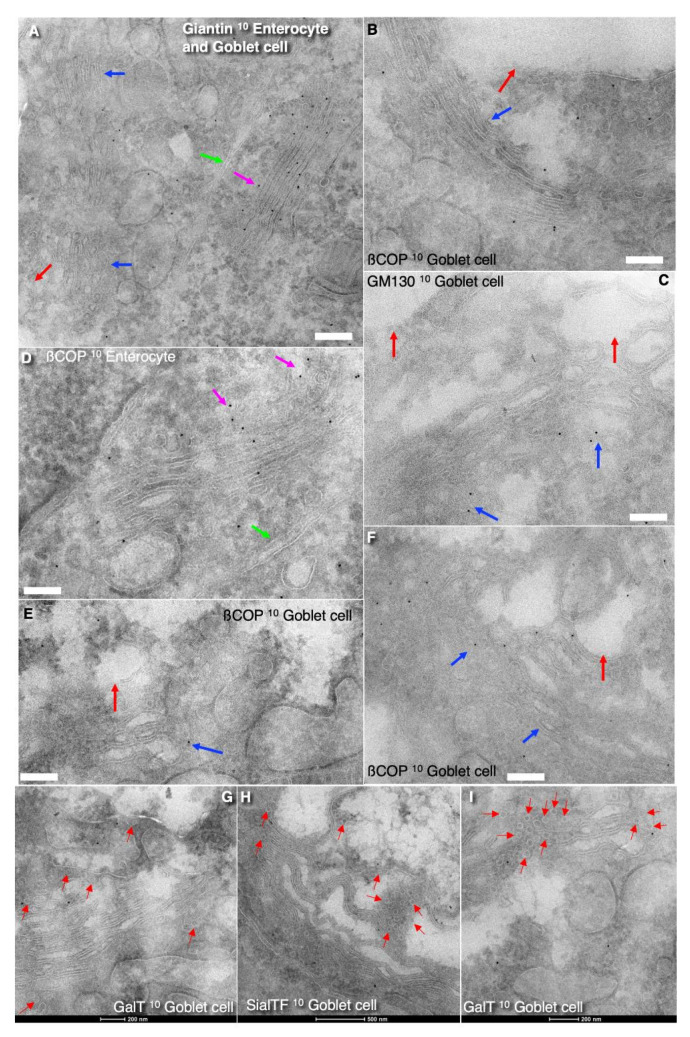
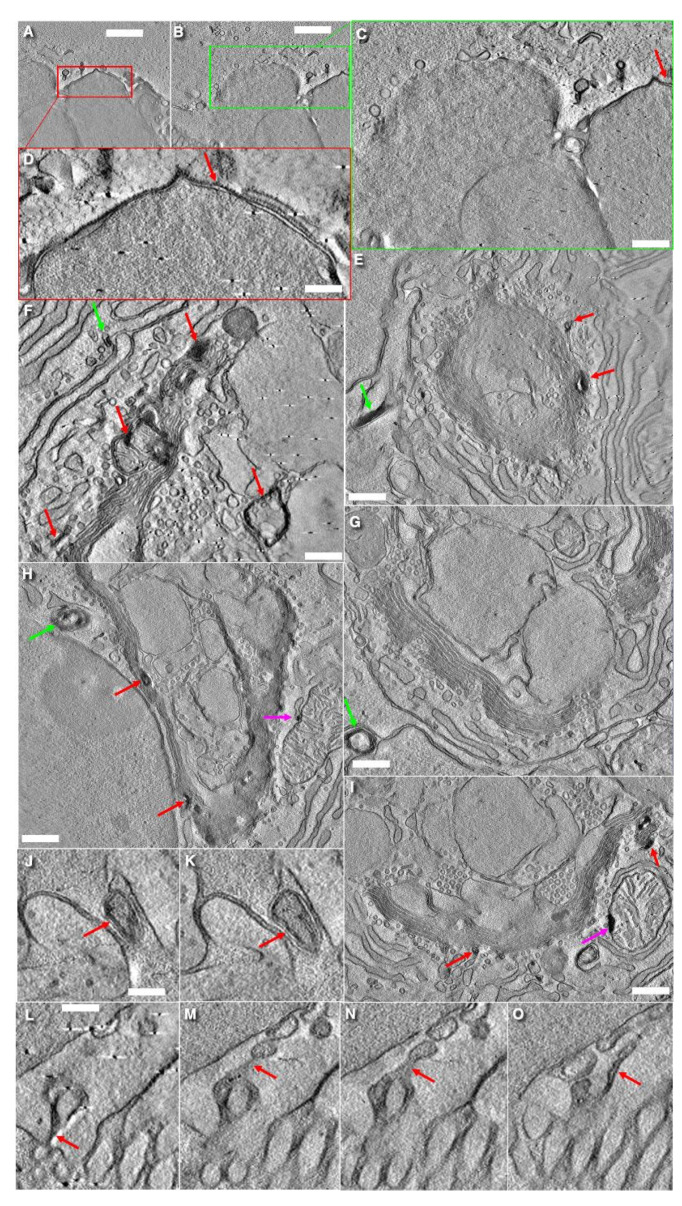
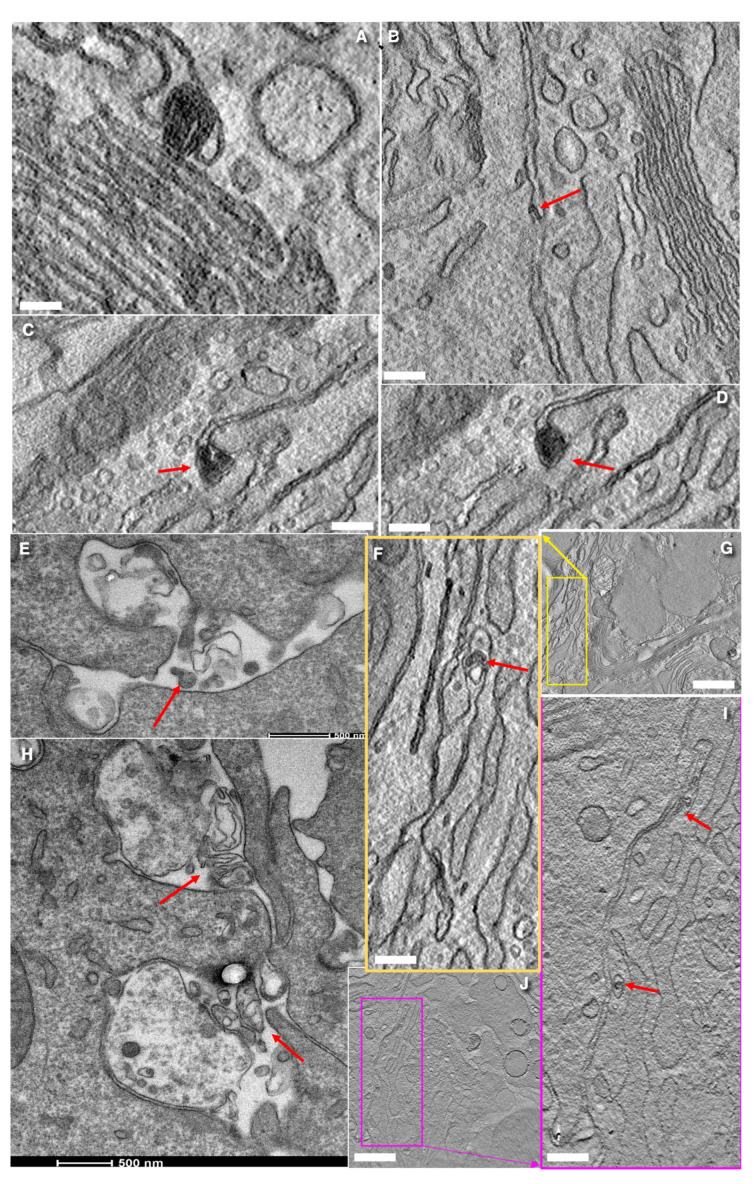
The Golgi of goblet cells represents a specialized machine for mucin glycosylation. This process occurs in a specialized form of the secretory pathway, which remains poorly examined. Here, using high-resolution three-dimensional electron microscopy (EM), EM tomography, serial block face scanning EM (SBF-SEM) and immune EM we analyzed the secretory pathway in goblet cells and revealed that COPII-coated buds on the endoplasmic reticulum (ER) are extremely rare. The ERES vesicles with dimensions typical for the COPII-dependent vesicles were not found. The Golgi is formed by a single cisterna organized in a spiral with characteristics of the cycloid surface. This ribbon has a shape of a cup with irregular perforations. The Golgi cup is filled with secretory granules (SGs) containing glycosylated mucins. Their diameter is close to 1 µm. The cup is connected with ER exit sites (ERESs) with temporal bead-like connections, which are observed mostly near the craters observed at the externally located cis surface of the cup. The craters represent conus-like cavities formed by aligned holes of gradually decreasing diameters through the first three Golgi cisternae. These craters are localized directly opposite the ERES. Clusters of the 52 nm vesicles are visible between Golgi cisternae and between SGs. The accumulation of mucin, started in the fourth cisternal layer, induces distensions of the cisternal lumen. The thickness of these distensions gradually increases in size through the next cisternal layers. The spherical distensions are observed at the edges of the Golgi cup, where they fuse with SGs and detach from the cisternae. After the fusion of SGs located just below the apical plasma membrane (APM) with APM, mucus is secreted. The content of this SG becomes less osmiophilic and the excessive surface area of the APM is formed. This membrane is eliminated through the detachment of bubbles filled with another SG and surrounded with a double membrane or by collapse of the empty SG and transformation of the double membrane lacking a visible lumen into multilayered organelles, which move to the cell basis and are secreted into the intercellular space where the processes of dendritic cells are localized. These data are evaluated from the point of view of existing models of intracellular transport.

Keywords: ER exit site; Golgi complex; Mucin; diffusion model; goblet cell; intracellular transport; kiss-and-run model; multilamellar organelle; regulation secretion; secretory granule.


Conflict of interest statement

The authors declare no conflicts of interest.

Figures

Figure A1
Figure A1
Helicoid and helix: for every point on the helicoid there is a helix contained in the helicoid, which passes through that point.
Figure A2
Figure A2
Straight line rotating and translating around the helix (left). X/Z plane—rototranslation of a straight line along a helix (right).
Figure 1
Figure 1
Structure of the Golgi in goblet cells in the jejunum (AD,P,Q) and colon (EH,IO). Representative examples of images made with the routine TEM sections (IQ), 3VIEW or serial block face (AH), and EM tomography (M). (AD) Serial 3VIEW images of goblet cells contacting with dendritic cells (green arrows). Red arrows show different shapes of the Golgi in different vertical sections. (EH) Serial 3VIEW images of the goblet cells in the colon containing secretory granules of different types including empty (yellow arrows) and very long ones (purple arrows). (IQ) Different shapes of the Golgi cup (red arrows) in different goblet cells. (L) Massive secretion of mucin from the Goblet cells. (J,L) Nuclei (blue arrows) are below the “Golgi cup”. (M) Blue arrow (to the right) shows the nucleus below the Golgi cup. (O) Secretory granules in resting goblet cells are separated from each other. Red arrows indicate the different shapes of the Golgi apparatus (dark structures in (AD,IK,MQ)). Green arrows show dendritic cells (in (AD)). Yellow arrows indicate the “empty” SGs attached to each other (in (E)). Purple arrows demonstrate elongated SGs with the length up to 4 µm (in (FH)). Blue arrows show the nuclei just below the Golgi cups (in (IK,M,P)). The edge of the Golgi cup (red arrow) with three initial osmiophilic cisternal layers. Green arrows in subfigures (AD) show dendritic cells; Purple arrows in subfigures (FH) show large SGs; Yellow arrows in subfigures (E) show empty SGs; Red arrows in subfigures (AD,IK,MQ) show the Golgi; Blue arrows in subfigures (IK,M,P) show nuclei. Scale bars: 4 µm (AH,I,K,L); 5 µm (J); 2 µm (M,P); 500 nm (N,Q); In Figures (I,K,L,NQ), the length of bars is also indicated directly below images.
Figure 2
Figure 2
Structure of the Golgi in goblet cells. Tomographic images (AD,I) and three-dimensional reconstructions (G,H,J,K). (A,B,D) Structure of the upper edges (green arrows) of the Golgi cup. Low development of the COPI-coated buds. (A) The first cistern (layer) on the external surface is indicated with the red arrow. (B) The first three cisternae (green arrow) on the external surface are more osmiophilic than the next Golgi cisternae. Purple arrow indicates the most cis-cisterna. (C). Tangential section of the Golgi cisternae. Rare narrow pores (blue arrows) are visible. (D) The red arrow shows the initial layer of the Golgi spiral. The upper edges of the Golgi spiral cup is indicated with the green arrow. (E,F) Scheme of the Golgi cup. The blue arrow shows the beginning of the Golgi spiral. The blue arrow shows the beginning of the cisternal spiral. The purple arrow shows the end part of the spiral. Red arrows show the point of rotation (see Figure S4(iD–iH)). (G,H) Three-dimensional reconstruction (3D) of the Golgi ribbon. Green color indicates the ER. Blue color demonstrates cisternal distensions filled with mucins and secretory granules. In (G,H) blue small spheres (red arrows) near the ER have a diameter of 42 nm. Other spheres near the ER and near blue spheres have diameters equal to 50 nm. (IK) COPII-coated buds (white structures) on the ER cisternae. Red color indicated COPI-dependent vesicles. Other colors demonstrate Golgi cisternae. (I) Red arrows show COPII-like coat. (J,K) Red arrows indicate COPII-coat. Structures colored in red indicates COPI-coated bud. Scale bars: 172 nm (A,B,D,G,H); 275 nm (C); 82 nm (IK).
Figure 3
Figure 3
Three-dimensional reconstruction of the outer pole of the Golgi in goblet cells. (AK) ER-Golgi connections. (A,B) Serial tomography slices show bead-like connections (red arrows) between the ER and the Golgi cisterna within the crater. (CE) The connection is shown from different sides of view. Green color indicates the ER. (F,G) Red smooth spheres are the 52-nm vesicles. Red structures with rough surface are COPI coated buds. (F,G) The connection (red arrows) shown within the entire 3D model without elimination of cisternae from opposite side of view. (G) The purple color shows another example of the bead-like connection (red arrows). (H,K) The plasticine model of these connections (red arrows) within the crater (green arrows). (I,J) Examples of connections (red arrows) between the ER (green color) and Golgi compartments (violet to the left and yellow to the right). (LN) Serial tomo-images of the connection between the ER and the Golgi existing within the rim of the Golgi cup edge. Red arrows show its way from one membrane to another. (O,P) Fusion of SGs (purple arrows). Green arrows indicate the remnants of membranes inside newly formed large SG. Scale bars (nm): 75 nm (A,B); 80 (C,D); 60 (E); 70 (F,G,LN); 50 (I,J); 1000 ((O); below the image); 280 (P).
Figure 4
Figure 4
Close contacts (red arrows) between cisternae and between secretory granules and cisternae. (AI) Membranes of Golgi cisternae and SG are tightly attached to each other and form a contact composed of five layers (or three dark layers). (JM) The 3D reconstruction of the Golgi ribbon in goblet cells. View from different sides. Green color indicates the ER. Here, we have two seemingly similar but not the same images. The image (H) and image (I) are serial images take from two tomograms obtained after rotation of the same sample in the microscope of 90 degrees in order to obtain the double tilt tomogram. However, this peculiar contact structure composed of three dark lines was more visible in these separated tomograms, and these serial images were used for the illustration. (LM) Enlarged areas inside the red, green, and blue boxes in (J,K). The panel (N) represents a full image. In (N), we demonstrated only the parts (in boxes indicated by green and red boxes) of the whole images (see (J,K)). The whole figures are shown in (J,K). Scale bars (nm): 92 (A); 30 (B,G); 80 (C,E,LN); 25 (D); 75 (F); 160 (H,I); 260 (J,K).
Figure 5
Figure 5
Structure of the Golgi in goblet cells. (AC,E,G) Pores (red arrows) near the boundary cisternal distensions and the 52 nm vesicles (yellow arrows in (EH)) attached to membrane of this cisterna. (B) The red arrow shows the pore separating the boundary cisternal distension from the rest of the cisterna. (D) Cluster of the 52 nm presumably COPI-dependent vesicles. (EH) The 52 nm vesicles attached to membrane of Golgi cisternae (yellow arrows). (I) Serial EM tomography images demonstrating the 42 nm vesicle. Red arrows show the site where the 42 nm vesicles appear and then disappear. Scale bars (nm): 200 (A,D); 70 nm (B); 50 (C,FH); 75 (E,I).
Figure 6
Figure 6
Immune EM labeling of the Golgi in goblet cells and neighboring enterocytes for Golgi markers. Red arrows indicate secretory granules. Blue arrows show the Golgi of goblet cells. Magenta arrows demonstrate the Golgi of enterocytes. Green arrows show the PM immune EM labeling for routinely used Golgi enzymes, namely GalT (G,I) and SialTF (H). No gold over the 52 nm vesicles was visible. Labeling of the Golgi in goblet cells and neighboring enterocytes for giantin (A), ß-COP (B,DF), and GM130 (C). Expression of these markers in the Golgi of goblet cells is lower than in the Golgi of absorptive enterocytes. Scale bars (nm): 285 (AC,E,F); 192 (D). In (GI) scale bars are shown in the bottom of images.
Figure 7
Figure 7
Possible mechanisms involved in elimination of the excess membranes within APM after the fusion of subapical SG with the APM. (A,B) Apical part of goblet cells exhibits formation of a bubble filled with the SG and its extrusion into the intestinal lumen. (C) Enlargements of the inside of the green box in (B). (D) Enlargement of the area inside the red box in (A). Double membranes are shown with red arrows. Dark dots on the surface of the APM represent the molecules of Muc1. (EI) Accumulation of MLOs within the ER, ERES, and the Golgi and, subsequently, their secretion (E,G,H) into the intercellular space. MLOs within the cis side of the Golgi mimic the first three-osmiophilic cisternae (H). Green arrows show MLOs in the space between epithelial cells. Red arrows indicate MLOs within the Golgi. Magenta arrows demonstrate MLOs connected with the OMM (H,I). (J,K) Serial images of MLO (red arrows) near the APM. (LO) Serial tomo-images of the apical part of a goblet cell near the villous enterocytes (to the right). For the full images at low magnifications, see Figure S4(iiE). Scale bars (nm): 855 (A,B); 190 (C,D); 385 (E); 300 (F); 750 (GI); 240 (JO). In (LO) bar is the same.
Figure 8
Figure 8
Accumulation of MLOs (red arrows) and their movement to the ER, into the Golgi, and into the intercellular space observed in quiet goblet cells presumably after massive secretion. (A) MLO (red arrow) situated between the ER and the Golgi. (B,F,G,I,J) MLO (red arrows) in the space between cells. (C,D) Serial tomographic images of MLO (red arrows) in the space between goblet cell and enterocytes. (E,H) Secretion of MLOs (red arrows) into intercellular space. Scale bars (nm): 260 (A); 142 (BD,E); 500 (FH,I); 780 (J). In images (E,H) the bars and their size are visible below the images.

Similar articles

References

    1. Johansson M.E., Hansson G.C. Is the intestinal goblet cell a major immune cell? Cell Host Microbe. 2014;15:251–252. doi: 10.1016/j.chom.2014.02.014. - DOI - PMC - PubMed
    1. Johansson M.E.V., Gustafsson J.K., Holmen-Larsson J., Jabbar K.S., Xia L., Xu H., Ghishan F.K., Carvalho F.A., Gewirtz A.T., Sjovall H., et al. Bacteria penetrate the normally impenetrable inner colon mucus layer in both murine colitis models and in patients with ulcerative colitis. Gut. 2014;63:281–291. doi: 10.1136/gutjnl-2012-303207. - DOI - PMC - PubMed
    1. van der Post S., Jabbar K.S., Birchenough G.M.H., Arike L., Akhtar N., Sjovall H., Johansson M.E.V., Hansson G.C. Structural weakening of the colonic mucus barrier is an early event in ulcerative co- litis pathogenesis. Gut. 2019;68:2142–2151. doi: 10.1136/gutjnl-2018-317571. - DOI - PMC - PubMed
    1. Pelaseyed T., Bergström J.H., Gustafsson J.K., Ermund A., Birchenough G.M., Schütte A., van der Post S., Svensson F., Rodríguez-Piñeiro A.M., Nyström E.E., et al. The mucus and mucins of the goblet cells and enterocytes provide the first defense line of the gastrointestinal tract and interact with the immune system. Immunol. Rev. 2014;260:8–20. doi: 10.1111/imr.12182. - DOI - PMC - PubMed
    1. Birchenough G.M., Johansson M.E., Gustafsson J.K., Bergström J.H., Hansson G.C. New developments in goblet cell mucus secretion and function. Mucosal Immunol. 2015;8:712–719. doi: 10.1038/mi.2015.32. - DOI - PMC - PubMed

LinkOut - more resources