. 2025 Aug 1;14(15):1190.
doi: 10.3390/cells14151190.

From Development to Regeneration: Insights into Flight Muscle Adaptations from Bat Muscle Cell Lines

Affiliations

From Development to Regeneration: Insights into Flight Muscle Adaptations from Bat Muscle Cell Lines

Fengyan Deng et al. Cells. .

Abstract

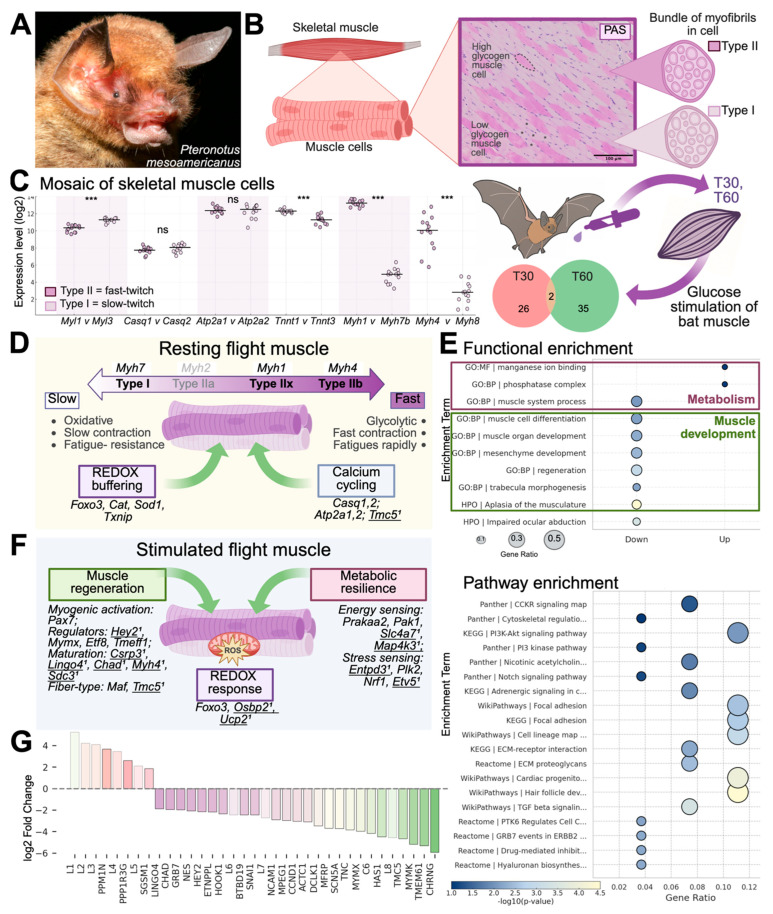
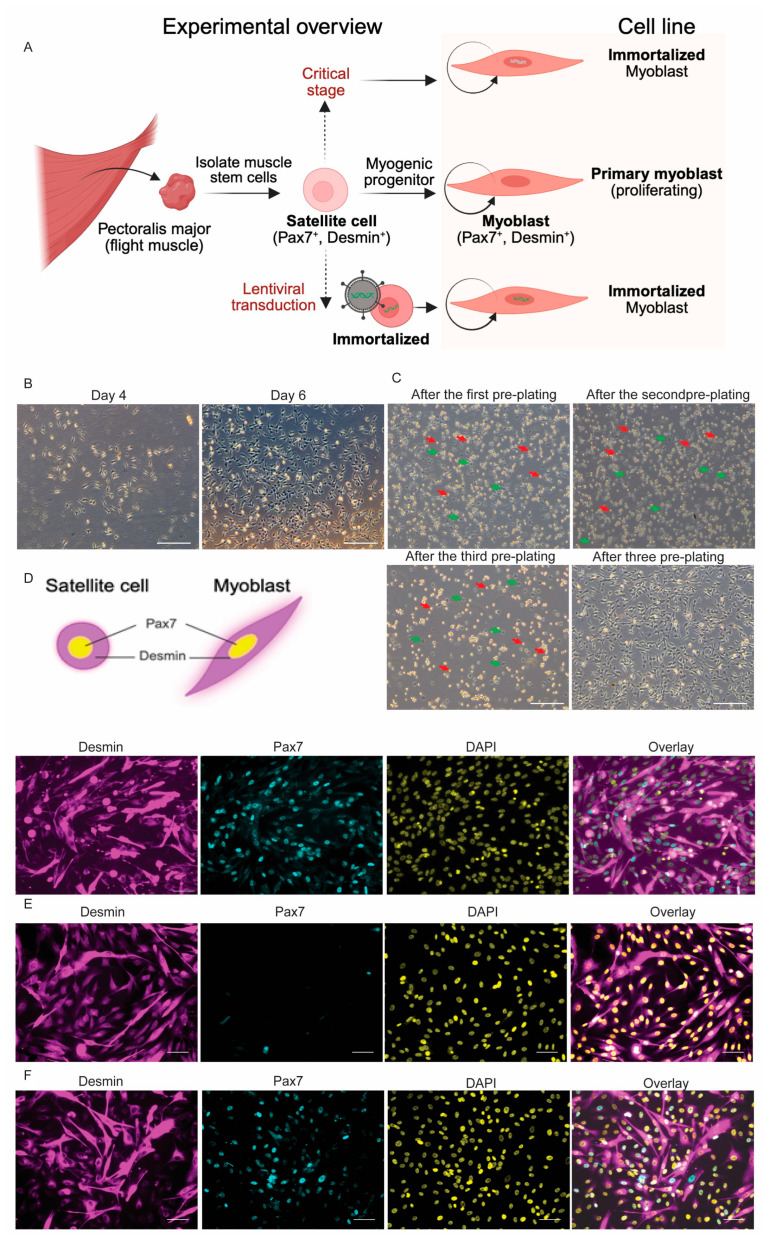
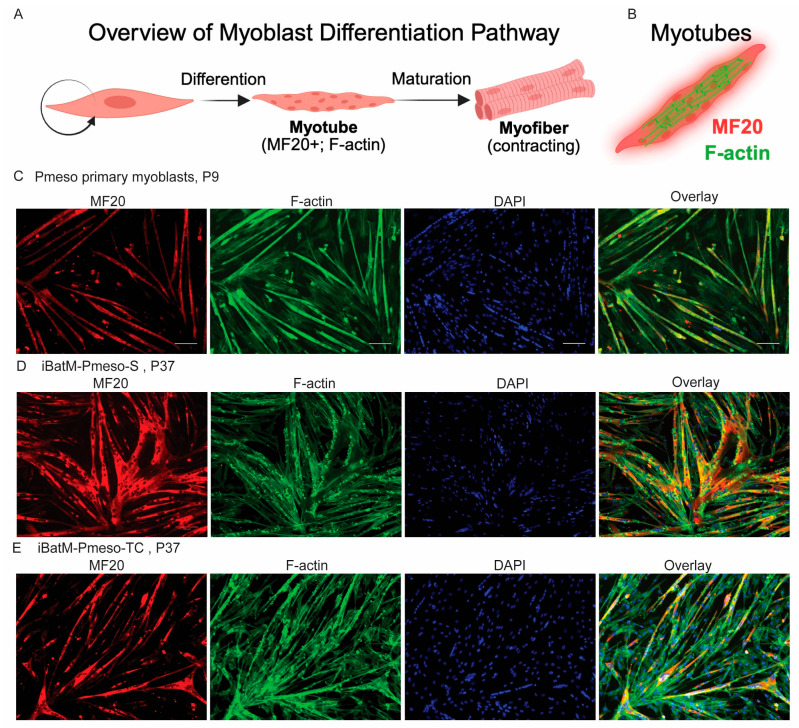
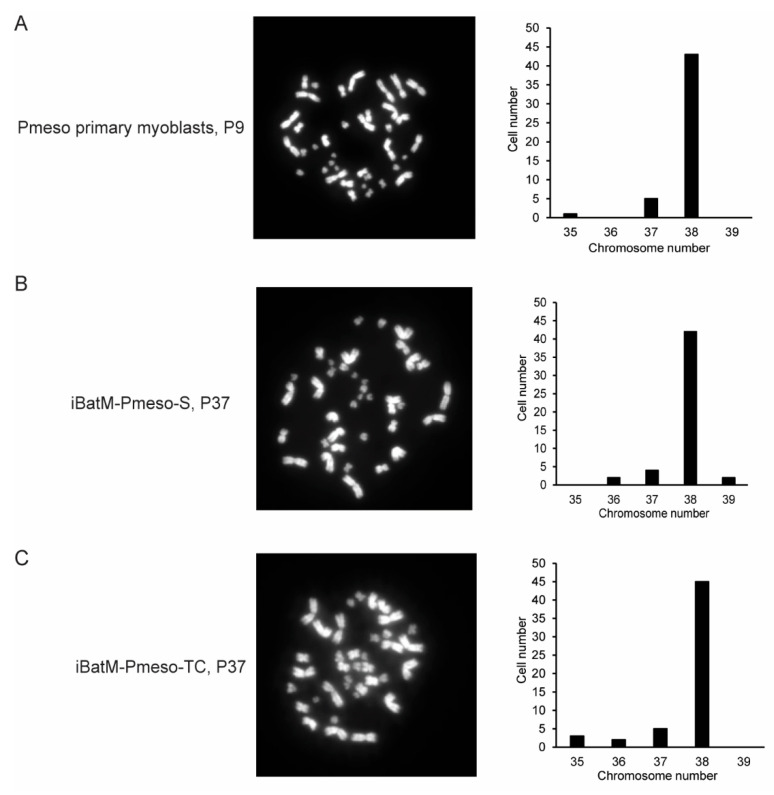
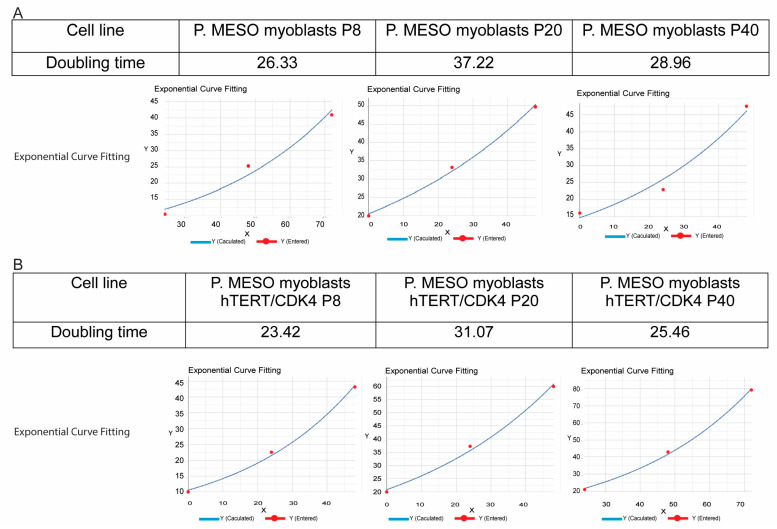
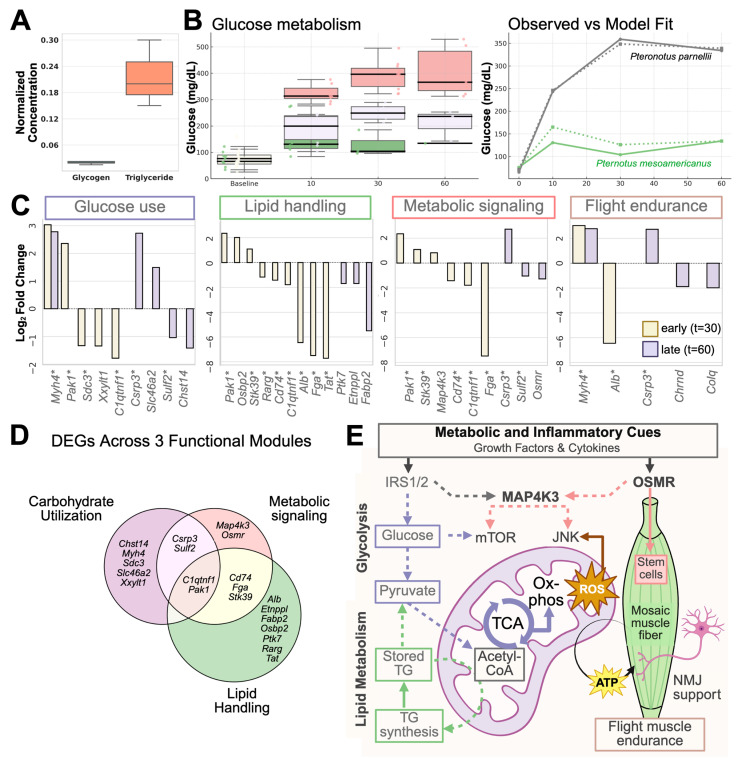
Skeletal muscle regeneration depends on muscle stem cells, which give rise to myoblasts that drive muscle growth, repair, and maintenance. In bats-the only mammals capable of powered flight-these processes must also sustain contractile performance under extreme mechanical and metabolic stress. However, the cellular and molecular mechanisms underlying bat muscle physiology remain largely unknown. To enable mechanistic investigation of these traits, we established the first myoblast cell lines from the pectoralis muscle of Pteronotus mesoamericanus, a highly maneuverable aerial insectivore. Using both spontaneous immortalization and exogenous hTERT/CDK4 gene overexpression, we generated two stable cell lines that retain proliferative capacity and differentiate into contractile myotubes. These cells exhibit frequent spontaneous contractions, suggesting robust functional integrity at the neuromuscular junction. In parallel, we performed transcriptomic and metabolic profiling of native pectoralis tissue in the closely related Pteronotus parnellii to define molecular programs supporting muscle specialization. Gene expression analyses revealed enriched pathways for muscle metabolism, development, and regeneration, highlighting supporting roles in tissue maintenance and repair. Consistent with this profile, the flight muscle is triglyceride-rich, which serves as an important fuel source for energetically demanding processes, including muscle contraction and cellular recovery. Integration of transcriptomic and metabolic data identified three key metabolic modules-glucose utilization, lipid handling, and nutrient signaling-that likely coordinate ATP production and support metabolic flexibility. Together, these complementary tools and datasets provide the first in vitro platform for investigating bat muscle research, enabling direct exploration of muscle regeneration, metabolic resilience, and evolutionary physiology.

Keywords: CDK4; bat; flight muscle biology; hTERT; myoblast cell line; myotube; proliferation and differentiation; regeneration.


Conflict of interest statement

The authors declare no conflicts of interest.

Figures

Figure 1
Figure 1
Pteronotus as a model for flight muscle specialization and stress resilience. (A) Photo of P. mesoamericanus, a Neotropical mustached bat specialized for high-speed, high-endurance flight. (B) Schematic of skeletal muscle highlighting a mosaic of fast-twitch (Type II) and slow-twitch (Type I) muscle fibers. Periodic Acid-Schiff (PAS) staining reveals high and low glycogen-content across muscle fibers. Skeletal muscle tissue (pectoralis) was sampled at three timepoints: control animals (n = 4) represent the baseline state (T0), while glucose-fed animals were sampled at 30 (T30; n = 3) and 60 (T60; n = 5) minutes post-glucose intake. RNA-seq was performed on flight muscle to identify differentially expressed genes (DEGs) in response to glucose. The Venn diagram shows overlap of DEGs between T30 vs. T0 and T60 vs. T0. (C) Expression of muscle fiber-type genes across 13 individuals, comparing fast-twitch (dark purple) and slow-twitch (light purple) paralogs. Candidate genes include myosin heavy chains (Myh1, Myh4, Myh7, Myh8), myosin light chains (Myl1, Myl3), calsequestrins (Casq1, Casq2), calcium ATPases (Atp2a1, Atp2a2), and troponin T (Tnnt3, Tnnt1). Horizontal line indicates median; statistical comparisons were performed using paired t-tests. *** p < 0.001. (D) Summary diagram of resting flight muscle gene expression at baseline. The pectoralis has mosaic fiber types, ranging from slow-twitch oxidative (Type I, Myh7) to fast-twitch glycolytic (Type IIb, Myh4), and intermediate fast-twitch oxidative-glycolytic fibers (Type IIx, Myh1). At rest, flight muscle is enriched for genes involved in redox buffering (Foxo3, Cat, Sod1, Txnip) and calcium handling (Casq1/2, Atp2a1/2, Tmc5). indicates DEGs with p < 0.003 and log2 fold change > 1.5. (E) Gene set enrichment analysis (GSEA) for T30 vs. T60. Dot plots show top enriched terms from KEGG, Reactome, Panther, and WikiPathways. Circle size reflects gene ratio; color indicates −log10 (p-value). Directionality refers to changes relative to T30: “Up” = higher expression in T60, “Down” = lower. The top functional terms were associated with muscle metabolism and development. (F) Summary diagram of glucose-stimulated gene expression, grouped by functional modules. Regeneration signaling includes myogenic activation (Pax7), regulators (Mymx, Hey2, Etf8, Tmeff1), maturation (Lingo4, Chad, Csrp3, Myh4), and fiber-type specification (Maf, Tmc5). Metabolic resilience includes energy sensing (Prkaa2, Pak1, Slc4a7, Map4k3) and stress signaling (Etv5, Plk2, Nrf1). Redox response includes Foxo3, Osbp2, and Ucp2. (G) Log2 fold change in gene expression for T60 relative to T30. All data marked with † are significant from RNA-seq differential expression analysis. n denotes number of biological replicates. ns = not significant.
Figure 2
Figure 2
Bat primary myoblast isolation and myoblast verification. (A) Summary of the development and characterization of myoblast cell lines. (B) Primary muscle cells at 4-day and 6-day post-derivation. (C) Representative phase-contrast images showing the muscle cells at different stages of pre-plating. Green arrow: attached cells; red arrow: cells in suspension. (DF) Immunofluorescent staining of DESMIN (magenta) and PAX7 (cyan) with DAPI counterstain (yellow) of P. mesoamericanus primary myoblasts, P9 (D), iBatM-Pmeso-S, P37 (E), and iBatM-Pmeso-TC, P37 (F). Scale bar: 50 μm.
Figure 3
Figure 3
Bat Myoblast Lines Retain Differentiation Capacity. (A) Schematic overview of myoblast differentiation into multinucleated myotubes and subsequent maturation into myofibers. (B) Diagram illustrating expected colocalization of sarcomeric myosin heavy chain (MF20, red) and F-actin (green) in differentiated myotubes. (CE) Immunofluorescent staining of myosin heavy chain (MF20; red), F-actin (green), and nuclei (DAPI; blue), with merged overlays to the right. (C) P. mesoamericanus myoblasts at passage 9 (P9) exhibit robust differentiation with organized, striated F-actin consistent with sarcomeric structure. (D) iBatM-Pmeso-S (P37) displays irregular, punctate F-actin patterns with less consistent alignment, suggesting impaired cytoskeletal maturation despite MF20 expression. (E) iBatM-Pmeso-TC (P37) shows improved F-actin organization and greater alignment compared to iBatM-Pmeso-S, more closely resembling the sarcomeric pattern observed in primary cells. Scale bar: 100 μm.
Figure 4
Figure 4
Bat Myoblast Lines Retain Genetic Stability After Extended Passaging. (A). Representative chromosome spread and count distribution for P. mesoamericanus primary myoblasts (Pmeso) at passage 9. A total of 49 metaphase spreads were analyzed, with a diploid karyotype of 2n = 38. (B). Representative chromosome spread and counts for iBatM-Pmeso-S at late passage (P37). Of 50 metaphase spreads, most maintained the expected diploid number (2n = 38), indicating genomic stability despite extended culture. (C). Representative image of chromosome spread and chromosome counts for iBatM-Pmeso-TC at P37. Among 55 metaphase spreads, the majority maintained 2n = 38, consistent with long-term karyotypic stability. Images were taken at 40× magnification.
Figure 5
Figure 5
Spontaneous and hTERT/CDK4 Immortalization Support Long-Term Proliferation. (A). Doubling time and exponential curve fitting for spontaneously immortalized myoblasts iBatM-Pmeso-S at passages 8 (P8), P20, and P40, demonstrating the bypass of senescence. (B). Doubling time and exponential growth curve fitting for hTERT/CDK4-immortalized myoblasts iBatM-Pmeso-TC at P8, P20, and P40, showing stable proliferation. Doubling Time Computing software: https://www.doubling-time.com/compute_more.php (accessed on 5 May 2025).
Figure 6
Figure 6
Integrated molecular, physiological, and functional adaptations in flight muscle. (A). Normalized concentrations of glycogen and triglycerides measured in P. parnellii pectoralis muscle, showing preferential storage of triglycerides. (B). Glucose tolerance test (GTT) time series and linear mixed model fit. Left: Blood glucose levels measured at baseline, 10, 30, and 60 min after oral glucose administration across individual bats (n = 36). P. mesoamericanus (green) shows a uniformly low response, whereas P. parnellii exhibits both high (red) and low (gray) glucose clearance phenotypes. Right: Linear mixed-model fit to the GTT time series. Solid lines represent observed species means; dotted lines indicate the model-predicted trajectories. The model shows a significant species × time interaction (p < 0.001) in glucose clearance for P. mesoamericanus (green, n = 10) and P. parnellii (dark gray, n = 26). (C). Log2 fold change in gene expression for differentially expressed genes (DEGs) in flight muscle at 30 min (yellow) or 60 min (purple) post-glucose administration compared to baseline (0 min). Only DEGs with |log2FC| > 1.5 and adjusted p-value < 0.01 (EdgeR) are shown. Genes are grouped into four functional modules: Glucose use, lipid handling, metabolic signaling, and flight endurance based on enrichment clustering using g:Profiler-enriched terms. Genes with (*) are shared in different modules. Module-specific DEGs include Chst14, Slc46a2, Xxylt1 (glucose handling), and Osbp2, Ptk7, Etnppl, and Fabp2 (lipid handling), highlighting metabolic specialization in bat flight muscle. (D). Venn diagram illustrating the overlap of DEGs across three functional modules: Carbohydrate Utilization, lipid handling, and metabolic signaling. Genes in overlapping regions are implicated in multiple pathways. Notably, Map4k3 and Osmr are uniquely assigned, representing upstream metabolic and cytokine signaling inputs. (E). Schematic of core cellular metabolic pathways supporting flight muscle performance. The illustration highlights the integrated metabolic and structural adaptations required for powered flight. The conceptual model incorporates well-established molecules in glucose metabolism, lipid handling, mitochondrial ATP production, and neuromuscular activity, based on general principles of cell biology. Solid arrows represent direct metabolic inputs; dotted arrows indicate indirect regulatory inputs. Growth factors and cytokine signals act through receptors IRS1/2 and OSMR, which activate downstream protein MAP4K3. These signaling pathways converge on mTOR and JNK proteins to regulate cellular metabolic and stress responses. Pyruvate-derived acetyl-CoA is routed either to the TCA cycle or triglyceride (TG) synthesis. Stored TG serves as an energy reservoir for mitochondrial energy production. ATP fuels neuromuscular junction (NMJ) activity and contraction, supporting muscle endurance. In parallel, OSMR contributes to regenerative signaling, consistent with muscle stem cell activation.

Update of

Similar articles

References

    1. Chal J., Pourquie O. Making muscle: Skeletal myogenesis in vivo and in vitro. Development. 2017;144:2104–2122. doi: 10.1242/dev.151035. - DOI - PubMed
    1. Joe A.W., Yi L., Natarajan A., Le Grand F., So L., Wang J., Rudnicki M.A., Rossi F.M. Muscle injury activates resident fibro/adipogenic progenitors that facilitate myogenesis. Nat. Cell Biol. 2010;12:153–163. doi: 10.1038/ncb2015. - DOI - PMC - PubMed
    1. Wosczyna M.N., Konishi C.T., Perez Carbajal E.E., Wang T.T., Walsh R.A., Gan Q., Wagner M.W., Rando T.A. Mesenchymal Stromal Cells Are Required for Regeneration and Homeostatic Maintenance of Skeletal Muscle. Cell Rep. 2019;27:2029–2035.e5. doi: 10.1016/j.celrep.2019.04.074. - DOI - PMC - PubMed
    1. Richler C., Yaffe D. The in vitro cultivation and differentiation capacities of myogenic cell lines. Dev. Biol. 1970;23:1–22. doi: 10.1016/S0012-1606(70)80004-5. - DOI - PubMed
    1. Yaffe D. Retention of differentiation potentialities during prolonged cultivation of myogenic cells. Proc. Natl. Acad. Sci. USA. 1968;61:477–483. doi: 10.1073/pnas.61.2.477. - DOI - PMC - PubMed

LinkOut - more resources