. 2025 Aug 6;14(15):1212.
doi: 10.3390/cells14151212.

Residual Tumor Resection After Anti-PD-1 Therapy: A Promising Treatment Strategy for Overcoming Immune Evasive Phenotype Induced by Anti-PD-1 Therapy in Gastric Cancer

Affiliations

Residual Tumor Resection After Anti-PD-1 Therapy: A Promising Treatment Strategy for Overcoming Immune Evasive Phenotype Induced by Anti-PD-1 Therapy in Gastric Cancer

Hajime Matsuida et al. Cells. .

Abstract

Background: Anti-programmed death 1 receptor (PD-1) therapy is a promising treatment strategy for patients with unresectable advanced or recurrent gastric/gastroesophageal junction (G/GEJ) cancer. However, its response rate and survival benefits are still limited; an immunological analysis of the residual tumor after anti-PD-1 therapy would be important.

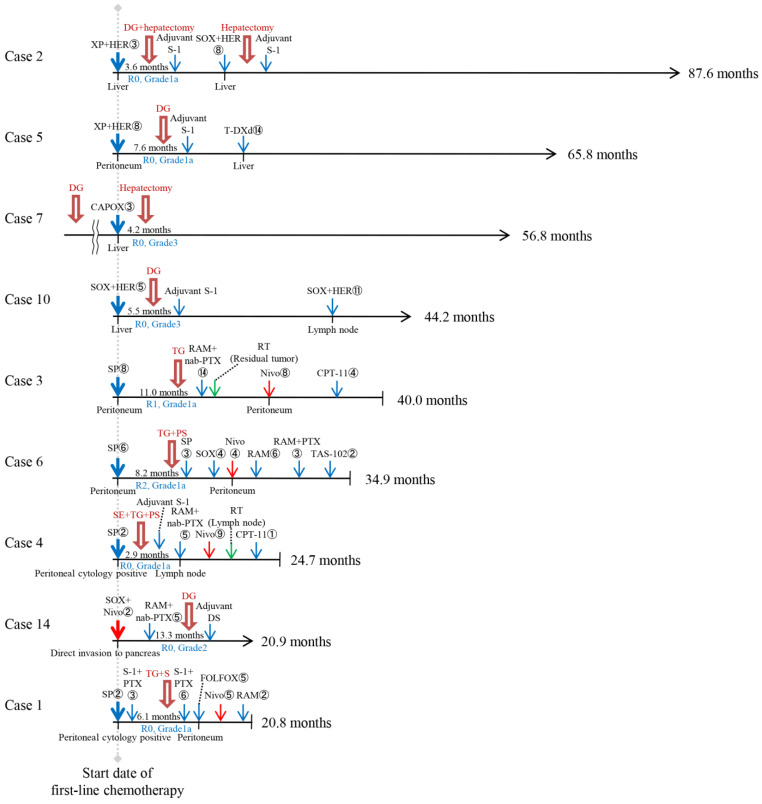
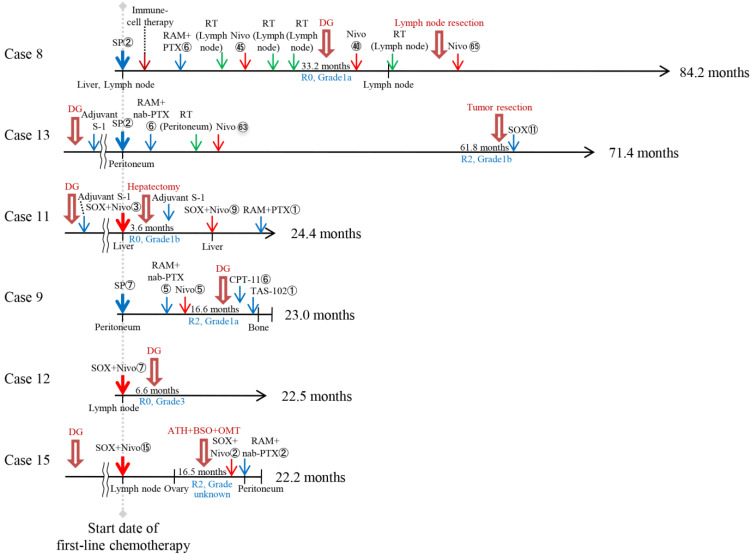
Methods: We evaluated the clinical efficacy of tumor resection (TR) after chemotherapy or anti-PD-1 therapy in patients with unresectable advanced or recurrent G/GEJ cancer and analyzed the immune status of tumor microenvironment (TME) by immunohistochemistry using their surgically resected specimens.

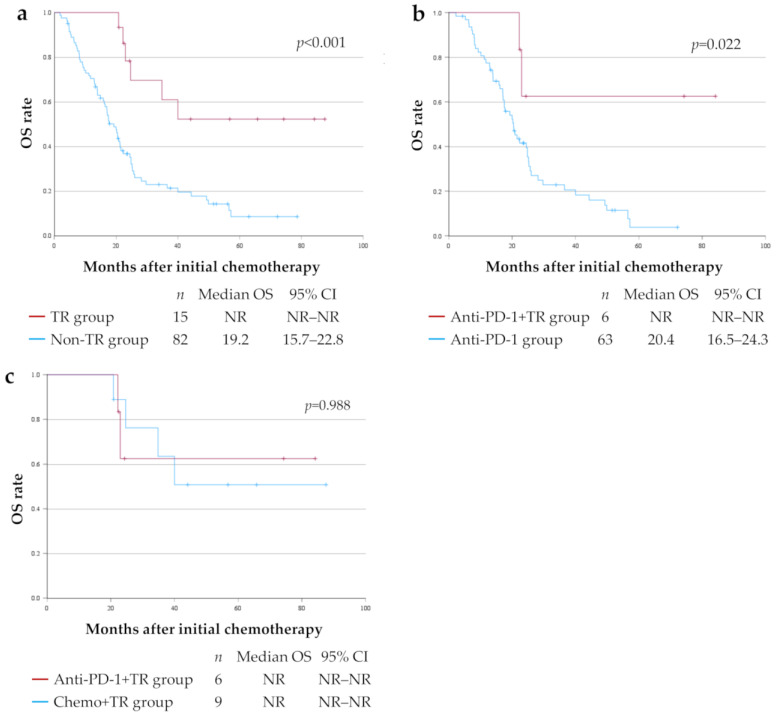
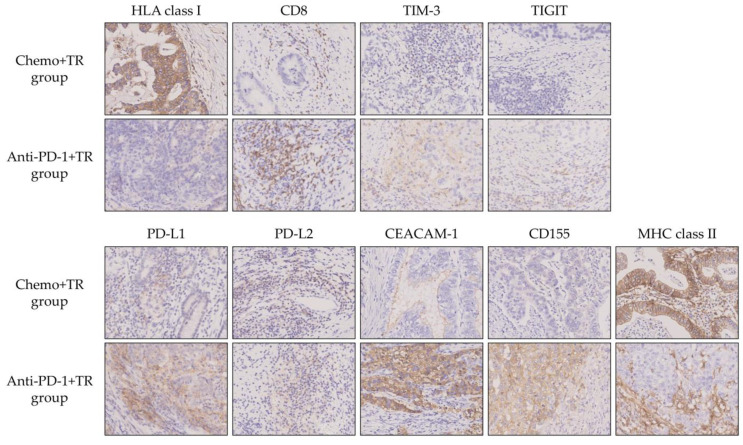
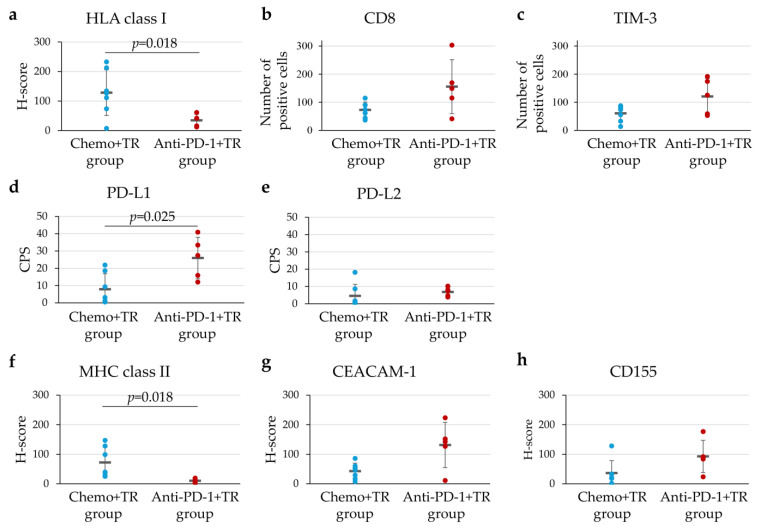
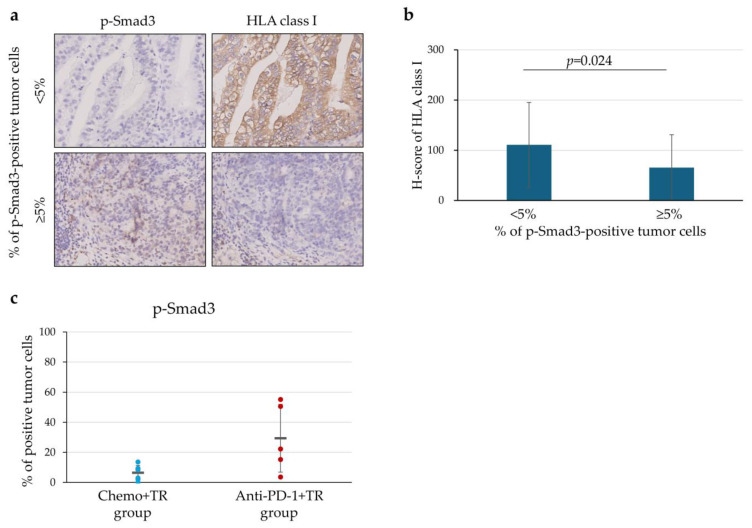
Results: Patients treated with TR after anti-PD-1 therapy had significantly longer survival compared to those treated with chemotherapy and anti-PD-1 therapy alone. Expression of human leukocyte antigen (HLA) class I and major histocompatibility complex (MHC) class II on tumor cells was markedly downregulated after anti-PD-1 therapy compared to chemotherapy. Furthermore, the downregulation of HLA class I may be associated with the activation of transforming growth factor-β signaling pathway in the TME.

Conclusions: Immune escape from cytotoxic T lymphocytes may be induced in the TME in patients with unresectable advanced or recurrent G/GEJ cancer after anti-PD-1 therapy due to the downregulation of HLA class I and MHC class II expression on tumor cells. TR may be a promising treatment strategy for these patients when TR is feasible after anti-PD-1 therapy.

Keywords: HLA class I; TGF-β; anti-PD-1 therapy; gastric/gastroesophageal cancer; tumor immune microenvironment; tumor resection.


Conflict of interest statement

The authors declare no conflicts of interest.

Figures

Figure 1
Figure 1
Clinical course of nine patients who underwent tumor resection after chemotherapy. The thick red arrow indicates the surgery. The blue, green, and red arrows indicate chemotherapy, radiotherapy, and immunotherapy, respectively. The numbers listed next to each regimen indicate the number of treatments. The locations of the metastatic tumors are listed below the horizontal axis. The period from the start date of first-line treatment with chemotherapy and/or anti-PD-1 therapy to tumor resection is shown on the horizontal axis. The overall survival is shown on the right side of the horizontal axis. The horizontal line of arrows indicates survivors. CAPOX—capecitabine-oxaliplatin; CPT-11—irinotecan; DG—distal gastrectomy; DS—Docetaxel-S-1; FOLFOX—oxaliplatin-5-fluorouracil-leucovorin-oxaliplatin; HER—trastuzumab; Nivo—nivolumab; PS—pancreato-splenectomy; PTX—paclitaxel; RAM—ramucirumab; RT—radiotherapy; S—splenectomy; SE—subtotal esophagectomy; SOX—S-1-oxaliplatin; SP—S-1-cisplatin; TAS-102—Trifluridine/tipiracil; T-DXd—Trastuzumab deruxtecan; TG—total gastrectomy; XP—capecitabine-cisplatin.
Figure 2
Figure 2
Clinical course of six patients who underwent tumor resection after anti-PD-1 therapy. The thick red arrow indicates the surgery. The blue, green, and red arrows indicate chemotherapy, radiotherapy, and immunotherapy, respectively. The numbers listed next to each regimen indicate the number of treatments. The locations of the metastatic tumors are listed below the horizontal axis. The period from the start date of first-line treatment with chemotherapy and/or anti-PD-1 therapy to tumor resection is shown on the horizontal axis. The overall survival is shown on the right side of the horizontal axis. The horizontal line of arrows indicates survivors. ATH—abdominal total hysterectomy; BSO—bilateral salpingo-oophorectomy; CPT-11—irinotecan; DG—distal gastrectomy; Nivo—nivolumab; OMT—omentectomy; PTX—paclitaxel; RAM—ramucirumab; RT—radiotherapy; SOX—S-1-oxaliplatin; SP—S-1-cisplatin; TAS-102—Trifluridine/tipiracil.
Figure 3
Figure 3
Kaplan–Meier curves for overall survival (OS) for each treatment group. (a) OS curves in patients who underwent tumor resection (TR) after chemotherapy or anti-PD-1 therapy (TR group, n = 15) and those who underwent chemotherapy and/or anti-PD-1 therapy alone (Non-TR group, n = 82). (b) OS curves in patients who underwent TR after anti-PD-1 therapy (Anti-PD-1+TR group, n = 6) and those who underwent anti-PD-1 therapy in the Non-TR group (Anti-PD-1 group, n = 63). (c) OS curves in Anti-PD-1+TR group (n = 6) and patients who underwent TR after chemotherapy (Chemo+TR group, n = 9). CI—confidence interval; PD-1—programmed death 1 receptor; NR—not reached.
Figure 4
Figure 4
Representative IHC staining with HLA class I, CD8, TIM-3, TIGIT, PD-L1, PD-L2, CEACAM-1, CD155, and MHC class II in patients who underwent tumor resection (TR) after chemotherapy (Chemo+TR group) and those who underwent TR after anti-PD-1 therapy (Anti-PD-1+TR group). Original magnification ×400.
Figure 5
Figure 5
Characteristics of tumor immune microenvironment in patients who underwent tumor resection (TR) after chemotherapy (Chemo+TR group) and those who underwent TR after anti-PD-1 therapy (Anti-PD-1+TR group). Dot plots showing the distribution of H-score, CPS or number of cells for HLA class I (a), CD8 (b), TIM-3 (c), PD-L1 (d), PD-L2 (e), MHC class II (f), CEACAM-1 (g), CD155 (h) expression evaluated by IHC using surgically resected specimens. Means of H-score, CPS, and number of cells are represented by the horizontal line, together with their error bars representing the standard deviation. Within each molecule category, every dot represents the evaluation of IHC staining in each case.
Figure 6
Figure 6
Downregulation of HLA class I expression in relation to p-Smad3 expression. (a) Representative IHC staining with p-Smad3 and HLA class I expression between the positive tumor cells for p-Smad3 expression < 5% and ≥5%. The consecutive tissue sections were used in this evaluation. Original magnification ×400. (b) Bar graph showing the H score for HLA class I expression level in the group with <5% (30 fields) and the group with ≥5% (30 fields) of tumor cells positive for p-Smad3 expression. The mean percentage is represented by the bars, together with the error bars representing the standard deviation. (c) P-Smad3 expression in patients who underwent tumor resection (TR) after chemotherapy (Chemo+TR group) and those who underwent TR after anti-PD-1 therapy (Anti-PD-1+TR group). Dot plots showing the distribution of the percentage of p-Smad-positive tumor cells determined by IHC using surgically resected specimens. The means of the percentage of p-Smad3-positive tumor cells are represented by the horizontal line, together with their error bars representing the standard deviation. Every dot represents the evaluation of IHC staining in one case.

Similar articles

References

    1. Bray F., Laversanne M., Sung H., Ferlay J., Siegel R.L., Soerjomataram I., Jemal A. Global cancer statistics 2022: GLOBOCAN estimates of incidence and mortality worldwide for 36 cancers in 185 countries. CA Cancer J. Clin. 2024;74:229–263. doi: 10.3322/caac.21834. - DOI - PubMed
    1. Bang Y.-J., Van Cutsem E., Feyereislova A., Chung H.C., Shen L., Sawaki A., Lordick F., Ohtsu A., Omuro Y., Satoh T., et al. Trastuzumab in combination with chemotherapy versus chemotherapy alone for treatment of HER2-positive advanced gastric or gastro-oesophageal junction cancer (ToGA): A phase 3, open-label, randomised controlled trial. Lancet. 2010;376:687–697. doi: 10.1016/S0140-6736(10)61121-X. - DOI - PubMed
    1. Janjigian Y.Y., Shitara K., Moehler M., Garrido M., Salman P., Shen L., Wyrwicz L., Yamaguchi K., Skoczylas T., Campos Bragagnoli A., et al. First-line nivolumab plus chemotherapy versus chemotherapy alone for advanced gastric, gastro-oesophageal junction, and oesophageal adenocarcinoma (CheckMate 649): A randomised, open-label, phase 3 trial. Lancet. 2021;398:27–40. doi: 10.1016/S0140-6736(21)00797-2. - DOI - PMC - PubMed
    1. Kang Y.K., Chen L.T., Ryu M.H., Oh D.Y., Oh S.C., Chung H.C., Lee K.W., Omori T., Shitara K., Sakuramoto S., et al. Nivolumab plus chemotherapy versus placebo plus chemotherapy in patients with HER2-negative, untreated, unresectable advanced or recurrent gastric or gastro-oesophageal junction cancer (ATTRACTION-4): A randomised, multicentre, double-blind, placebo-controlled, phase 3 trial. Lancet Oncol. 2022;23:234–247. doi: 10.1016/S1470-2045(21)00692-6. - DOI - PubMed
    1. Rha S.Y., Oh D.Y., Yanez P., Bai Y., Ryu M.H., Lee J., Rivera F., Alves G.V., Garrido M., Shiu K.K., et al. Pembrolizumab plus chemotherapy versus placebo plus chemotherapy for HER2-negative advanced gastric cancer (KEYNOTE-859): A multicentre, randomised, double-blind, phase 3 trial. Lancet Oncol. 2023;24:1181–1195. doi: 10.1016/S1470-2045(23)00515-6. - DOI - PubMed

LinkOut - more resources