. 2025 Aug 13:13:RP96908.
doi: 10.7554/eLife.96908.

CD81+ senescent-like fibroblasts exaggerate inflammation and activate neutrophils via C3/C3aR1 axis in periodontitis

Affiliations

CD81+ senescent-like fibroblasts exaggerate inflammation and activate neutrophils via C3/C3aR1 axis in periodontitis

Liangliang Fu et al. Elife. .

Abstract

Periodontitis, a prevalent inflammatory disease worldwide, poses a significant economic burden on society and the country. Previous research has established a connection between cellular senescence and periodontitis. However, the role and mechanism of cell senescence in the progression of periodontitis have not been thoroughly investigated. This study aimed to explore the involvement of cellular senescence in the pathogenesis of periodontitis and determine the underlying mechanisms. Our findings demonstrated that senescent cells accumulated during the progress of periodontitis in both human samples and mice models. Moreover, several scRNA-seq analyses suggested that gingival fibroblasts were the main cell population undergoing cellular senescence during human periodontitis, which helps mitigate tissue damage and bone loss. Furthermore, we identified a high expression of CD81 in the senescent gingival fibroblast population. These cells were found to actively contribute to inflammation through their potent pro-inflammatory metabolic activity and secretion of senescence-associated secretory phenotype factors. Additionally, they recruited neutrophils via the C3/C3aR1 pathway, indirectly sustaining the inflammatory response. Senolytics via Navitoclax successfully alleviated inflammation and bone loss in periodontitis, and administration of metformin could alleviate inflammation and bone loss in periodontitis through inhibiting cellular senescence. These results provide valuable insights into the cellular and molecular basis of periodontitis-induced tissue damage, highlighting the significance of fibroblast senescence. In conclusion, our study sheds light on the relationship between CD81 and cellular senescence, suggesting its potential as a therapeutic target for periodontitis.

Keywords: CD81; cellular senescence; human; human gingival fibroblasts; immunology; inflammation; mouse; periodontal diseases; senescence-associated secretory phenotype.


Conflict of interest statement

LF, CY, QZ, SG, WS, TX, QS, LC, JL, MW, HX No competing interests declared

Figures
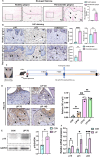
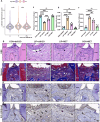
Figure 1.
Figure 1.. Characteristics of cellular senescence along with periodontitis progression.
(A) Representative image of and semi-quantification of senescence-associated β-galactosidase (SA-β-gal) staining in healthy (n = 4 field) and periodontitis (n = 6 field) patient gingiva, scale bar = 40 or 20 μm. (B) Representative images of immunohistochemical (IHC) staining and semi-quantification of p16, p21, and H3K9me3 in healthy and periodontitis patient gingiva (n = 3 field), positive cells were indicated by black arrow, scale bar = 40 μm. (C) Analysis strategy of ligature-induced periodontitis (LIP) mouse model. (D) Representative image of IHC staining and semi-quantification of p16 in mouse gingiva of health and LIP post 3, 7, and 14 days (n = 3 field), scale bar = 40 μm. (E) Western blot images and semi-quantification of p16 protein levels in control (CON) and LIP post 7 days (LIP 7D) mouse gingiva (n = 4 independent experiments). (F) qrt-PCR analysis of p16, p21, and Tp53 in control (CON) and LIP 7D mouse gingiva (n = 3 independent experiments). Ep: epithelium; LP: lamina propria; Alv: alveolar bone; Teeth. Data are expressed as mean ± SD. *p < 0.05, **p < 0.01, ***p < 0.001, ****p < 0.0001.
Figure 1—figure supplement 1.
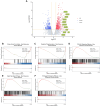
Figure 1—figure supplement 1.. Bulk RNA-seq analysis of ligature-induced periodontitis (LIP) mice model.
(A) Heatmap and (B) Volcano plots of differentially expressed genes in mouse gingiva at LIP 7D compared to the CON (n = 3 samples each group). Representative senescence-related genes are indicated as green. Blue dots indicate differentially downregulated genes; red dots indicate differentially upregulated genes. Significantly different expression genes with |log2FC| > 1 and false discovery rate (FDR) < 0.05. (C) Gene set enrichment analysis (GSEA) of cellular senescence gene sets in mouse gingiva at LIP 7D compared to the CON. (D) Gene Ontology (GO) enrichment analysis with upregulated (red) and downregulated (blue) genes shown in (A). The aging biological process was significantly enriched and highlighted by red.
Figure 1—figure supplement 2.
Figure 1—figure supplement 2.. Bulk RNA-seq analysis of ligature-induced periodontitis (LIP) mice model in regard to cellular senescence.
(A) Volcano plots of differentially expressed genes in mouse gingiva at LIP 7D compared to the control (CON). Representative senescence-associated secretory phenotype (SASP) genes are indicated as green. (B, C) Gene set enrichment analysis (GSEA) of citrate cycle and oxidative phosphorylation gene sets in mouse gingiva at LIP 7D compared to the CON, which indicated mitochondrial dysfunction in periodontitis. (DF) GSEA enrichment analysis of PI3K–AKT, MAPK, and NF-κB signaling pathway gene sets in mouse gingiva at LIP 7D compared to the CON, which indicated senescence-associated signaling pathway was activated in periodontitis.
Figure 2.
Figure 2.. Cellular senescence of gingival fibroblasts in periodontitis.
(A, B) UMAP diagram and single-cell annotation of cell clusters for the healthy and periodontitis patient gingiva from public dataset GSE164241. (C) Histogram of gingival tissue cell ratio in healthy and periodontitis patients. (D) The violin plot showing cellular senescence score of cell groups in healthy and periodontitis gingiva. (E) Gene set enrichment analysis (GSEA) of cellular senescence pathway in fibroblasts among periodontitis compared to those in healthy gingiva. (F) The violin plot showing cellular senescence score in subgroups in gingiva of healthy, mild, and severe periodontitis patients from public dataset GSE152042. (G) Immunofluorescence staining and semi-quantification of p16-positive fibroblasts in healthy and periodontitis patient gingiva. p16 (red), Vimentin (green), and nuclei (blue), Ep: epithelium; LP: lamina propria. White arrow indicates double positive cells, scale bar = 40 μm, n = 3.*p < 0.05, ****p < 0.0001.
Figure 2—figure supplement 1.
Figure 2—figure supplement 1.. Single cell RNA-seq analysis of healthy and peridontitis patient gingiva.
(A) UMAP diagram illustrated the cell clusters of GSE164241. (B) Marker genes of each cell were shown in the dot plot. (C) UMAP diagram and single-cell annotation of cells clusters from GSE152042. (D) Histogram of gingival tissue cell ratio in healthy, mild, and severe periodontitis patients from GSE152042.
Figure 2—figure supplement 2.
Figure 2—figure supplement 2.. SA-β-gal activity of human gingival fibroblasts stimulated by Pg-LPS.
(A) Senescence-associated β-galactosidase (SA-β-gal) staining and (B) semi-quantification of human gingival fibroblasts stimulated by different concentrations of Porphyromonas gingivalis lipopolysaccharide (Pg-LPS; n = 3) , scale bar = 20 μm. Black arrow indicates SA-β-gal-positive cells. Data are expressed as mean ± SD. *p ≤ 0.05, ***p ≤ 0.001, ****p ≤ 0.0001.
Figure 3.
Figure 3.. CD81 is identified as the potential marker of senescent gingival fibroblast.
(A) UMAP diagram illustrated the cell subclusters of fibroblasts from public dataset GSE164241. (B) Histogram of fibroblasts subclusters ratio in healthy and periodontitis gingiva, respectively. (C) The violin plot showing cellular senescence score of each fibroblast subcluster in healthy and periodontitis gingiva. (D) Gene Ontology (GO) enrichment analysis of each fibroblast subcluster. Fibroblast subcluster 1 shows enrichment of aging process highlighted by red. (E) Cellular localization of the top 20 marker molecules in fibroblasts subcluster 1. CD81 protein, located at cell membrane, was highlighted by red. (F) Density map of CD81 expression among fibroblast subcluster and re-annotation of fibroblast subcluster according to GO analysis. (G) Immunofluorescence staining and semi-quantification of CD81-positive fibroblasts in healthy and periodontitis patient gingiva. Vimentin (green), CD81 (red), and nuclei (blue), Ep: epithelium; LP: lamina propria. White arrow indicates double positive cells, scale bar = 40 μm, n = 3. Data are expressed as mean ± SD. **p ≤ 0.01, ****p ≤ 0.0001.
Figure 4.
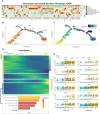
Figure 4.. CD81+ gingival fibroblasts are terminally differentiating cells with high senescence-associated secretory phenotype (SASP) genes expression.
(A) Heatmap showing the relative expression for SASP genes in each fibroblast subcluster. (B) Trajectory reconstruction of each fibroblast subcluster. (C) Monocle pseudotime analysis revealing the progression of gingival fibroblast clusters. (D) Upper panel: Heatmap showing the scaled expression of differently expressed genes in trajectory as in (C), cataloged into four gene clusters (labels on left). Bottom panel: Gene Ontology (GO) analysis of expressed genes whose expression increases as the differentiation trajectory progresses. (E) SASP-related genes with increased expression as the differentiation trajectory progresses.
Figure 4—figure supplement 1.
Figure 4—figure supplement 1.. Metabolic pathways analysis of fibroblast subclusters.
(A) The heatmap representing metabolic pathways in each fibroblast subcluster, which indicated fatty acid biosynthesis, arachidonic acid metabolism, and steroid biosynthesis, was significantly upregulated in CD81+ fibroblasts. (B) The flow chart representing the metabolism of arachidonic acid, which could be converted into prostaglandins (PGs) and Thromboxane As (TXAs) by COX-1 or COX-2. (C) The dot plot representing that PTGS1 gene (encoding COX1 protein) and PTGS2 gene (encoding COX2 protein) are significantly higher in CD81+ gingival fibroblasts compared to other fibroblast subclusters.
Figure 5.
Figure 5.. CD81+ fibroblasts possibly recruit neutrophils via the C3/C3aR1 axis.
(A) The relative number of interactions between CD81+ fibroblasts and other cell types in periodontitis gingiva. (B) Significantly increased ligand–receptor interaction derived from CD81+ fibroblasts. The C3–C3aR1 signaling axis increased between CD81+ fibroblast and neutrophil, especially, which was highlighted by red. (C) The heatmap showing the communication patterns of the Complement signaling pathway between fibroblasts and immune cell type in healthy and periodontitis gingiva. (D) The expression level of four representative genes in Complement signaling pathway. (E) Representative image of and semi-quantification of immunohistochemical (IHC) staining regarding C3 in healthy and periodontitis gingiva. Scale bar = 40 μm, n = 3. (F) Enzyme-linked immunosorbent assay (ELISA) analysis of human-C3 secretion between healthy human gingival fibroblasts (H-HGF, n = 16 samples) and periodontitis human gingival fibroblasts (P-HGF, n = 23 samples). (G) ELISA analysis of human-C3 secretion in H-HGFs with (Porphyromonas gingivalis lipopolysaccharide [Pg-LPS] group) or without (CON group) 1 μg/ml Pg-LPS stimulated, n = 6 samples. (H) Hematoxylin and eosin (H&E) image and representative spatial mapping of CD81 and SOD2 in healthy and periodontitis gingiva from public dataset GSE206621. Co-localization in CD81 and SOD2, a neutrophil marker, was found in the periodontitis gingiva. Ep: epithelium; LP: lamina propria. Data are expressed as mean ± SD. *p ≤ 0.05, **p ≤ 0.01, ***p ≤ 0.001.
Figure 5—figure supplement 1.
Figure 5—figure supplement 1.. Identifcation of the CD81+p16+ fibroblasts in periodontitis mouse gingiva.
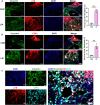
(A) Immunofluorescence staining and semi-quantification of p16 (red), Vimentin (green), and nuclei (blue) in control and ligature-induced periodontitis (LIP) mouse gingiva, n = 3 mice, scale bar = 50 μm. (B) Immunofluorescence staining and semi-quantification of CD81 (red), Vimentin (green), and nuclei (blue) in control and LIP mouse gingiva, n = 3 mice, scale bar = 50 μm. (C) Immunofluorescence staining of p16 (red), Vimentin (green), CD81 (cyan), and nuclei (blue) in LIP mouse gingiva, scale bar = 20 μm. White arrow indicates triple positive cells. Ep: epithelium; LP: lamina propria; Alv: alveolar bone. Data are expressed as mean ± SD. **p < 0.01, ***p < 0.001.
Figure 5—figure supplement 2.
Figure 5—figure supplement 2.. C3 and MPO expression level in healthy or peridontitis mouse gingiva.
(A) Representative image of and (B) semi-quantification of immunohistochemical (IHC) staining regarding C3 in control and ligature-induced periodontitis (LIP) mouse gingiva. Scale bar = 40 μm, n = 3. (C) Representative image of and (D) semi-quantification of IHC staining regarding MPO in control and LIP mouse gingiva. Scale bar = 40 μm, n = 3. Black arrow indicates neutrophil cells. (E) Immunofluorescence staining and (F) semi-quantification of CD81 (red), C3 (green), and nuclei (blue) in control and LIP mouse gingiva, n = 3 mice, scale bar = 50 μm. White arrow indicates double positive cells. (G) Immunofluorescence staining of CD81 (red), MPO (green), and nuclei (blue) in control and LIP mouse gingiva. Scale bar = 50 μm. Ep: epithelium; LP: lamina propria; Alv: alveolar bone. Data are expressed as mean ± SD. **p < 0.01, ***p < 0.001.
Figure 6.
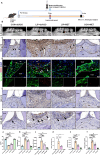
Figure 6.. Senolytics therapy alleviates inflammation and bone resorption in the ligature-induced periodontitis (LIP) model.
(A) Strategy of LIP mouse model treated by a senolytic drug Navitoclax. (B) Representative hematoxylin and eosin (H&E) staining image of each group, inflammatory cells were labeled by black arrows, scale bar = 20 μm. (C) Immunohistochemical (IHC) staining and (a) semi-quantification of p16 in each group, positive cells were labeled by black arrows, n = 3, scale bar = 20 μm. (D) IHC staining and (b) semi-quantification of H3K9me3 in each group, positive cells were labeled by black arrows, n = 3, scale bar = 20 μm. (E) Immunofluorescence staining and (c) semi-quantification of CD81 (red), Vimentin (green), and nuclei (blue) in control and LIP mouse gingiva, n = 3 mice, scale bar = 20 μm. White arrow indicates double positive cells. (F) IHC staining and (d) semi-quantification of C3 in each group, positive cells were labeled by black arrows, n = 3, scale bar = 20 μm. (G) IHC staining and (e) semi-quantification of MPO in each group, positive cells were labeled by black arrows, n = 3 field per group, scale bar = 20 μm. (H) IHC staining and (f) semi-quantification of CTSK in each group, positive cells were labeled by black arrows, n = 3 field per group, scale bar = 20 μm. Ep: epithelium; LP: lamina propria; Alv: alveolar bone; Teeth. Data are expressed as mean ± SD. *p ≤ 0.05, ***p ≤ 0.001.
Figure 7.
Figure 7.. Metformin alleviates inflammation and bone resorption in the ligature-induced periodontitis (LIP) model via inhibiting the interaction between CD81+ fibroblasts and neutrophils.
(A) Strategy of the LIP mouse model treated by metformin. (B) Three-dimensional (3D) visualization of the maxilla and quantified by the bone volume/tissue volume (BV/TV) ratio (a) the cement-to-enamel to alveolar bone crest (CEJ–ABC) distance (b) indicated by red line, n = 6 mice per group. (C) Immunohistochemical (IHC) staining and semi-quantification (c) of p16 in each group, positive cells were labeled by black arrows, n = 6 field per group, scale bar = 40 μm. (D) Immunofluorescence staining and (d) semi-quantification of CD81-positive fibroblasts in each group. Vimentin (green), CD81 (red), and nuclei (blue). White arrow indicates double positive cells, n = 3, scale bar = 20 μm. (E) IHC staining and (e) semi-quantification of C3 in each group, n = 6, scale bar = 40 μm. (F) IHC staining and (f) semi-quantification of MPO, a neutrophils marker, in each group, positive cells were labeled by black arrows, n = 6, scale bar = 40 μm. Ep: epithelium; LP: lamina propria; Alv: alveolar bone; Teeth. Data are expressed as mean ± SD. *p ≤ 0.05, **p ≤ 0.01, ***p ≤ 0.001, ****p ≤ 0.0001.
Figure 7—figure supplement 1.
Figure 7—figure supplement 1.. Cellular senescence expression level of periodontitis gingiva after adminstration of the metformin.
(A) The violin plot showing cellular senescence score in mouse gingiva of healthy (H), ligature-induced periodontitis (LIP) (P), and LIP treated with metformin (PM) groups from public data GSE242714. (B) Hematoxylin and eosin (H&E) staining images in each group. Inflammatory cells were labeled by black arrows, scale bar = 40 μm. (C) Representative image and (a) semi-quantification of Masson staining, in which collagen fibers were stained into blue, in each group. Collagen fiber was labeled by white arrows, n = 6, scale bar = 40 μm. (D) Immunohistochemical (IHC) staining and (b) semi-quantification of p21 in each group. Positive cells were labeled by black arrows, n = 6, scale bar = 40 μm. (E) IHC staining and (c) semi-quantification of H3K9me3 in each group. Positive cells were labeled by black arrows, n = 6, scale bar = 40 μm. Ep: epithelium; LP: lamina propria; Alv: alveolar bone; Teeth. Data are expressed as mean ± SD. **p < 0.01, ***p < 0.001, ****p < 0.0001.
Figure 7—figure supplement 2.
Figure 7—figure supplement 2.. Cellular senescence expression level of Pg-LPS-stimulated HGFs after adminstration of the metformin.
(A) In vitro experiment model of Porphyromonas gingivalis lipopolysaccharide (Pg-LPS)-induced senescence of human gingival fibroblasts (HGFs) treated with or without metformin (MET). (B) Senescence-associated β-galactosidase (SA-β-gal) staining and (C) semi-quantification of Pg-LPS-induced senescence of HGFs treated with or without MET. Black arrow indicates positive cells, n = 3, scale bar = 40 μm. (D) Western blot image of human-C3, CD81, and p16 protein levels of Pg-LPS-induced senescence of HGFs treated with or without MET. **p < 0.01, ****p < 0.0001.
Figure 7—figure supplement 3.
Figure 7—figure supplement 3.. CD81+ p16+ and CD81+ C3+ fibroblasts in Pg-LPS-stimulated HGFs after adminstration of the metformin.
(A) Immunofluorescence staining and (B) semi-quantification of CD81+ p16+ fibroblasts in Porphyromonas gingivalis lipopolysaccharide (Pg-LPS)-induced senescence treated with or without metformin (MET). CD81 (red),p16 (green), and nuclei (blue). White arrow indicates double positive cells, n = 3, scale bar = 20 μm. (C) Immunofluorescence staining and (D) semi-quantification of CD81+ C3+ fibroblasts in Pg-LPS-induced senescence treated with or without MET. CD81 (red), C3 (green), and nuclei (blue). White arrow indicates double positive cells, n = 3, scale bar = 20 μm. Data are expressed as mean ± SD. **p ≤ 0.01, ***p ≤ 0.001.
Figure 8.
Figure 8.. Schematic overview of the CD81+ senescent gingival fibroblast–neutrophil axis in periodontitis progression.
We propose that the initial periodontal inflammation is triggered by the CD81+ senescent gingival fibroblast induced by bacterial virulence like Porphyromonas gingivalis lipopolysaccharide (Pg-LPS). CD81+ senescent gingival fibroblast could exaggerate inflammation in the periodontal tissue via secreting senescence-associated secretory phenotypes (SASPs) and recruiting neutrophils by C3. In addition, Navitoclax and Metformin could alleviate the cellular senescence of the fibroblast and rescue the uncontrolled inflammation and bone resorption.

Update of

  • doi: 10.1101/2024.02.21.581332
  • doi: 10.7554/eLife.96908.1
  • doi: 10.7554/eLife.96908.2

References

    1. Alayash Z, Baumeister S-E, Holtfreter B, Kocher T, Baurecht H, Ehmke B, Nolde M, Reckelkamm SL. Complement C3 as a potential drug target in periodontitis: evidence from the cis-Mendelian randomization approach. Journal of Clinical Periodontology. 2024;51:127–134. doi: 10.1111/jcpe.13894. - DOI - PubMed
    1. An JY, Kerns KA, Ouellette A, Robinson L, Morris HD, Kaczorowski C, Park S-I, Mekvanich T, Kang A, McLean JS, Cox TC, Kaeberlein M. Rapamycin rejuvenates oral health in aging mice. eLife. 2020;9:e54318. doi: 10.7554/eLife.54318. - DOI - PMC - PubMed
    1. Ando Y, Tsukasaki M, Huynh NC-N, Zang S, Yan M, Muro R, Nakamura K, Komagamine M, Komatsu N, Okamoto K, Nakano K, Okamura T, Yamaguchi A, Ishihara K, Takayanagi H. The neutrophil-osteogenic cell axis promotes bone destruction in periodontitis. International Journal of Oral Science. 2024;16:18. doi: 10.1038/s41368-023-00275-8. - DOI - PMC - PubMed
    1. Aquino-Martinez R, Rowsey JL, Fraser DG, Eckhardt BA, Khosla S, Farr JN, Monroe DG. LPS-induced premature osteocyte senescence: Implications in inflammatory alveolar bone loss and periodontal disease pathogenesis. Bone. 2020;132:115220. doi: 10.1016/j.bone.2019.115220. - DOI - PMC - PubMed
    1. Aquino-Martinez R, Eckhardt BA, Rowsey JL, Fraser DG, Khosla S, Farr JN, Monroe DG. Senescent cells exacerbate chronic inflammation and contribute to periodontal disease progression in old mice. Journal of Periodontology. 2021;92:1483–1495. doi: 10.1002/JPER.20-0529. - DOI - PMC - PubMed

Associated data

LinkOut - more resources