. 2025 Aug 13;50(4):265.
doi: 10.1007/s11064-025-04507-7.

JAK2/STAT3 Signaling Pathway Modulates Acute Methylmercury Toxicity in the Mouse Astrocyte C8-D1A Cell Line

Affiliations

JAK2/STAT3 Signaling Pathway Modulates Acute Methylmercury Toxicity in the Mouse Astrocyte C8-D1A Cell Line

Aafia Ahmed et al. Neurochem Res. .

Abstract

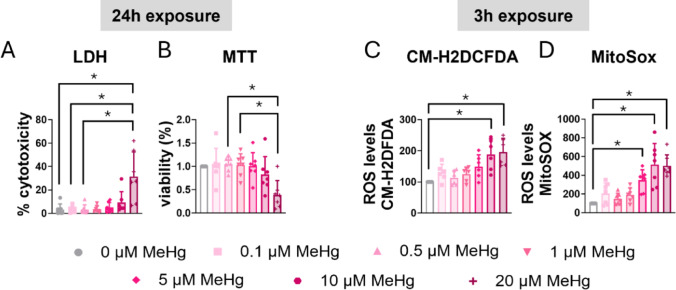
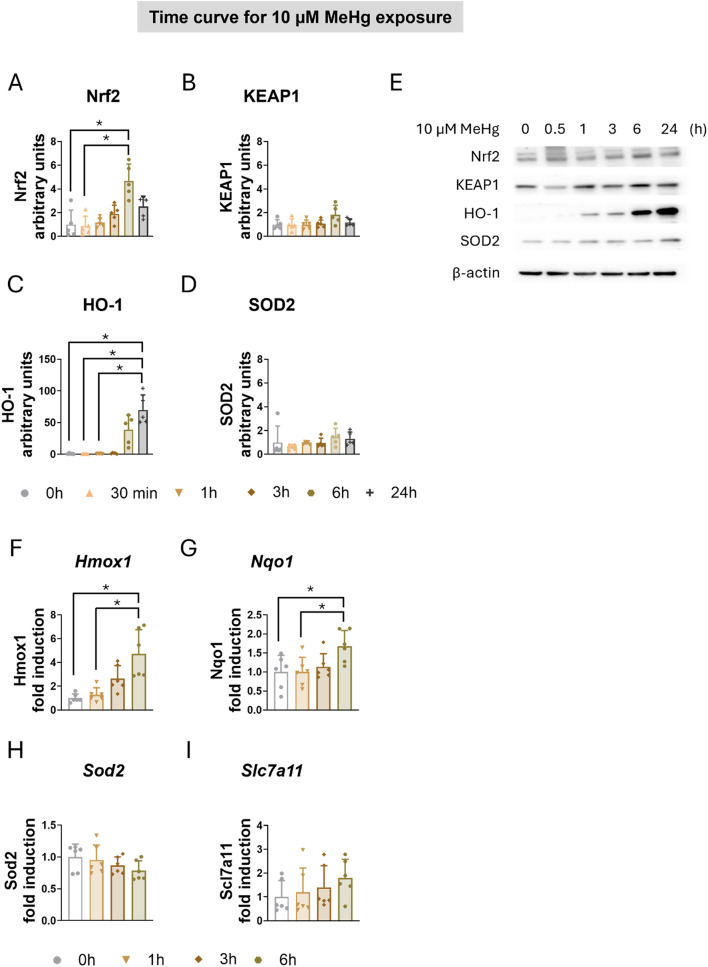
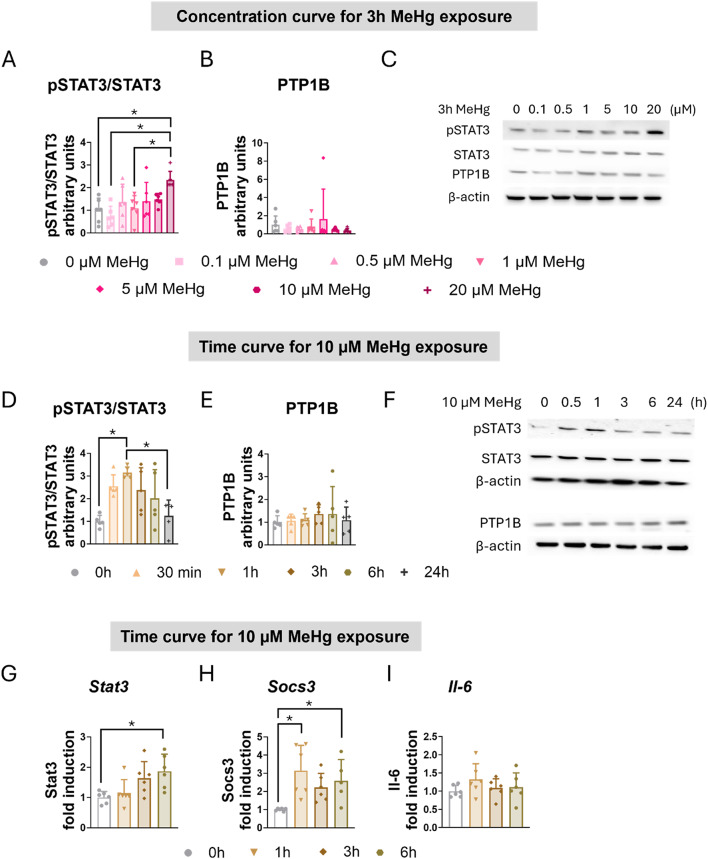
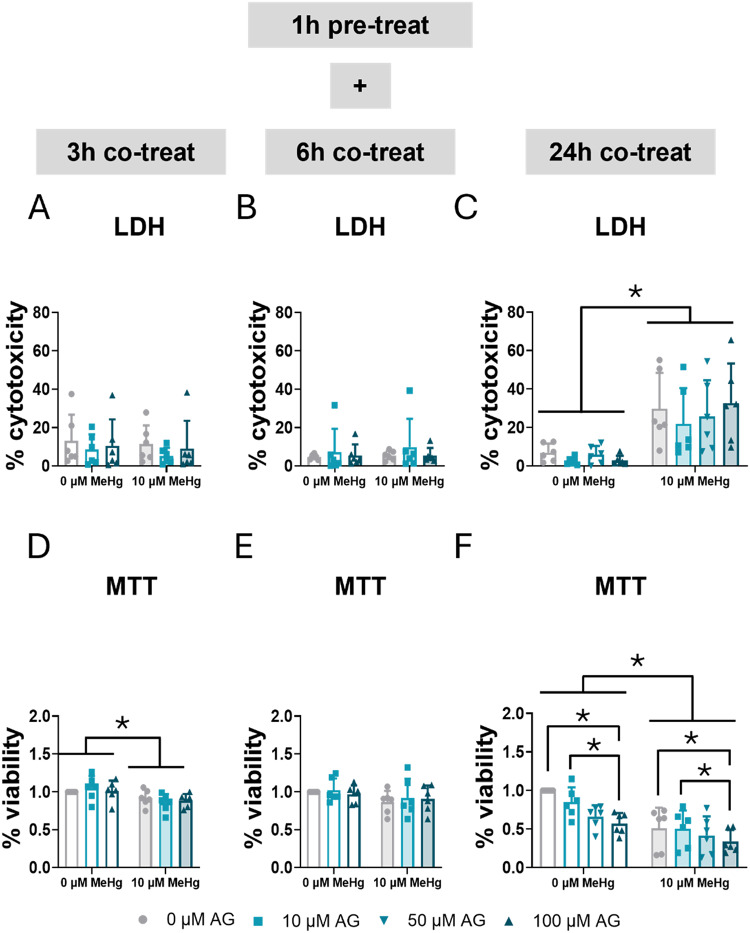
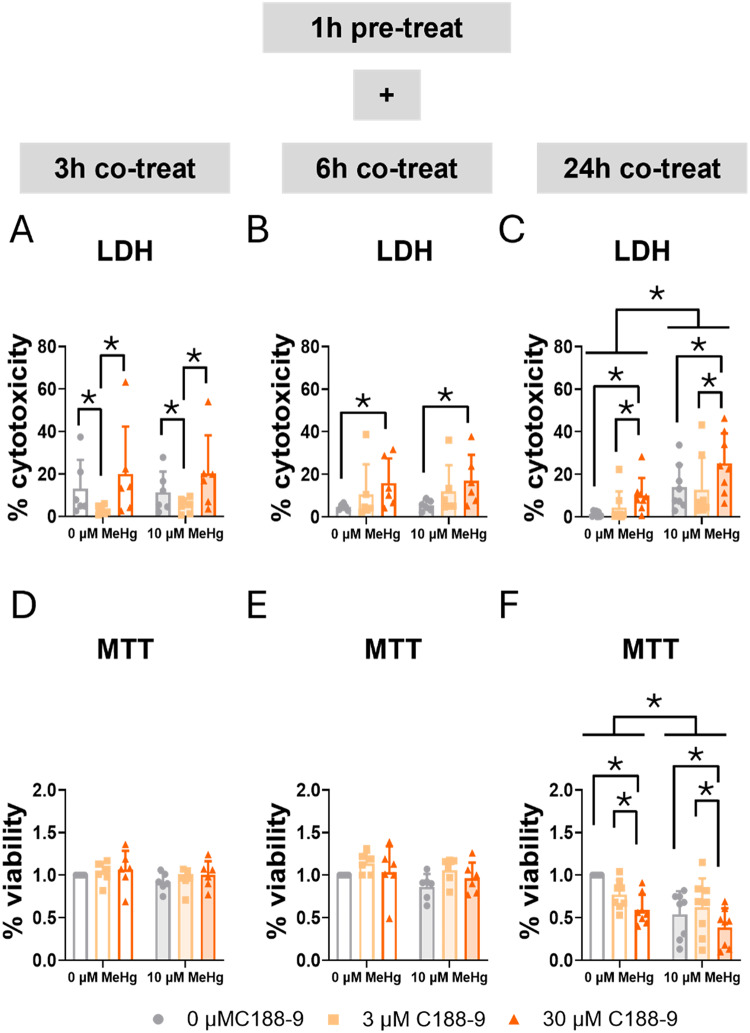
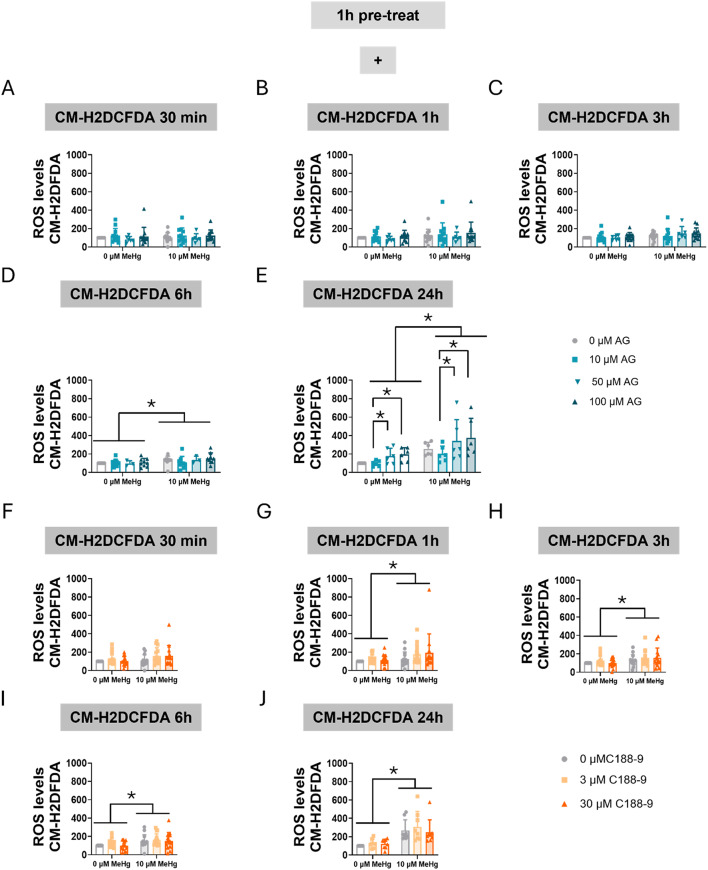
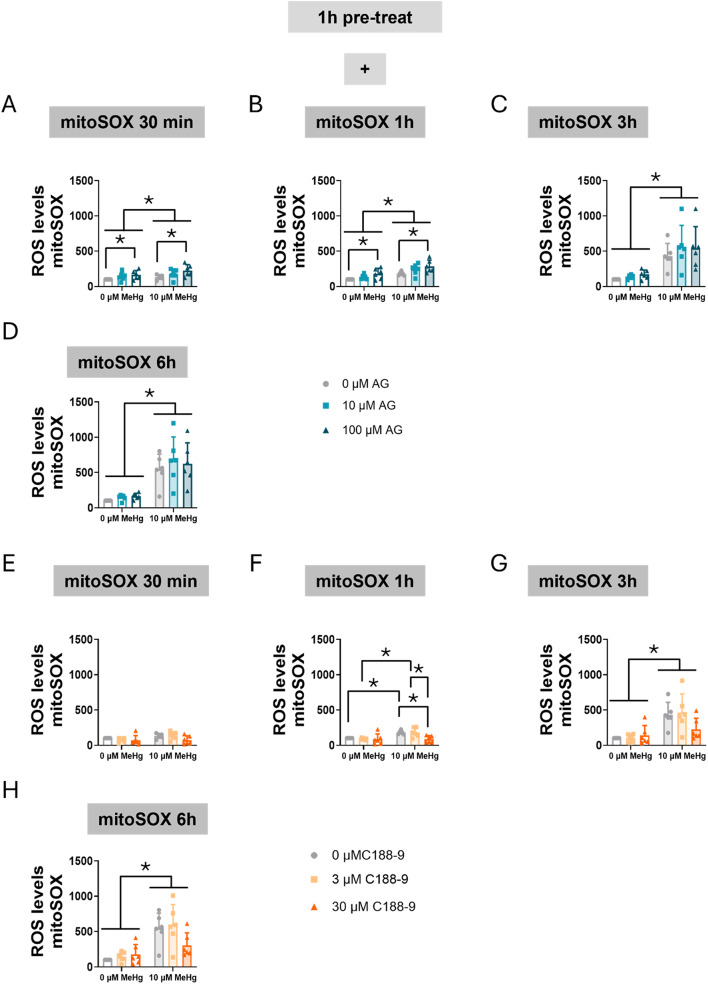
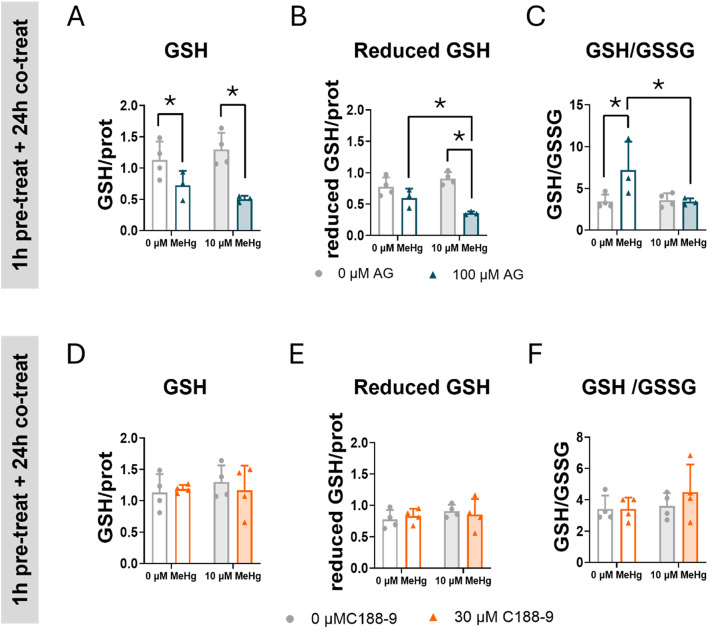
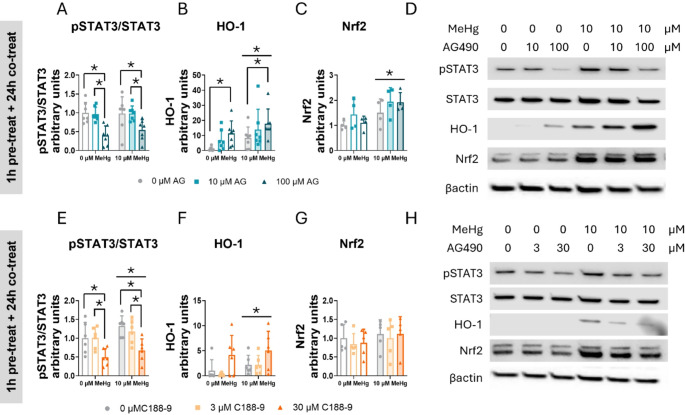
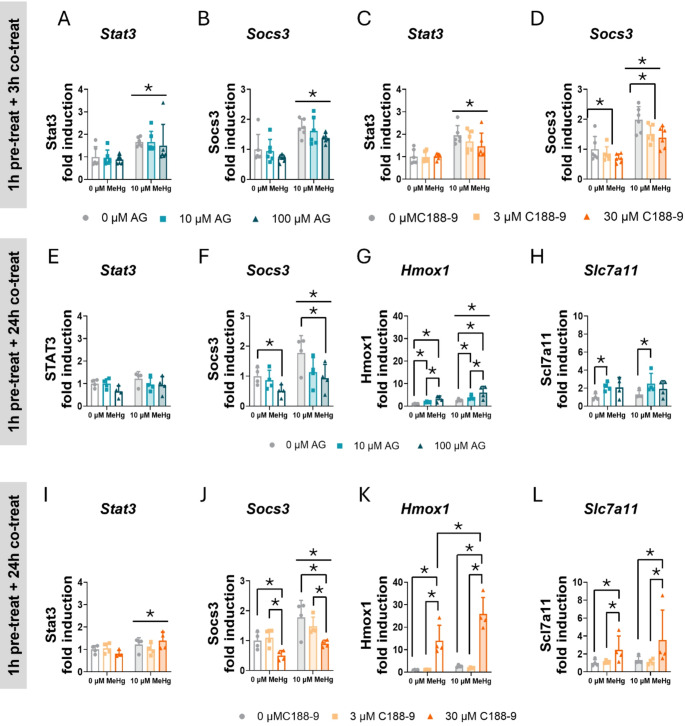
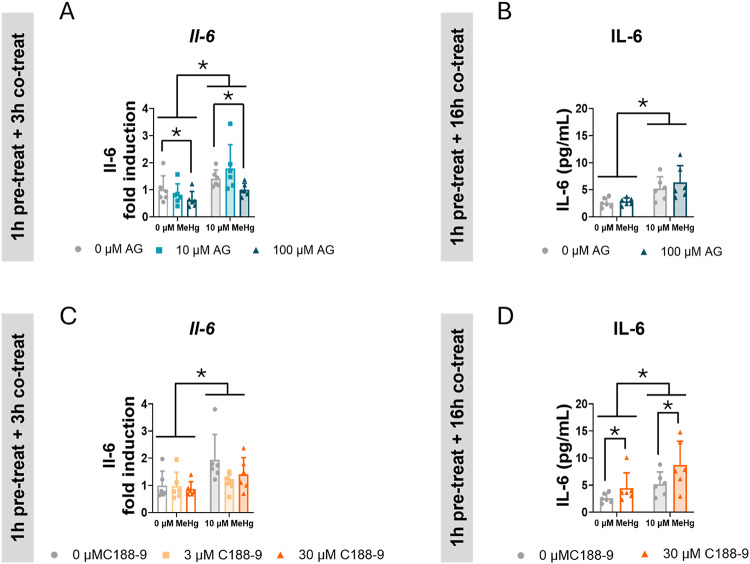
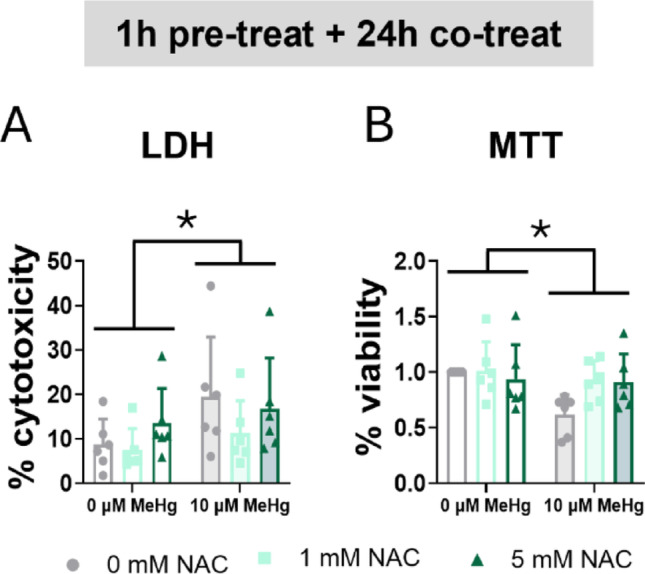
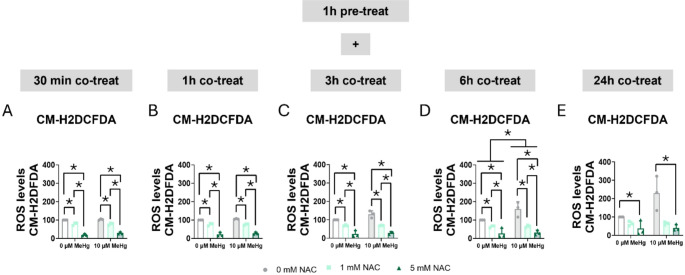
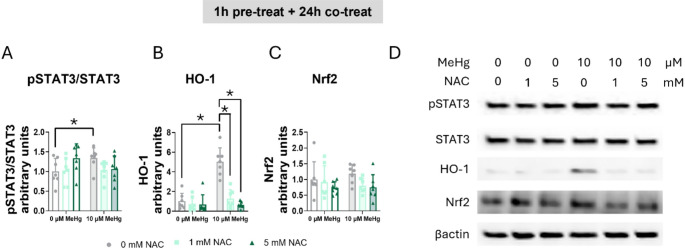
Methylmercury (MeHg), an environmental pollutant, reaches the human body predominantly through contaminated fish consumption, potentially leading to severe neurological disorders. Upon ingestion MeHg reaches the brain and selectively accumulates in astrocytes. The activation of nuclear factor erythroid 2-related factor 2 (Nrf2) has been identified as a key early response to MeHg-induced oxidative injury, positioning it as a potential therapeutic target. However, recent studies suggest that Nrf2 activation alone may not be sufficient to mitigate MeHg toxicity, indicating the existence of other protective mechanisms. The signal transducer and activator of transcription 3 (STAT3) signaling pathway, known for its role in cell growth and survival, has emerged as a potential player in redox homeostasis. In this study, we investigated the role of STAT3 in acute (≤ 24 h) MeHg-induced neurotoxicity. MeHg exposure induced STAT3 expression in C8-D1A astrocytic cells. Our data demonstrated that pharmacological inhibition of STAT3 using AG490 or C188-9 exacerbated MeHg-induced cell death and compromised antioxidant responses. Furthermore, to fully characterize the role of STAT3 in oxidative stress, we used two different antioxidants, N-acetylcysteine (NAC) and Trolox. Conversely, reactive oxygen species (ROS)-scavenging antioxidants partially ameliorated STAT3 activation, suggesting that MeHg-induced STAT3 activation is mediated, at least in part, by mechanisms independent of ROS. Our findings suggest that STAT3 contributes to neuroprotection against MeHg exposure in astrocytes and is, at least in part, regulated by the increase in ROS levels within these cells.

Keywords: Astrocytes; Inflammation; Methylmercury; Neurotoxicity; Oxidative stress.


Conflict of interest statement

Declarations. Competing Interests: The authors declare no competing interests.

Figures

Fig. 1
Fig. 1
MeHg reduced cell viability and induced oxidative stress in C8-D1A astrocytic cells. Astrocytic C8-D1A cells were treated with MeHg (0, 0.1, 0.5, 1, 5, 10, or 20 µM). Cytotoxicity (A) and cell viability (B) were measured at 24 h using LDH and MTT assays, respectively. Total ROS production was measured at 3 h using the CM-H2DCFDA probe (C), and mitochondrial ROS production was measured using the MitoSOX probe (D). Data are presented as mean ± SD. Statistical significance was determined using one-way ANOVA followed by Bonferroni’s post-hoc analysis, or with the Kruskal-Wallis test followed by Dunn’s post hoc test, adjusted by Bonferroni correction when normality was not achieved. p < 0.05 was considered statistically significant, * denotes a significant difference
Fig. 2
Fig. 2
MeHg induced the expression of antioxidant enzymes in C8-D1A astrocytic cells. Astrocytic C8-D1A cells were treated with MeHg (0, 0.1, 0.5, 1, 5, 10, or 20 µM). Western blot analysis was used to measure changes in the antioxidant proteins Nrf2 (A), KEAP1 (B), HO-1 (C), and SOD2 (D) in C8-D1A cells exposed to 10 µM MeHg for 30 min, 1, 3, 6, or 24 h. (E) shows representative densitometry images. Hmox1 (F), Nqo1 (G), Sod2 (H), and Slc7a11 (I) gene expression were measured using qPCR in cells exposed to 10 µM MeHg for 1, 3, or 6 h. Data are presented as mean ± SD. Statistical significance was determined using one-way ANOVA followed by Bonferroni’s post-hoc analysis, or with the Kruskal-Wallis test followed by Dunn’s post hoc test, adjusted by Bonferroni correction when normality was not achieved. p < 0.05 was considered statistically significant, * denotes a significant difference
Fig. 3
Fig. 3
MeHg induced STAT3 activation in C8-D1A astrocytic cells. For the concentration curve, C8-D1A astrocytic cells were treated with MeHg (0, 0.1, 0.5, 1, 5, 10, or 20 µM) for 3 h. The ratio of phosphorylated to total STAT3 (A) was calculated, and PTP1B (B) protein levels were measured using western blot analysis. (C) shows representative densitometry images. For the time curve, C8-D1A astrocytic cells were treated with 10 µM MeHg for 30 min, 1, 3, 6, or 24 h. The ratio of phosphorylated to total STAT3 (D) was calculated, and PTP1B (E) protein levels were measured using western blot analysis. (F) shows representative densitometry images. Stat3 (G), Socs3 (H), and Il-6 (I) gene expression were measured using qPCR in cells exposed to 10 µM MeHg for 1, 3, or 6 h. Data are presented as mean ± SD. Statistical significance was determined using one-way ANOVA followed by Bonferroni’s post-hoc analysis, or with the Kruskal-Wallis test followed by Dunn’s post hoc test, adjusted by Bonferroni correction when normality was not achieved. p < 0.05 was considered statistically significant. * denotes a significant difference
Fig. 4
Fig. 4
Inhibition of STAT3 phosphorylation exacerbated mortality in C8-D1A astrocytic cells. Cells were pretreated with 0, 10, 50, or 100 µM AG490, followed by co-treatment with 0 or 10 µM MeHg. Cytotoxicity (LDH release) was measured using LDH at 3 h (A), 6 h (B), and 24 h (C) of MeHg addition. Cell viability was assessed using MTT at 3 h (D), 6 h (E), and 24 h (F) of MeHg addition. Data are presented as mean ± SD. Statistical significance was determined using two-way ANOVA followed by Bonferroni’s post-hoc analysis. When data did not meet the assumptions of normality, a logarithmic or square root transformation was employed before conducting the two-way ANOVA. p < 0.05 was considered statistically significant. * denotes a significant difference
Fig. 5
Fig. 5
Blocking STAT3 SH2 domain increases mortality in C8-D1A astrocytic cells. Cells were pretreated with 0, 3, or 30 µM C188-9, followed by co-treatment with 0 or 10 µM MeHg. Cytotoxicity (LDH release) was measured using LDH at 3 h (A), 6 h (B), and 24 h (C) of MeHg addition. Cell viability was assessed using MTT at 3 h (D), 6 h (E), and 24 h (F) of MeHg addition. Data are presented as mean ± SD. Statistical significance was determined using two-way ANOVA followed by Bonferroni’s post-hoc analysis. When data did not meet the assumptions of normality, a logarithmic or square root transformation was employed before conducting the two-way ANOVA. p < 0.05 was considered statistically significant. * denotes a significant difference
Fig. 6
Fig. 6
Inhibition of STAT3 phosphorylation increases oxidative stress in C8-D1A astrocytic cells. Cells were pretreated with 0, 10, 50, or 100 µM AG490 (A-E) or with 0, 3, or 30 µM C188-9 (F-J), followed by co-treatment with 0 or 10 µM MeHg. ROS production was measured using CM-H2DCFDA probe after MeHg addition at 30 min (A, F), 1 h (B, G), 3 h (C, H), 6 h (D, I), and 24 h (E, J). Data are presented as mean ± SD. Statistical significance was determined using two-way ANOVA followed by Bonferroni’s post-hoc analysis. When data did not meet the assumptions of normality, a logarithmic or square root transformation was employed before conducting the two-way ANOVA. p < 0.05 was considered statistically significant. * denotes a significant difference
Fig. 7
Fig. 7
Inhibition of STAT3 phosphorylation increases mitochondrial oxidative stress in C8-D1A astrocytic cells. Cells were pretreated with 0, 10, 50, or 100 µM AG490 (A-D) or with 0, 3, or 30 µM C188-9 (F-H), followed by co-treatment with 0 or 10 µM MeHg. Mitochondrial superoxide production was assessed using mitoSOX fluorescent staining, after MeHg addition at 30 min (A, E), 1 h (B, F), 3 h (C, G), and 6 h (D, H). Data are presented as mean ± SD. Statistical significance was determined using two-way ANOVA followed by Bonferroni’s post-hoc analysis. When data did not meet the assumptions of normality, a logarithmic or square root transformation was employed before conducting the two-way ANOVA. p < 0.05 was considered statistically significant. * denotes a significant difference
Fig. 8
Fig. 8
Inhibition of STAT3 phosphorylation exacerbates GSH depletion in C8-D1A astrocytic cells. Cells were pretreated with 0 or 100 µM AG490 (A, B, C) or with 0 or 30 µM C188-9 (D, E, F), followed by co-treatment with 0 or 10 µM MeHg. Total GSH (A, D) reduced GSH (B, C), and GSH/GSSG ratio were measured at 24 h after adding MeHg. Data are presented as mean ± SD. Statistical significance was determined using two-way ANOVA followed by Bonferroni’s post-hoc analysis. When data did not meet the assumptions of normality, a logarithmic or square root transformation was employed before conducting the two-way ANOVA. p < 0.05 was considered statistically significant. * denotes a significant difference
Fig. 9
Fig. 9
STAT3 inhibition induces aberrant antioxidant enzyme expression in C8-D1A astrocytic cells. Cells were pretreated with 0, 10, or 100 µM AG490 or with 0 or 30 µM C188-9, followed by 24 h of co-treatment with 0 or 10 µM MeHg. Protein levels of phosphorylated STAT3 to total STAT3 ratio (pSTAT3/STAT3) (A, E), HO-1 (B, F), and Nrf2 (C, G) were measured by western blot. Representative densitometry images are shown in (D, H). Data are presented as mean ± SD. Statistical significance was determined using two-way ANOVA followed by Bonferroni’s post-hoc analysis. When data did not meet the assumptions of normality, a logarithmic or square root transformation was employed before conducting the two-way ANOVA. P < 0.05 was considered statistically significant. * denotes a significant difference
Fig. 10
Fig. 10
STAT3 inhibition induces aberrant antioxidant gene expression in C8-D1A astrocytic cells. Cells were pretreated with 0, 10, or 100 µM AG490 or with 0 or 30 µM C188-9, followed by 24 h of co-treatment with 0 or 10 µM MeHg. Gene expression of Stat3 (A, C) and Socs3 (B, D) at 3 h, and Stat3 (E, I), Socs3 (F, J), Hmox1 (G, K), and Slc7a11 (H, L) at 24 h was measured by qPCR. Data are presented as mean ± SD. Statistical significance was determined using two-way ANOVA followed by Bonferroni’s post-hoc analysis. When data did not meet the assumptions of normality, a logarithmic or square root transformation was employed before conducting the two-way ANOVA. p < 0.05 was considered statistically significant. * denotes a significant difference
Fig. 11
Fig. 11
STAT3 inhibition did not prevent MeHg IL-6 release in C8-D1A astrocytic cells. Cells were pretreated with 0, 10 or 100 µM AG490 (A, B) or with 0, 3, or 30 µM C188-9 (C, D), followed by co-treatment with 0 or 10 µM MeHg. Il-6 mRNA expression (A, C) was measured by qPCR at 3 h after adding MeHg. IL-6 release into the medium (B, D) was measured at 16 h after adding MeHg Data are presented as mean ± SD. Statistical significance was determined using two-way ANOVA followed by Bonferroni’s post-hoc analysis. When data did not meet the assumptions of normality, a logarithmic or square root transformation was employed before conducting the two-way ANOVA. p < 0.05 was considered statistically significant. * denotes a significant difference
Fig. 12
Fig. 12
N-acetylcysteine failed to counteract MeHg-induced cytotoxicity. Cells were pretreated with 0, 1, or 5 mM NAC, followed by co-treatment with 0 or 10 µM MeHg. (A) Cytotoxicity was measured using LDH assay after 24 h of MeHg addition. (B) Cell viability was assessed by MTT assay after 24 h of MeHg addition. Data are presented as mean ± SD. Statistical significance was determined using two-way ANOVA followed by Bonferroni’s post-hoc analysis. When data did not meet the assumptions of normality, a logarithmic or square root transformation was employed before conducting the two-way ANOVA. p < 0.05 was considered statistically significant. * denotes a significant difference
Fig. 13
Fig. 13
N-acetylcysteine reduced MeHg-induced ROS production. Cells were pretreated with 0, 1, or 5 mM NAC, followed by co-treatment with 0 or 10 µM MeHg. ROS levels were measured using CM-H2DCFDA probe at 30 min (A), 1 h (B), 3 h (C), 6 h (D), and 24 h (E) after MeHg addition. Data are presented as mean ± SD. Statistical significance was determined using two-way ANOVA followed by Bonferroni’s post-hoc analysis. When data did not meet the assumptions of normality, a logarithmic or square root transformation was employed before conducting the two-way ANOVA. p < 0.05 was considered statistically significant. * denotes a significant difference
Fig. 14
Fig. 14
MeHg-induced STAT3 phosphorylation was partially mediated by ROS. Cells were pretreated with 0, 1, or 5 mM NAC, followed by co-treatment with 0 or 10 µM MeHg. (A) phosphorylated STAT3 to total STAT3 ratio, (B) HO-1, and (C) Nrf2 protein levels were measured by western blot 24 h after MeHg addition. (D) shows representative densitometry images. Data are presented as mean ± SD. Statistical significance was determined using two-way ANOVA followed by Bonferroni’s post-hoc analysis. When data did not meet the assumptions of normality, a logarithmic or square root transformation was employed before conducting the two-way ANOVA. p < 0.05 was considered statistically significant. * denotes a significant difference

Update of

Similar articles

References

    1. W. World Health Organization, Mercury and health, (2017)
    1. Depew DC, Burgess NM, Campbell LM (2013) Spatial patterns of Methylmercury risks to common loons and piscivorous fish in Canada. Environ Sci Technol 47:13093–13103 - PubMed
    1. Wren CD (1986) A review of metal accumulation and toxicity in wild mammals. I. Mercury. Environ Res 40:210–244 - PubMed
    1. E. Environmental Protection Agency, Basic Information about Mercury, (2023)
    1. Cariccio VL, Sama A, Bramanti P, Mazzon E (2019) Mercury involvement in neuronal damage and in neurodegenerative diseases. Biol Trace Elem Res 187:341–356 - PubMed

LinkOut - more resources