. 2025 Aug 13;25(1):291.
doi: 10.1007/s10238-025-01807-8.

Metabolic reprogramming of arachidonic acid in clear cell renal carcinoma promotes an immunosuppressive microenvironment by activating MDK signaling pathway

Affiliations

Metabolic reprogramming of arachidonic acid in clear cell renal carcinoma promotes an immunosuppressive microenvironment by activating MDK signaling pathway

Jiaxi Yao et al. Clin Exp Med. .

Abstract

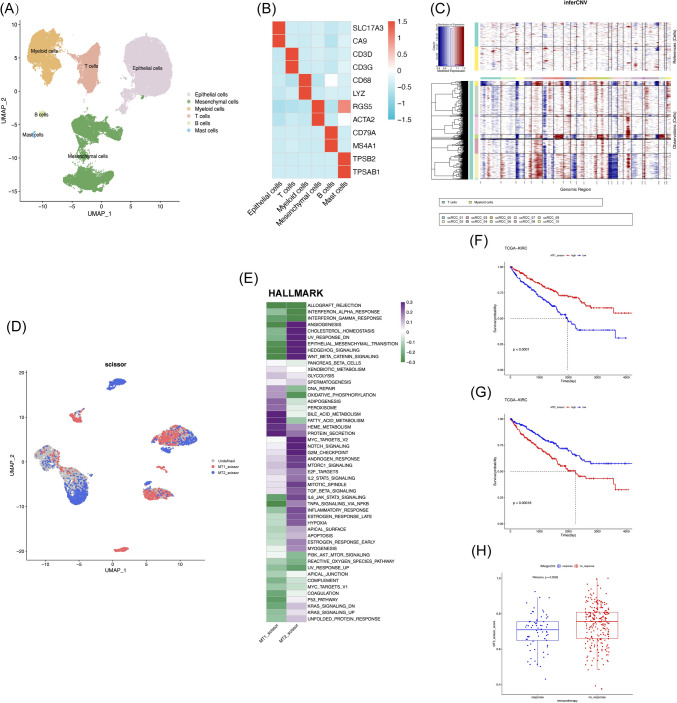
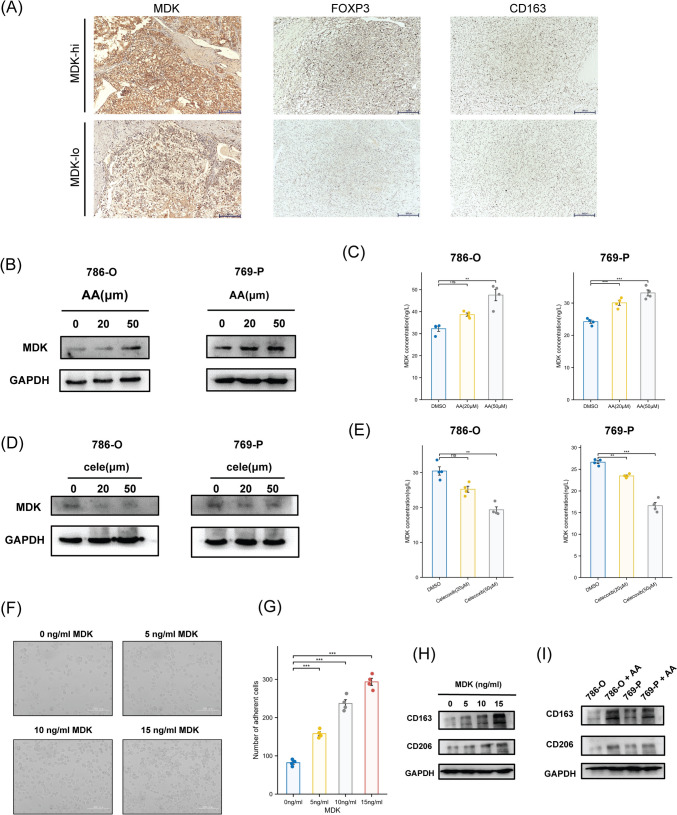
Metabolic reprogramming is a key feature of clear cell renal cell carcinoma (ccRCC), and metabolic abnormality can lead to significant changes in gene expression, resulting in the immunosuppressive microenvironment. In this study, we used a combination of single-cell RNA sequencing and bulk RNA sequencing to investigate the relationships between ccRCC metabolic reprogramming and immune exhaustion. Metabolic subtypes of ccRCC patients were constructed using bulk RNA sequencing. Tumor cells of different metabolic subtypes were analyzed and extracted by the Scissor algorithm, using single-cell RNA sequencing. The molecular mechanisms of abnormal metabolic regulating tumor immunity were explored using cell-cell communication analysis. In addition, the correlations between relevant molecules and immune exhaustion signals were verified in ccRCC by immunohistochemistry. The molecular mechanisms of metabolic abnormalities leading to immune exhaustion were validated via Western blotting, ELISA, cell co-culture and immunotherapy models. ccRCC patients can be divided into MT1 and MT2 metabolic subtypes. The MT2 subtype has a poorer prognosis and lower response to immunotherapy. Abnormal metabolism of arachidonic acid is a prominent feature of the MT2 subtype, and activates the MDK signaling pathway. As a secreted protein, MDK can further recruit immunosuppressive cells, such as Treg, Tex, and TAM. Blocking the arachidonic acid COX metabolic pathway significantly reduces the expression and secretion levels of MDK, thereby reprogramming the tumor microenvironment to promote anti-tumor immunity. Abnormal metabolism of arachidonic acid plays an important role in promoting immune exhaustion by activating the MDK signaling pathway. MDK may serve as an important biomarker for predicting the immune therapy response in ccRCC. By reducing MDK secretion, targeting blockade of arachidonic acid metabolism may be an effective treatment strategy to enhance the efficacy of immunotherapy in ccRCC.

Keywords: Arachidonic acid; Clear cell renal cell carcinoma; Immunotherapy combined therapy; MDK; Metabolic reprogramming.


Conflict of interest statement

Declarations. Conflict of interest: The authors declare no competing interests.

Figures

Fig. 1
Fig. 1
Metabolic reprogramming reshapes the tumor immune microenvironment in ccRCC patients. A The technical route of this article. B NMF algorithm recognizes two different metabolic subtypes (MT1, MT2) in TCGA-KIRC. C Kaplan–Meier curves for overall survival in MT1 and MT2 subtypes (log-rank test, p value < 0.0001). D MT1 and MT2 two metabolic groups have different metabolic landscapes. E The box plot shows the infiltration fraction of 22 different immune cells in two different subtypes of ccRCC patients. (ns, no significance, *P < 0.05, **P < 0.01, ***P < 0.001) in the TCGA-KIRC cohort. F GO_BP enrichment analysis of DEGs between MT1 and MT2. The red columns represent the pathway activated in MT1 patients, while the blue columns represent the pathway activated in MT2 patients
Fig. 2
Fig. 2
scRNA-seq combined with bulk RNA-seq reveals representative cells of different metabolic subtypes. A UMAP plot of scRNA-seq dataset, with different colors representing different cell types. B Heatmaps display the expression level of representative marker genes in each cell type. Blue represents relatively low expression levels, while red represents high expression level. C The inferred CNV scores of each tumor sample’s epithelial cells, with red indicating high CNV levels and blue indicating low CNV levels. D The Scissor algorithm identifies two types of tumor cells that are most related to two metabolic subtypes (MT1 and MT2). The blue dot represents the representative cell of the MT1 type patient (MT1_scissor), and the red dot represents the representative cell of the MT2 type patient (MT2_scissor). E Activation of the HALLMARK pathway in MT1_scissor and MT2_scissor cells were assessed by GSVA. F High proportion of MT2_scissor cells in tumors will significantly reduce the overall survival rate of ccRCC patients (log-rank test, p value < 0.0001). G Low proportion of MT1_scissor cells in tumors will significantly reduce the overall survival rate of ccRCC patients (log-rank test, p value = 0.00018). H The proportion of the MT2_scissor cells in the immunotherapy response (response) and no-response groups (no_response) using the IMvigor210 cohort (Wilcoxon, p = 0.0026). The no-response group had a higher MT2_scissor proportion
Fig. 3
Fig. 3
MT2_scissor cells promote T cell exhaustion through multiple mechanisms. A UMAP plots show clusters of T cells subtypes. Different colors indicate different subtypes of T cells. B Heatmap shows the expression levels of marker genes in each T cells subtypes. C Relative strength of outcoming signaling pathways. D Relative strength of incoming signaling pathways. EG MT2_scissor specifically activates the MDK, CD79, and SPP1 signaling pathways during the interaction between the tumor cells and T cells subgroups. H Spearman correlation analysis between MT1_scissor cells and Treg and Tex in the TCGA-KIRC cohort. J Spearman correlation analysis between MT2_scissor cells and Treg and Tex in the TCGA-KIRC cohort
Fig. 4
Fig. 4
MT2_scissor cells recruit a variety of immunosuppressive tumor-associated macrophages (TAM). A UMAP plots show clusters of myeloid cells subtypes. Different colors indicate different subtypes of myeloid cells. B Heatmap shows the expression levels of marker genes in each myeloid cells subtypes. C GSVA scores of M1-like and M2-like macrophages markers for 6 types of TAMs. D Relative strength of outcoming signaling pathways. E Relative strength of incoming signaling pathways. FH MT2_scissor specifically activates the MDK, COMPLEMENT, and PROS signaling pathways during the interaction between the tumor cells and myeloid cells subgroups. I Spearman correlation analysis between MT1_scissor cells and TAMs in the TCGA-KIRC cohort. J Spearman correlation analysis between MT2_scissor cells and TAMs in the TCGA-KIRC cohort
Fig. 5
Fig. 5
MDK significantly promotes the disease progression and immune exhaustion of ccRCC. A The expression level of MDK in tumor tissues in TCGA-KIRC dataset was significantly higher than that in normal tissues (***P < 0.001). B The expression level of MDK significantly affects the overall survival rate of ccRCC (log-rank test, P value < 0.0001). C The expression level of MDK is highly negatively correlated with the proportion of MT1_scissor cells in tumor tissue (r = − 0.348, p < 0.001). D The expression level of MDK is highly positively correlated with the proportion of MT2_scissor cells in tumor tissues (r = − 0.472, p < 0.001). EH Correlation analysis of MDK expression levels with T stage (T1&T2 vs T3&T4), N stage (N0 vs N1), M stage (M0 vs M1), and pathological grading (stage I&II vs stage III&IV) in ccRCC. I The correlation between MDK and Treg, Tex cells in the TCGA-KIRC cohort. J The correlation between MDK and TAMs in the TCGA-KIRC cohort
Fig. 6
Fig. 6
MDK is highly correlated with metabolic abnormalities and inflammatory responses in ccRCC. A MDK expression level and metabolic pathways enrichment score heatmap in the TCGA-KIRC dataset. B There is a strong correlation between the expression level of MDK and arachidonic acid metabolism (r = 0.305, p < 0.001). C There is a strong correlation between the expression level of MDK and prostaglandin biosynthesis (r = 0.328, p < 0.001). D Correlation between MDK expression level and inflammatory factors (CSF1, IL2RA, IFNG, IL10, CXCL8, TNF). E The GSEA plot shows a strong between high expression of MDK and co-activation of cytokine interactions, arachidonic acid metabolism, and prostaglandin biosynthesis pathways in TCGA-KIRC
Fig. 7
Fig. 7
AA metabolism promotes MDK expression and induces immune suppression A Representative images of IHC staining with anti-MDK, anti-FOXP3 and anti-CD163. B The protein level of MDK of 786-O and 769-P cells were detected after treated with different concentrations of AA (0, 20, 50 µm). C The secretion level of MDK in media of 786-O and 769-P cells were detected by ELISA kit after treated with different concentrations of AA (0, 20, 50 µm). D The protein level of MDK of 786-O and 769-P cells were detected after treated with different concentrations of Celecoxib (0, 20, 50 µm). E The secretion level of MDK in media of 786-O and 769-P cells were detected by ELISA kit after treated with different concentrations of Celecoxib (0, 20, 50 µm). FG 1 × 106 THP-1 human monocytes were seeded in 6-well plate and first treated with 150 nmol/L PMA for 24 h, and were then treated with different concentrations of MDK (0, 5, 10, 15 ng/ml) for 72 h. Number of adherent cells was statistically analyzed (Scale bar: 200 µm). H M2 macrophage markers (CD163, CD206) of THP-1 cells were detected after treated with different concentrations of MDK (0, 5, 10, 15 ng/ml). I M2 macrophage markers of THP-1 cells were detected after cocultured with 786-O and 769-P cells treated with AA
Fig. 8
Fig. 8
A A sketch map of tumor formation in BALB/c mice. Renca cells were injected into the left renal cortex of mice, after 7 days, PBS, AA and Celecoxib was intraperitoneal injected in different groups. BC Images of mice RCC tumors after orthotopic implantation for 6 weeks. DF Representative images of IHC staining for FOXP3 and CD206 in mice RCC tumors and HE staining of mice lungs. G The protein expression of CD206, TIM3, MDK in mice RCC tumors. H Elisa experiment detecting the secretion levels of MDK in peripheral blood of mice

Similar articles

References

    1. Sung H, et al. Global cancer statistics 2020: GLOBOCAN estimates of incidence and mortality worldwide for 36 cancers in 185 countries. CA Cancer J Clin. 2021;71:209–49. 10.3322/caac.21660. - PubMed
    1. Siegel RL, Miller KD, Fuchs HE, Jemal A. Cancer statistics, 2022. CA Cancer J Clin. 2022;72:7–33. 10.3322/caac.21708. - PubMed
    1. Barata PC, Rini BI. Treatment of renal cell carcinoma: current status and future directions. CA Cancer J Clin. 2017;67:507–24. 10.3322/caac.21411. - PubMed
    1. Hsieh JJ, et al. Renal cell carcinoma. Nat Rev Dis Primers. 2017;3:17009. 10.1038/nrdp.2017.9. - PMC - PubMed
    1. Montecillo-Aguado M, Tirado-Rodriguez B, Huerta-Yepez S. The involvement of polyunsaturated fatty acids in apoptosis mechanisms and their implications in cancer. Int J Mol Sci. 2023. 10.3390/ijms241411691. - PMC - PubMed

MeSH terms

Substances