. 2025 Aug 26;44(8):116141.
doi: 10.1016/j.celrep.2025.116141. Epub 2025 Aug 12.

Circadian clocks and periodic anticipated fasting prevent fasting-associated hepatic steatosis in calorie restriction

Affiliations

Circadian clocks and periodic anticipated fasting prevent fasting-associated hepatic steatosis in calorie restriction

Oghogho P Ebeigbe et al. Cell Rep. .

Abstract

Calorie restriction (CR) improves health and longevity. CR induces a periodic fasting cycle in mammals; our study compares CR with unanticipated fasting (F), when the food is unexpectedly withheld. F induces hepatic steatosis, whereas CR reduces it; surprisingly, the difference is not due to hepatic β-oxidation. Liver transcriptome analysis identifies fatty acid transporters (Slc27a1 and Slc27a2), triglyceride (TAG) synthesis (Gpat4), and lipid storage (Plin2 and Cidec) genes to be upregulated only in F, in agreement with hepatic steatosis. The circadian clock and anticipated fasting contribute to preventing fasting-associated hepatic steatosis in CR. Mechanistically, the Slc27a1, Plin2, and Cidec genes are upregulated, and liver TAGs accumulate in circadian clock mutant mice on CR or if wild-type CR mice miss their anticipated meal. The results highlight the similarities and differences between F and CR, suggesting that circadian clock-dependent gating of transcriptional response to fasting controls lipid homeostasis and prevents hepatic steatosis.

Keywords: CP: Metabolism; Calorie restriction; circadian clock; circadian rhythms; dietary intervention; fasting; fatty acid metabolism; lipid metabolism; steatosis; triglyceride.


Conflict of interest statement

Declaration of interests The authors declare no competing interests.

Figures
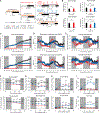
Figure 1.
Figure 1.. Effect of F and CR diets on mice physiology
(A) Experimental design for AL (black), CR (red), and F (blue), for both male and female mice. AL group had unlimited access to the meal for 5 months, CR mice were 30% calorie restricted for 2 months, and F group was fed AL for 5 months and fasted for a single day. Sample analysis was performed following the time without food in CR and F mice. (B) The body weight of 3-month-old female and male mice assigned to AL (n = 48) and CR (n = 24) diets, and the body weight of 5-month-old AL (n = 24), CR (n = 24), and F (n = 24) at the start of the experiment. (C–E) Hourly measurements of food consumption (C), RER (D), and energy expenditure (E) before and after the time without food; n = 5 per diet per time point. (F) Percentage of body weight decline following the time without food. Initial body weight is shown on Figure 1B at 5 months of age; n = 5 per diet per time point. (G) Blood glucose concentration in both sexes; n = 6 per diet per time point. (H) Serum nonesterified fatty acid (NEFA) concentration in both sexes; n = 3 per diet per time point. (I) Liver triglyceride (TAG) concentration in both sexes; n = 3 per diet per time point. RER and energy expenditure are represented as mean ± SEM; all other data are represented as mean ± SD. Statistical analysis in Figure 1B (left panel) was performed with t test, ns = not significant. Figure 1B (right panel) was analyzed with one way ANOVA, **p ≤ 0.01, ***p ≤ 0.001. Figures 1F–1I were analyzed with two-way ANOVA, p ≤ 0.05 for a, AL versus CR; b, AL versus F; and c, CR versus F.
Figure 2.
Figure 2.. Hepatic fatty acid oxidation is stronger in F than in CR mice
(A) Schematic of mitochondrial fatty acid oxidation. MTP denotes mitochondrial trifunctional protein, comprising HADHA and HADHB. (B and C) Mitochondrial fatty acid oxidation between diets in female (B) and male mice (C). mRNA expression of rate-limiting genes for β-oxidation (Cpt1a) and ketogenesis (Hmgcs2) and blood β-hydroxybutyrate (β-HB) were assayed in all groups; n = 3 per diet per time point, mean ± SD. All diets were normalized to the relative expression of AL at 0 h time point. (D) mRNA expression of Pparα, the master regulator of hepatic fatty acid oxidation; n = 3 per diet per time point, mean ± SD. (E and F) Heatmap of β-oxidation and ketogenesis genes (E) and PPARα target genes (F); n = 3 per diet per time point. Statistical analysis was performed with two-way ANOVA, p ≤ 0.05 for a, AL versus CR; b, AL versus F; and c, CR versus F.
Figure 3.
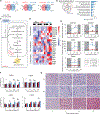
Figure 3.. Hepatic fatty acid transport, TAG synthesis, and lipid storage are significantly different between CR and F
(A and B) RNA-seq analysis: Venn diagram for DEGs between CR and F diets at each time point (A), and bar graph of gene ontology pathway analysis of F-specific DEGs upregulated at 6, 14, and 22 h time without food (B). The number of enriched genes in the pathway analysis is indicated on the bar chart. DEseq2 was performed using AL group as a control across each time point; n = 3 per diet per time point. (C) Schematic representation of the pathway for FFA transport, TAG synthesis, and lipid storage. (D) Heatmap of lipid metabolism genes involved in FFA transport, TAG synthesis, and lipid storage (RNA-seq data); n = 3 per diet per time point per. (E) mRNA expression (RNA-seq) of upregulated F-specific DEGs that were identified in Figure 3B; n = 3 per diet per time point, mean ± SEM. (F) Liver free fatty acid (FFA) concentration; n = 3 per diet per time point, mean ± SD. Statistical analysis was performed with two-way ANOVA, p <0.05 for a, ALversus CR; b, AL versus F; c, CR versus F. (G) Liver lipid droplet staining images.
Figure 4.
Figure 4.. Missed daily periodic meal impacts CR liver lipid homeostasis and induces lipid accumulation
(A) CR feeding plan was modified to test for food anticipation; CRbm represents the time point before the anticipated meal, CRfed represents fed CR mice, and CRmm represents CR mice with the missed meal. (B and C) Measurements of RER (B) and energy expenditure (C) in CRfed and CRmm mice; n = 5 per diet per time point. (D) Body weight of mice in all three groups; n = 10 per diet per time point, mean ± SD. (E) Blood glucose (n = 6 per diet per time point) and serum NEFA (n = 3 per diet per time point) concentration; mean ± SD. (F) Liver FFA concentration; n = 3 per diet per time point, mean ± SD. (G) Liver and blood β-HB concentration; n = 3 per diet per time point, mean ± SD. (H) Liver TAG concentration; n = 3 per diet per time point, mean ± SD. (I) Liver lipid droplet staining and quantification to evaluate TAG storage; n = 5 per diet per time point, mean ± SD. (J) Gene expression (RNA-seq) for liver lipid metabolism genes that were identified in the F-specific subset in Figure 3E; n = 3 per diet per time point, mean ± SEM. Statistical analysis was performed with one way ANOVA, *p ≤ 0.05, **p ≤ 0.01, ***p ≤ 0.001, ****p ≤ 0.0001, ns = not significant.
Figure 5.
Figure 5.. Circadian clock disruption affects CR liver lipid homeostasis
(A) Blood glucose and serum NEFA concentration in wild-type and cryptochrome knockout (Cry1,2−/−) mice; n = 6 per diet per time point for blood glucose concentration, and n = 3 per diet per time point for serum NEFA concentration; mean ± SD. (B) Liver FFA concentration in WT and Cry1,2−/− mice; n = 3 per diet per time point, mean ± SD. (C) Liver β-HB and liver TAG concentration in WT and Cry1,2−/− mice; n = 3 per diet per time point, mean ± SD. (D) Gene expression (RT-qPCR) for liver lipid metabolism genes in WT and Cry1,2−/− mice; n = 3 per diet per time point, mean ± SD. (A–D) Statistical analysis was performed with two-way ANOVA, p ≤ 0.05 for a, WT AL versus WT CR; b, WT AL versus Cry1,2−/− AL; c, WT AL versus Cry1,2−/− CR; d, WT CR versus Cry1,2−/− AL; e, WT CR versus Cry1,2−/− CR; and f, Cry1,2−/− AL versus Cry1,2−/− CR. (E) Model of circadian clock–dependent gating of liver lipid metabolism. With the initiation of fasting, blood glucose and insulin are reduced and NEFAs are released as a result of fat mobilization in adipose tissue. Fasting hormones are increased in the blood and cause the activation of fasting-associated transcriptional factors (FATF) such as PPARα, CREB, GR, and FOXO. Depending on the complex composition, the circadian clock transcriptional complex serves as either an activator or a suppressor of transcription, thus enhancing or attenuating the transcription and fasting response.

References

    1. Zhang S, Ji B, Yang C, and Yang L (2023). Hepatic Lipid Homeostasis in NAFLD. In Non-alcoholic Fatty Liver Disease - New Insight and Glance into Disease Pathogenesis (IntechOpen; ).
    1. Mitra S, De A, and Chowdhury A (2020). Epidemiology of non-alcoholic and alcoholic fatty liver diseases. Transl. Gastroenterol. Hepatol. 5, 16. 10.21037/TGH.2019.09.08. - DOI - PMC - PubMed
    1. Nassir F (2022). NAFLD: Mechanisms, Treatments, and Biomarkers. Biomolecules 12, 824. 10.3390/biom12060824. - DOI - PMC - PubMed
    1. Risi R, Tuccinardi D, Mariani S, Lubrano C, Manfrini S, Donini LM, and Watanabe M (2021). Liver disease in obesity and underweight: the two sides of the coin. A narrative review. Eat. Weight Disord. 26, 2097–2107. 10.1007/s40519-020-01060-w. - DOI - PubMed
    1. Haigh L, Kirk C, El Gendy K, Gallacher J, Errington L, Mathers JC, and Anstee QM (2022). The effectiveness and acceptability of Mediterranean diet and calorie restriction in non-alcoholic fatty liver disease (NAFLD): A systematic review and meta-analysis. Clin. Nutr. 41, 1913–1931. 10.1016/j.clnu.2022.06.037. - DOI - PubMed

LinkOut - more resources