

Stabilized and unstabilized sampling methods result in differential fecal 16S rRNA microbial sequencing results
- PMID: 40802648
- PMCID: PMC12349053
- DOI: 10.1371/journal.pone.0324351
Stabilized and unstabilized sampling methods result in differential fecal 16S rRNA microbial sequencing results
Abstract
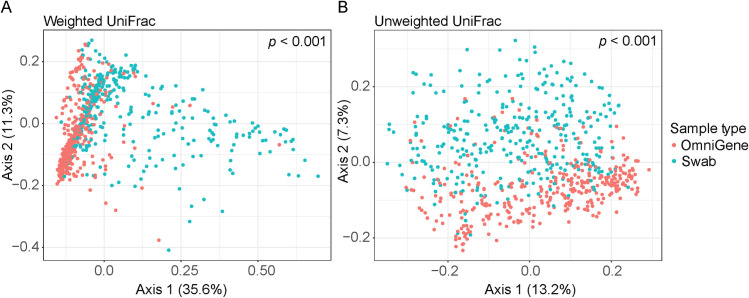
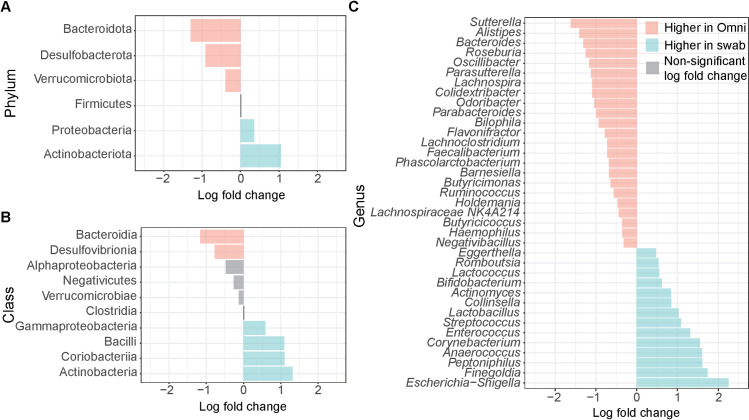
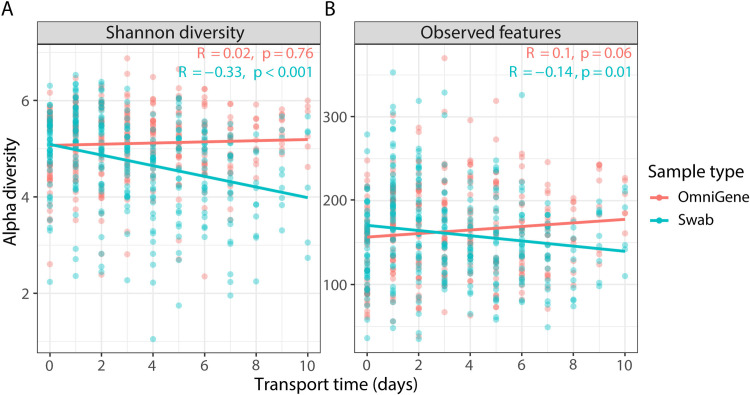
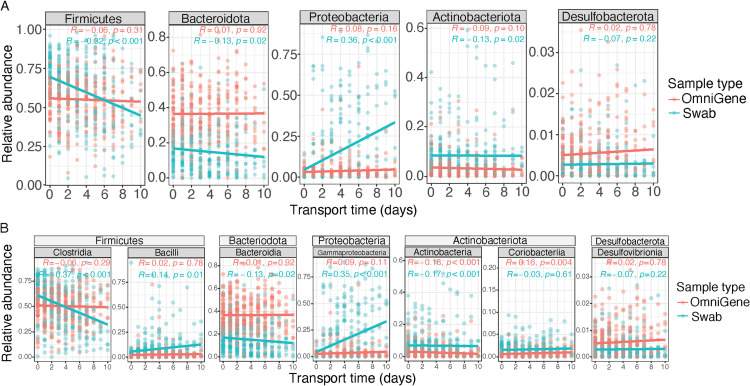
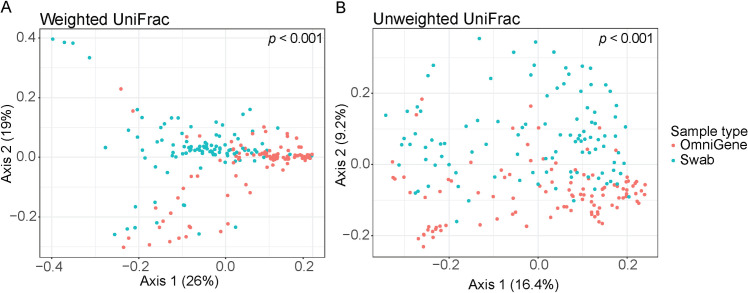
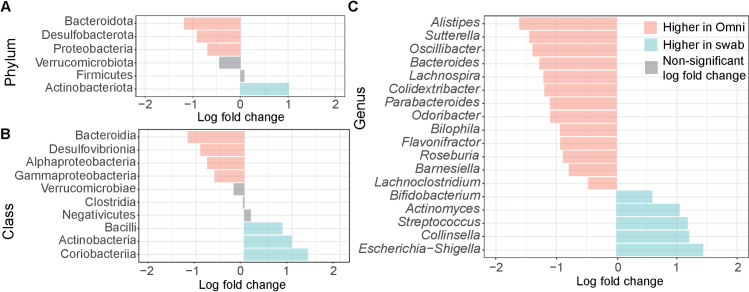
Over the past decade, studies have been conducted to increase the understanding of associations between the fecal microbiome and human health. In conjunction, researchers have investigated the effects of study design, methods, molecular processing, and sequencing techniques. However, a lack of standardization of fecal sample collection methodology has introduced heterogeneity in sequencing results. Sources of variability include sample collection methods, storage temperatures, and transport times. Here we present 16S rRNA gene amplicon sequencing results from two sample collection methods (unstabilized sterile swab and stabilized OmniGene Gut Kits) collected from the same fecal specimens. The paired samples were collected either at the research facility or the participants' home and ground shipped to the research facility at ambient temperature. Therefore, samples were exposed to variable temperatures and transport times. We found that fecal sample collection methods resulted in taxonomic and diversity differences that showed distinct patterns between swab and OmniGene samples. Swab samples were disproportionally affected by increased transport time, but differences in taxa and diversity were driven more by sample collection method, as compared to transport time. Based on previous studies, many of the taxa that were associated with sample collection methods and transport times have clinical relevance. Collectively, this research highlights: 1) the need for further standardization of methods for fecal microbiome studies; 2) limitations of direct comparisons between different fecal sample collection methods; and 3) the importance of careful consideration of sample collection methods for future studies and meta-analyses.
Copyright: This is an open access article, free of all copyright, and may be freely reproduced, distributed, transmitted, modified, built upon, or otherwise used by anyone for any lawful purpose. The work is made available under the Creative Commons CC0 public domain dedication.
Conflict of interest statement
Dr. Brenner reports grants from the VA, DOD, NIH, and the State of Colorado, editorial support from Wolters Kluwer, and royalties from the American Psychological Association, Oxford University Press, and the Rand Corporation. In addition, she consults with sports leagues via her university affiliation. Dr. Lowry is cofounder and member of the Scientific Advisory Board of Mycobacteria Therapeutics Corporation (Kioga), and is a member of the faculty of Clinical Care Options, LLC (CCO), Reston, Virginia, the Integrative Psychiatry Institute, Boulder, Colorado, the Institute for Brain Potential, Los Banos, California, and Intelligent Health Ltd, Reading, UK. In the previous three years, C.A.L. served on the Scientific Advisory Board of Immodulon Therapeutics Ltd., London, UK. All other authors declare that they have no conflict of interest to report. Dr. Stamper is a co-founder of Kioga Inc. This does not alter our adherence to PLOS ONE policies on sharing data and materials. There are no patents, products in development or marketed products associated with this research to declare.
Figures
Similar articles
-
The effect of sample site and collection procedure on identification of SARS-CoV-2 infection.Cochrane Database Syst Rev. 2024 Dec 16;12(12):CD014780. doi: 10.1002/14651858.CD014780. Cochrane Database Syst Rev. 2024. PMID: 39679851 Free PMC article.
-
Prescription of Controlled Substances: Benefits and Risks.2025 Jul 6. In: StatPearls [Internet]. Treasure Island (FL): StatPearls Publishing; 2025 Jan–. 2025 Jul 6. In: StatPearls [Internet]. Treasure Island (FL): StatPearls Publishing; 2025 Jan–. PMID: 30726003 Free Books & Documents.
-
Home treatment for mental health problems: a systematic review.Health Technol Assess. 2001;5(15):1-139. doi: 10.3310/hta5150. Health Technol Assess. 2001. PMID: 11532236
-
Systemic pharmacological treatments for chronic plaque psoriasis: a network meta-analysis.Cochrane Database Syst Rev. 2021 Apr 19;4(4):CD011535. doi: 10.1002/14651858.CD011535.pub4. Cochrane Database Syst Rev. 2021. Update in: Cochrane Database Syst Rev. 2022 May 23;5:CD011535. doi: 10.1002/14651858.CD011535.pub5. PMID: 33871055 Free PMC article. Updated.
-
Behavioral interventions to reduce risk for sexual transmission of HIV among men who have sex with men.Cochrane Database Syst Rev. 2008 Jul 16;(3):CD001230. doi: 10.1002/14651858.CD001230.pub2. Cochrane Database Syst Rev. 2008. PMID: 18646068
References
-
- Brenner LA, Forster JE, Stearns-Yoder KA, Stamper CE, Hoisington AJ, Brostow DP, et al. Evaluation of an Immunomodulatory Probiotic Intervention for Veterans With Co-occurring Mild Traumatic Brain Injury and Posttraumatic Stress Disorder: A Pilot Study. Front Neurol. 2020;11:1015. doi: 10.3389/fneur.2020.01015 - DOI - PMC - PubMed
-
- Dao MC, Everard A, Aron-Wisnewsky J, Sokolovska N, Prifti E, Verger EO, et al. Akkermansia muciniphila and improved metabolic health during a dietary intervention in obesity: relationship with gut microbiome richness and ecology. Gut. 2016;65(3):426–36. doi: 10.1136/gutjnl-2014-308778 - DOI - PubMed
LinkOut - more resources
Full Text Sources
Miscellaneous
