. 2025 Aug 13;20(8):e0327729.
doi: 10.1371/journal.pone.0327729. eCollection 2025.

Deep learning reveals that multidimensional social status drives population variation in 11,875 US participant cohort

Affiliations

Deep learning reveals that multidimensional social status drives population variation in 11,875 US participant cohort

Justin Marotta et al. PLoS One. .

Abstract

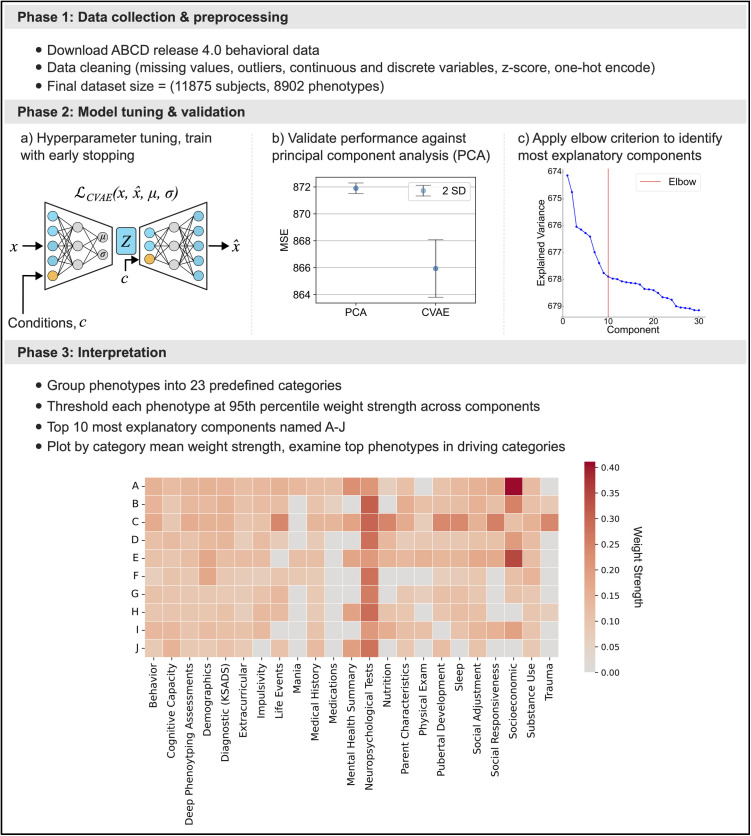
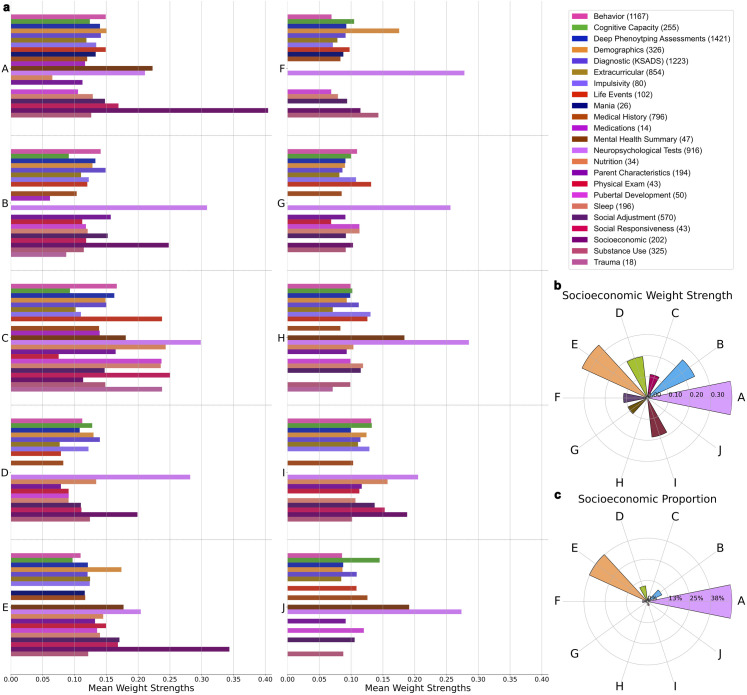
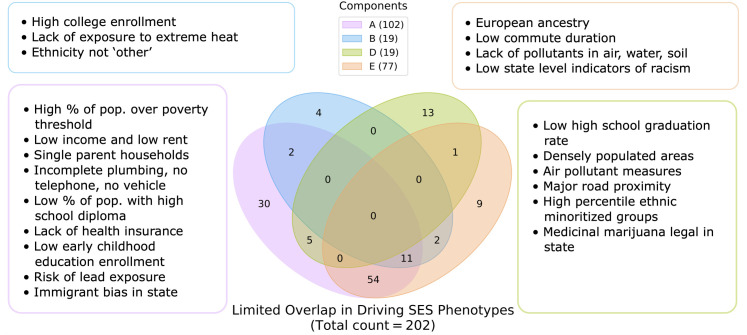
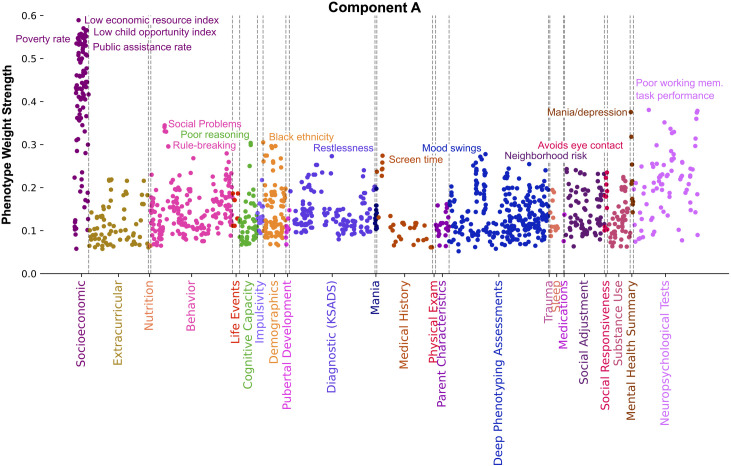
As an increasing realization, many behavioral relationships are interwoven with inherent variations in human populations. Presently, there is no clarity in the biomedical community on which sources of population variation are most dominant. The recent advent of population-scale cohorts like the Adolescent Brain Cognitive DevelopmentSM Study (ABCD Study®) are now offering unprecedented depth and width of phenotype profiling that potentially explains interfamily differences. Here, we leveraged a deep learning framework (conditional variational autoencoder) on the totality of the ABCD Study® phenome (8,902 candidate phenotypes in 11,875 participants) to identify and characterize major sources of population stratification. 80% of the top 5 sources of explanatory stratifications were driven by distinct combinations of 202 available socioeconomic status (SES) measures; each in conjunction with a unique set of non-overlapping social and environmental factors. Several sources of variation across this cohort flagged geographies marked by material poverty interlocked with mental health and behavioral correlates. Deprivation emerged in another top stratification in relation to urbanicity and its ties to immigrant and racial and ethnic minoritized groups. Conversely, two other major sources of population variation were both driven by indicators of privilege: one highlighted measures of access to educational opportunity and income tied to healthy home environments and good behavior, the other profiled individuals of European ancestry leading advantaged lifestyles in desirable neighborhoods in terms of location and air quality. Overall, the disclosed social stratifications underscore the importance of treating SES as a multidimensional construct and recognizing its ties into social determinants of health.


Conflict of interest statement

DB is a shareholder and advisory board member at MindState Design Labs, USA. This does not alter our adherence to PLOS ONE policies on sharing data and materials.

Figures

Fig 1
Fig 1. Analytical protocol: Deep learning enables identification of key phenotype groups driving interindividual differences from richly profiled population scale dataset.
Our study can be broken into three broad phases. Phase 1: We included the entirety of the ABCD Study® release 4.0 phenotypic data in our analysis pipeline. Data were preprocessed to retain as rich a phenotype profile as possible across all available participants, while preserving true distributions and handling outliers (cf. Methods). The final dataset size post-preprocessing steps was 11,875 participants each with 8,902 phenotypical variables. Phase 2: a) We trained a Conditional Variational Autoencoder (CVAE) across a range of hyperparameters (cf. Methods) and benchmarked their performance against Principal Component Analysis (PCA). b) The best performing CVAE architecture mean reconstruction loss was more than 2 standard deviations below that of PCA (CVAE mean MSE = 865.9, SD = 1.09; PCA mean MSE = 871.9, SD = 0.20). c) Components of the best performing CVAE architecture were ranked in terms of a heuristic per-component explained variance metric (cf. Methods) and the widespread elbow criterion was applied to determine that 10 components account for a high proportion of variance in the data compared to the remainder of the top 100 components. This indicated that key modes of population stratification exist, and we focused on these 10 most explanatory components for interpretation. Phase 3) We computed the 95th percentile among all 100 components to retain phenotypes only in the 5 components where they exhibit the highest weight strength, this enabled us to reduce the number of variables to only the most important for characterizing each component. Grouping the remaining phenotypes in each of the top 10 components (A-J) into 23 predefined categories provided by the ABCD Study®, we identified driving categories per component by calculating the mean weight strength per category in each component. Driving categories were examined in further detail to identify which particular phenotype groups were conjointly responsible for driving the captured population variation.
Fig 2
Fig 2. Population variation is driven by distinct combinations of phenotype categories with SES as a central theme.
a) Weight strength colored by category in each of the top 10 components. The number of variables per category is listed in brackets next to each category name in the legend. Category mean weight strength is calculated by averaging all individual phenotype weight strengths (retained after thresholding) within a predefined category. The Socioeconomic (SES) category has the highest or second highest mean weight strength of all categories in 4 of the top 5 most explanatory components. The Neuropsychological Tests category also exhibits consistently high mean weight strength across the top 10 components. b) Radial plot illustrating that the SES category has the highest mean weight strength in 4 of the top 5 most explanatory components (A, B, D, E) compared to the remainder of the top 10 components. c) Radial plot revealing that the phenotypes driving the SES category are distributed amongst 4 of the top 5 most explanatory components (A, B, D, E) in a higher proportion compared to the remainder of the top 10 components.
Fig 3
Fig 3. Socioeconomic status is characterized by distinct constellations of phenotypes.
Each of the 4 Socioeconomic (SES) driven components presents unique measures not captured in any of the other 3 components. Out of 202 candidate SES measures, there are no phenotypes shared among all 4 of the components after thresholding to retain phenotypes in components where they rank in the 95th percentile (number of SES phenotypes retained in each component is listed in brackets next to each component name in the legend). Unique SES measures in component A relate to material poverty and health risks. SES measures solely captured in Component B relate to educational level and temperate climate. Component D uniquely captures measures related to densely populated living and areas with a high percentile of racial and ethnic minoritized groups. Component E is uniquely driven by European ancestry and measures of healthy and desirable environments.
Fig 4
Fig 4. Component A distinctly captures material poverty and its health and mental well-being correlates.
Manhattan plot shows phenotypes, colored by category, whose weight strength in component A rank in the 95th percentile among all 100 components. Weight strength is calculated as the magnitude of Pearson’s correlation coefficient between participant data variable and latent variable scores. Socioeconomic measures exhibiting the strongest weight relate to high poverty and public assistance rates as well as low economic resources and child opportunity levels. Other phenotypes exhibiting strong weight relate to poor working memory task performance, poor reasoning, mood swings, indicators of mania and depression, restlessness, social interaction difficulties, rule breaking behavior, Black ethnicity, neighborhood risk, and high screen time. Collectively, this component proposes a connection between economic resources, deviant social behavior, and mental and emotional well-being.
Fig 5
Fig 5. Component B relates educational and behavioral outcomes shaped by one’s upbringing.
Manhattan plot shows phenotypes, colored by category, whose weight strength in component A rank in the 95th percentile among all 100 components. Weight strength is calculated as the magnitude of Pearson’s correlation coefficient between participant data variable and latent variable scores. Strongest weight Socioeconomic phenotypes in this component relate to a child’s educational opportunity and family income. Strongly weighted phenotypes from other categories include good working memory task performance, being non-religious, possessing good concentration skills, having parents that promote nonviolence, and exhibiting good behavior as measured by playing quietly and avoiding causing damage. In summary, this component underscores the wide range of social and environmental influences that affect both educational achievement and behavioral outcomes.
Fig 6
Fig 6. Component D illuminates the experience of individuals as immigrants or members of racial and ethnic minoritized groups in the USA.
Manhattan plot shows phenotypes, colored by category, whose weight strength in component A rank in the 95th percentile among all 100 components. Weight strength is calculated as the magnitude of Pearson’s correlation coefficient between participant data variable and latent variable scores. Driving Socioeconomic and Demographics phenotypes include low homeownership rates, high population density and housing density, recently immigrating to the US, Spanish as native tongue, and belonging to a racial and ethnic minoritized group. These factors are accompanied by elevated levels of fear, anxiety, phobia, poor working memory task performance and reasoning. Together, these factors highlight a connection between living conditions, language, ethnicity, and immigrant status.
Fig 7
Fig 7. Component E captures the values and opportunities of those leading wealthy lifestyles.
Manhattan plot shows phenotypes, colored by category, whose weight strength in component A rank in the 95th percentile among all 100 components. Weight strength is calculated as the magnitude of Pearson’s correlation coefficient between participant data variable and latent variable scores. Driving Socioeconomic phenotypes include proportion of European ancestry, neighborhoods high in terms of overall child opportunity, school wealth, and a low percentage of students eligible for free lunches. Other strongly weighted phenotypes relate to good performance on tasks measuring working memory and visuospatial processing and attention, lack of Mexican American cultural values, good grades in school, parent financial responsibility, White ethnicity, married parents, low screen time, and involvement in extracurricular activities such as playing sports and musical instruments. This component illuminates a link between opportunity, lifestyle, and sociodemographic group.
Fig 8
Fig 8. Unique SES signatures are distinctly represented in specific US states.
Participant SES variable scores (n = 202) in each of the 4 SES-centric components were used as features to train a multi-class logistic regression classifier to predict participant state of residence (cf. Methods). State color indicates which SES component had the strongest influence (i.e., coefficient magnitude) on predicting state of residence and shading intensity of state quantifies the magnitude of this influence. Note that component A was not most influential for any state. Different states appear to be more uniquely aligned with different SES signatures. Density plots per state show the distribution of participant scores in each of the 4 components for that state. The degree of divergence between participant score distributions varies depending on the state. The classifier was able to predict US state of residence for 10 of 17 states at above chance level (17 classes therefore chance level is ~ 5.88%). Map using U.S. Census Bureau Cartographic Boundary File [41].

Similar articles

References

    1. Kopal J, Uddin LQ, Bzdok D. The end game: respecting major sources of population diversity. Nat Methods. 2023;20(8):1122–8. doi: 10.1038/s41592-023-01812-3 - DOI - PubMed
    1. Smith SM, Nichols TE. Statistical Challenges in “Big Data” Human Neuroimaging. Neuron. 2018;97(2):263–8. doi: 10.1016/j.neuron.2017.12.018 - DOI - PubMed
    1. Farah MJ. The Neuroscience of Socioeconomic Status: Correlates, Causes, and Consequences. Neuron. 2017;96(1):56–71. doi: 10.1016/j.neuron.2017.08.034 - DOI - PubMed
    1. Atkinson EG, Maihofer AX, Kanai M, Martin AR, Karczewski KJ, Santoro ML, et al. Tractor uses local ancestry to enable the inclusion of admixed individuals in GWAS and to boost power. Nat Genet. 2021;53(2):195–204. doi: 10.1038/s41588-020-00766-y - DOI - PMC - PubMed
    1. De T, Park CS, Perera MA. Cardiovascular Pharmacogenomics: Does It Matter If You’re Black or White?. Annu Rev Pharmacol Toxicol. 2019;59:577–603. doi: 10.1146/annurev-pharmtox-010818-021154 - DOI - PMC - PubMed

LinkOut - more resources