

Expanding range of Ixodes scapularis Say (Acari: Ixodidae) and Borrelia burgdorferi infection in North Carolina counties, 2018-2023
- PMID: 40802725
- PMCID: PMC12349693
- DOI: 10.1371/journal.pone.0329511
Expanding range of Ixodes scapularis Say (Acari: Ixodidae) and Borrelia burgdorferi infection in North Carolina counties, 2018-2023
Abstract
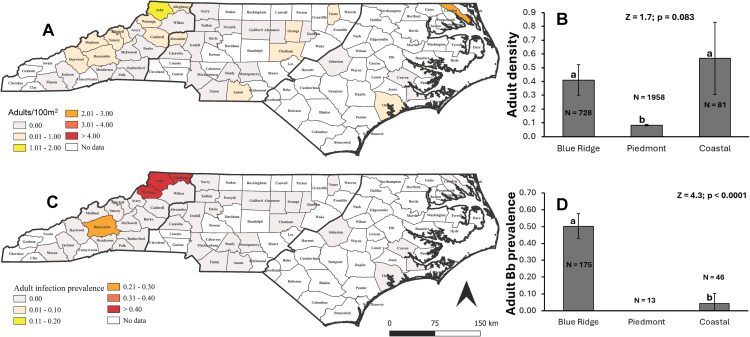
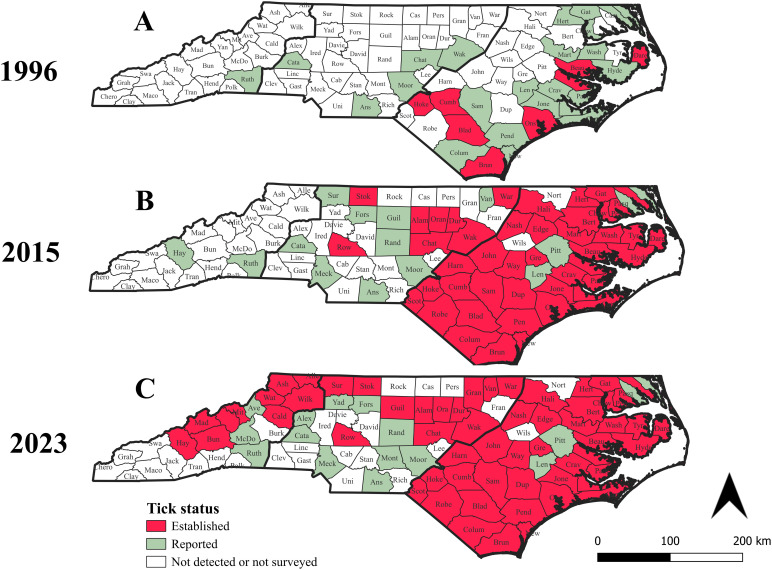
North Carolina (NC) has been experiencing a recent surge in human Lyme disease (LD) cases. Understanding the distribution of tick-borne diseases necessitates understanding the distribution of the ticks that transmit their causative pathogens. Unfortunately, in NC, knowledge on tick distribution is outdated. In this manuscript, we report the results of a state-wide entomologic survey conducted in 42 NC counties by flagging/dragging from spring 2018 to summer 2023. Ixodes scapularis nymphs and adults were screened for Borrelia burgdorferi (the causative agent of LD) and four other tick-borne bacterial pathogens (Anaplasma phagocytophilum, B. mayonii, B. miyamotoi, and Babesia microti) by the Centers for Disease Control and Prevention (CDC). Consistent with current data on human LD cases incidence and distribution, results of this study indicated a range expansion of I. scapularis with higher tick densities and B. burgdorferi infection prevalence now occurring in the Blue Ridge Mountains province of western NC. Temporal analysis of I. scapularis presence data indicated that this shift is fairly recent (about 10 years). Finally, in the Blue Ridge Mountains we detected a northeast-to-southwest gradient in I. scapularis tick and B. burgdorferi infection prevalence suggesting that this trend is driven by a spread of the northern clade I. scapularis ticks into NC from southwestern Virginia, along the Appalachian Mountains. Other pathogenic bacteria detected in I. scapularis ticks included B. miyamotoi and A. phagocytophilum, that were limited to the Blue Ridge Mountains. These results have important public health implications, including the need for enhanced tick surveillance, updated clinical awareness, and targeted public education in newly affected areas.
Copyright: © 2025 Garshong et al. This is an open access article distributed under the terms of the Creative Commons Attribution License, which permits unrestricted use, distribution, and reproduction in any medium, provided the original author and source are credited.
Conflict of interest statement
The authors have declared that no competing interests exist.
Figures


Similar articles
-
Emerging babesiosis in the mid-Atlantic: autochthonous human babesiosis cases and Babesia microti (Piroplasmida: Babesiidae) in Ixodes scapularis (Acari: Ixodidae) and Ixodes keiransi (Acari: Ixodidae) ticks from Delaware, Maryland, Virginia, West Virginia, and the District of Columbia, 2009 to 2024.J Med Entomol. 2025 Jul 17;62(4):995-1008. doi: 10.1093/jme/tjaf054. J Med Entomol. 2025. PMID: 40261095
-
Human pathogens associated with the blacklegged tick Ixodes scapularis: a systematic review.Parasit Vectors. 2016 May 5;9:265. doi: 10.1186/s13071-016-1529-y. Parasit Vectors. 2016. PMID: 27151067 Free PMC article.
-
Spatiotemporal distribution of Borrelia miyamotoi (Spirochaetales: Spirochaetaceae) and coinfection with other tick-borne pathogens in host-seeking Ixodes scapularis (Acari: Ixodidae) from New York State, USA.J Med Entomol. 2023 Jul 12;60(4):808-821. doi: 10.1093/jme/tjad054. J Med Entomol. 2023. PMID: 37156099 Free PMC article.
-
Spatial and temporal distribution of Ixodes scapularis and tick-borne pathogens across the northeastern United States.Parasit Vectors. 2024 Nov 22;17(1):481. doi: 10.1186/s13071-024-06518-9. Parasit Vectors. 2024. PMID: 39574137 Free PMC article.
-
Historical associations and spatiotemporal changes of pathogen presence in ticks in Canada: A systematic review.Zoonoses Public Health. 2024 Feb;71(1):18-33. doi: 10.1111/zph.13093. Epub 2023 Nov 13. Zoonoses Public Health. 2024. PMID: 37957785
References
-
- Berger J. Draft national strategy for vector-borne diseases: we want to hear from you. Washington, D.C: US Department of Health and Human Services. 2022. https://www.hhs.gov/blog/2022/12/13/draft-national-strategy-for-vector-b...
MeSH terms
LinkOut - more resources
Full Text Sources
Medical
Research Materials
