. 2025 Aug 15;11(33):eadu0175.
doi: 10.1126/sciadv.adu0175. Epub 2025 Aug 13.

Mismatch in reindeer resilience to past and future warming signals ongoing declines

Affiliations

Mismatch in reindeer resilience to past and future warming signals ongoing declines

Elisabetta Canteri et al. Sci Adv. .

Abstract

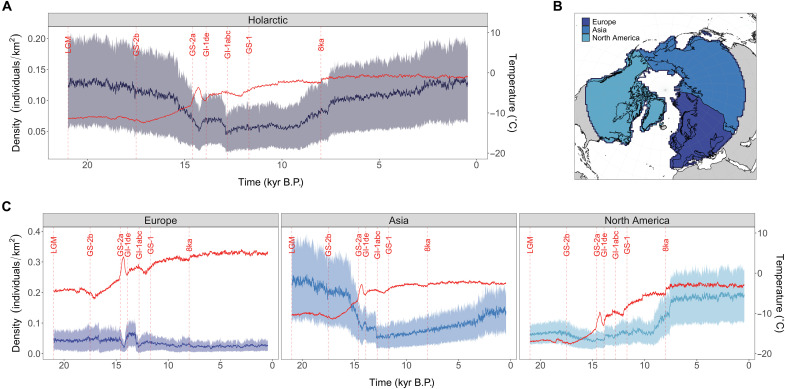
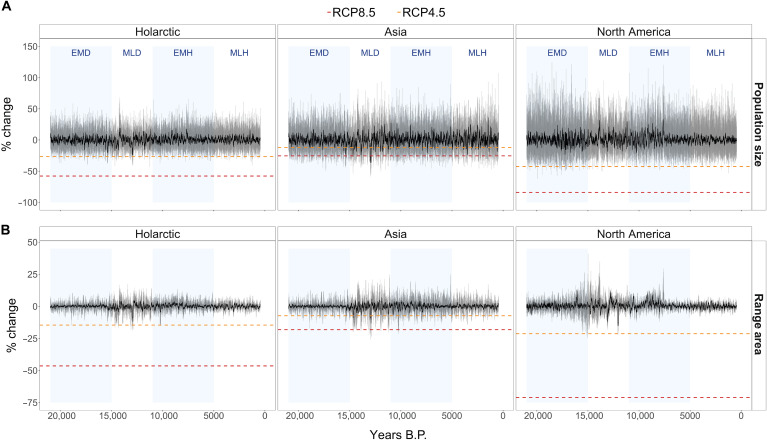
Rangifer tarandus (caribou or reindeer) survived periods of abrupt climatic warming during the last deglaciation but are currently in global decline. Using process-explicit models of likely climate-human-Rangifer interactions and inferences of demographic change from radiocarbon-dated fossils and ancient DNA, we reconstruct and decipher 21,000 years of Rangifer population dynamics. These high-resolution population reconstructions pinpoint ecological characteristics and life-history traits that most likely enabled Rangifer to survive rapid warming events following the Last Glacial Maximum. Projecting these process-driven models into the future reveals that these attributes are unlikely to buffer Rangifer against wide-scale population declines from expected 21st Century climatic warming. Our findings highlight a need to boost investments in the management and conservation of Rangifer, particularly in North America, where projected losses are expected to exceed 80%. This will not only support the survival of the species and the vital services it renders in Arctic ecosystems, but also help sustain the socioeconomic, cultural, and emotional well-being of many Rangifer-dependent communities.


Figures

Fig. 1.
Fig. 1.. Rangifer traits and geographic range dynamics over the past 21,000 years.
(A) POM validation. Histograms show summary statistics for multiple POM runs (blue) and the “best” models (yellow). Red vertical lines show POM targets. y axes are on the log scale. RMSE, root mean square error. (B) Projected time of extirpation of Rangifer and relative density in 1500 CE. The red color shows the time of last occupation (extirpation) in each grid cell. The blue color shows relative density at 1500 CE, and the dark gray color shows areas of very low abundance (<0.02 individuals/km2). The solid blue line shows the current Rangifer distribution as defined by the IUCN Red List (27). The grid shows the study region. (C) Posterior distributions (scaled between 2 and −2) for demographic (blue), human hunting (pink), and ecological (yellow) parameters compared to the uniform prior (gray). Parameters are as follows: maximum population growth rate (Max. growth), variation in population growth rate (Var. growth), Allee effect, maximum dispersal distance (Max. dispersal), proportion of individuals dispersing at each time step (% dispersal), maximum percentage of a Rangifer population harvested (Max. harvest), extent to which harvest follows a type II to type III functional response (Harvest func. response), carrying capacity, breadth of climatic conditions Rangifer can occupy (Niche breadth), and marginality of climatic preferences (Niche marginality). Values on top of the boxes represent the unscaled posterior range (25th and 75th percentiles) for each model parameter. See the Supplementary Materials for more details. (D) Rangifer abundance following abrupt climatic events at 17.5 (GS-2b), 14.6 (GS-2a), 12.8 (GI-1abc), and 8.2 (cold event in North America) kyr B.P. Red arrows indicate the spread of Rangifer populations following these climatic events.
Fig. 2.
Fig. 2.. Simulated change in population density over the past 21,000 years.
(A) Rangifer density (mean ± 1 SD) (colored line; left y axis) and mean annual temperature (red line; right y axis) from 21 kyr B.P. until 1500 CE for the Holarctic and for (C) Europe, Asia, and North America. Dashed vertical lines show the time of major climatic events. LGM, Last Glacial Maximum. (B) Holarctic region (thick blue line) showing regional boundaries for Europe (dark blue), Asia (blue), and North America (light blue).
Fig. 3.
Fig. 3.. Forecast declines in population size and distribution.
(A) Changes in future population abundances of Rangifer in 2100 CE based on its current distribution under RCP8.5 and RCP4.5. Red colors indicate lower abundances in 2100 compared to 2020. Blue colors indicate higher abundances in 2100. The pale yellow color indicates little change, and the dark gray color indicates areas of future extirpation. Blue lines show subregions (Asia, North America, and Europe). Changes outside the current distribution of Rangifer are shown in fig. S4 in the Supplementary Materials. (B) Violin plots show the percentage of reduction in total population size (solid fill) and range area (striped fill) between 2020 and 2100 for three regions (Holarctic, Asia, and North America) under RCP8.5 and (C) under RCP4.5. White diamonds show the best estimate of reduction based on an ensemble-averaged projection. Results for Europe are reported in the Supplementary Materials (fig. S5). All projections are based on model-averaged outputs from 50 optimized process-explicit models (see Materials and Methods).
Fig. 4.
Fig. 4.. Past and future analogs of demographic and distributional change.
(A) Percentage of change in total population size and (B) geographic range area, calculated from the “best” paleomodels (gray lines) and from the ensemble-averaged projection (black line) for the Holarctic, Asia, and North America. The positive change refers to increases in population sizes and range area, while the negative change refers to reductions. Dashed lines show thresholds of future rates of change based on forecasts in total population size and range area under RCP8.5 (red) and RCP4.5 (orange). Pale blue and white rectangles in the background show time bins: early-to-mid deglaciation (EMD; 21 to 15 kyr B.P.), mid-to-late deglaciation (MLD; 15 to 11 kyr B.P.), early-to-mid Holocene (EMH; 11 to 5 kyr B.P.), and mid-to-late Holocene (MLH; 5 kyr B.P. to 1500 CE). See the Supplementary Materials (fig. S6) for results for Europe.

Similar articles

References

    1. Lin Z., Chen L., Chen X., Zhong Y., Yang Y., Xia W., Liu C., Zhu W., Wang H., Yan B., Yang Y., Liu X., Sternang Kvie K., Roed K. H., Wang K., Xiao W., Wei H., Li G., Heller R., Gilbert M. T. P., Qiu Q., Wang W., Li Z., Biological adaptations in the Arctic cervid, the reindeer (Rangifer tarandus). Science 364, eaav6312 (2019). - PubMed
    1. Post E., Erosion of community diversity and stability by herbivore removal under warming. Proc. Biol. Sci. 280, 20122722 (2013). - PMC - PubMed
    1. Post E., Pedersen C., Opposing plant community responses to warming with and without herbivores. Proc. Natl. Acad. Sci. U.S.A. 105, 12353–12358 (2008). - PMC - PubMed
    1. E. E. Syroechkovskii, Wild Reindeer (Smithsonian Institution Libraries, 1995).
    1. Vors L. S., Boyce M. S., Global declines of caribou and reindeer. Glob. Chang. Biol. 15, 2626–2633 (2009).