. 2025 Aug 15;11(33):eadt0534.
doi: 10.1126/sciadv.adt0534. Epub 2025 Aug 13.

An ancient enhancer rapidly evolving in the human lineage promotes neural development and cognitive flexibility

Affiliations

An ancient enhancer rapidly evolving in the human lineage promotes neural development and cognitive flexibility

Kun Tan et al. Sci Adv. .

Abstract

The genetic changes driving the evolution of humans since the human-chimpanzee split have been elusive. Here, we report a promising candidate in a chromosomal region linked with neurological defects-17p13.3. We show that this 442-nucleotide sequence-human-accelerated region (HAR) 123-is a conserved neural enhancer that promotes neural progenitor cell (NPC) formation. While present in all mammals, HAR123 has rapidly evolved since humans diverged from chimpanzees. The human and chimpanzee HAR123 orthologs exhibit subtle differences in their neural developmental effects, and the human HAR123 ortholog uniquely regulates many genes involved in neural differentiation. We identified direct targets of the HAR123 enhancer and showed that HIC1 acts downstream of HAR123 to promote human NPC formation. HAR123-knockout mice exhibit a defect in cognitive flexibility and a shift in neural-glia ratio in specific regions of the hippocampus. Our study has implications for neurodevelopmental disorders, which are often accompanied by altered neural-glia ratio and have been linked with HARs.


Figures
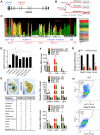
Fig. 1.
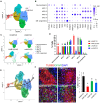
Fig. 1.. HAR123 is a neural enhancer that promotes human NPC generation.
(A) Location of HAR53 and HAR123 in the SMG6 gene. (B) HAR123 is present in mammals and marsupials but not in monotremes, based on the University of California Santa Cruz (UCSC) database. (C) Human HAR123 has the chromatin marks of an active enhancer, based on the ENCODE map of 15 chromatin states (17). The first 7 states listed on the right are associated with active transcription: TssA and TssAFlnk, actively transcribed proximal promoter; TxFlnk, transcribed at the 5′ and 3′ end of genes; Tx and TxWk, strong and weak transcription, respectively; EnhG and Enh, enhancers. The next 7 listed states are associated with repressed transcription: ZNF/Rpts, associated with zinc finger genes; Het, heterochromatin; TssBiv and BivFlnk, bivalent regulatory sites; EnhBiv, bivalent enhancer; ReprPC and ReprPCWk, strong and weak Polycomb-associated repressed sites. Quies, quiescent. (D) Luciferase analysis of the pGL3 plasmid (which contains a minimal simian virus 40 promoter upstream of the firefly luciferase gene) harboring human, chimpanzee, or mouse HAR123 in the forward or reverse (Rev) orientation downstream. These six reporter constructs, as well as pGL3 with no HAR123 insert, were transiently cotransfected with a normalization control—a Renilla luciferase reporter plasmid driven by the cytomegalovirus immediate-early promoter (pRL-cmv)—into human embryonic stem cells (hESCs). n = 3. *P < 0.05. Data are represented as mean ± SEM. (E) Top: Mouse embryos [from embryonic day 11.5 (E11.5)] injected at the one-cell stage with either human (h) or chimpanzee (c) HAR123. Blue denotes β-galactosidase activity. Bottom: Summary of tissues with positive β-galactosidase activity. DRG, dorsal root ganglion. (F) Quantitative polymerase chain reaction (qPCR) analysis of wild-type (WT; two clones) and HAR123-KO hESCs (four clones) differentiated into the three primary germ layers using standard protocols (15). Shown are well-established markers for the indicated germ layers. n = 4. *P < 0.05. Data are represented as mean ± SEM. (G) qPCR analysis of NPC markers in WT (two clones) and HAR123-KO hESCs (four clones) differentiated into NPCs using a standard protocol (20). n = 3. *P < 0.05. Data are represented as mean ± SEM. (H) Fluorescence-activated cell sorting (FACS) analysis of the intracellular paired box 6 (PAX6) signal [fluorescein isothiocyanate-area (FITC-A)] in hESCs differentiated as in (G) (detected by permeabilizing the cells before antibody incubation). n = 3.
Fig. 2.
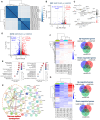
Fig. 2.. Species-biased effects of HAR123 on human NPC generation.
(A) scRNA-seq analysis of hESCs differentiated to the rosette stage of NPC generation. hESCs of four genotypes [described in (C)] were assayed independently and analyzed as a group to define the clusters shown in the uniform manifold approximation and projection (UMAP) plot. NPC-1 to -4 are four distinct NPC cell clusters, while the Diff. (differentiating) progenitor cluster has more developmentally advanced cells, based on markers shown in (B) and pseudotime analysis in (E). (B) Expression of the gene markers used for annotating the cell types in (A). exp, expression. (C) UMAP plots of the same scRNA-seq data as in (A), showing the cell contributions from the four indicated genotypes. (D) Quantification and pairwise comparison of the data in (C). Statistical analysis was done using one-way analysis of variance (ANOVA), followed by a Tukey post hoc test. Genotypes with different characters from a given cell cluster (a, b, c, or d) are significantly different in frequency from each other. P < 0.05. (E) Pseudotime trajectory analysis of the cells in (A). The arrow shows the direction of differentiation. (F) Left: Immunofluorescence analysis of differentiating neurons and glial cells from human NPCs of the indicated genotypes (two independent clones of each). NPCs were cultured under differentiation conditions (no fibroblast growth factor 2) for 4 weeks, following a standard neural differentiation protocol (20). Tubulin beta 3 class III (TUBB3) and glial fibrillary acidic protein (GFAP) mark neurons and glial cells, respectively. The cells were also stained with 4′,6-diamidino-2-phenylindole (DAPI; blue) to mark nuclei. Scale bar, 50 μm. Two biological replicates were performed. Right: Quantification of neuron/glia ratio of the indicated genotypes. Different letters (a, b, and c) denote statistically significantly different groups (P < 0.05).
Fig. 3.
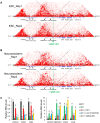
Fig. 3.. Species-specific gene regulation conferred by HAR123.
(A) Hierarchical clustering of all RNA-seq samples assayed. ESC, hESCs; ECTO, neuroectoderm. P adj, adjusted P. (B) Volcano plot showing genes differentially expressed between hESCs of the indicated genotypes. q < 0.01 and |log2 fold change (FC)| > 1. (C) Enriched functions and key genes among the DEGs defined in (B), as defined by gene-concept network analysis. (D) Volcano plot showing genes differentially expressed between neuroectodermal cells of the indicated genotypes. q < 0.01 and |log2FC| > 1. (E) Dot plots showing the most statistically enriched biological functions encoded by the up-regulated (left) and down-regulated (right) genes defined in (D). (F) hESC gene regulation conferred by HAR123 from different species. Left: Heatmap showing the expression pattern of DEGs between the genotypes indicated. Right: Venn plots showing genes differentially expressed between each of the genotypes shown and hHAR123 hESCs. The overlap between all three DEG subsets is genes specifically regulated by hHAR123. (G) Neuroectoderm gene regulation conferred by HAR123 from different species. Left: Heatmap showing the expression pattern of DEGs between the genotypes indicated. Right: Venn plots showing genes differentially expressed between each of the genotypes shown and hHAR123 neuroectodermal cells. The overlap between all three DEG subsets is genes specifically regulated by hHAR123. (H) Genes uniquely regulated by hHAR123 in neuroectoderm, as defined in (G). The genes are depicted using functional protein association network analysis.
Fig. 4.
Fig. 4.. A HAR123-HIC1 circuit drives human NPC generation.
(A) Hi-C analysis of hESCs, showing the long-range chromatin interactions between HAR123 and specific sites. Rep, replicate. (B) Hi-C analysis of neuroectodermal cells showing the long-range chromatin interactions between HAR123 and specific sites. (C) qPCR analysis of hHAR123 (WT) and HAR123-KO hESC cells cultured following a well-established NPC generation protocol (20). At the ESC stage, the cells were transduced with lentiviral viruses expressing the indicated transcripts. The data show that forced expression of HIC1 rescues NPC generation, as shown by the up-regulation of the three NPC-2 markers (FOXG1, FZD5, and SIX3) and down-regulation of the four NPC-3 markers (CDH18, RBFOX1, PAX3, and WLS) (see fig. S3C). Statistical analysis was done using one-way ANOVA, followed by a Tukey post hoc test. Different letters denote statistically significantly different groups (P < 0.05). n = 3 (from four independent HAR123-KO clones). Data are represented as mean ± SEM.
Fig. 5.
Fig. 5.. HAR123-KO mice exhibit defects in the hippocampus and reversal learning.
(A) to (E) show the results of behavioral assays performed on adult HAR123-KO and control (WT) littermate mice (n = 16 mice for each genotype). *P < 0.05. Data are represented as mean ± SEM. (F) Heatmap showing that genes encoding proteins known to be associated with cognitive flexibility are dysregulated in the frontal cortex of HAR123-KO mice as compared to control (WT) littermate mice, based on RNA-seq analysis (see fig. S8C). (G) Left: Immunofluorescence analysis of the hippocampus from postnatal–day 7 (P7) mice of the indicated genotypes. Neuronal nuclei (NEUN) labels neurons, GFAP labels glial cells, and DAPI labels nuclei. The number of NEUN+ and GFAP+ cells was counted manually. Scale bars, 100 μm. Right: Quantification based on analysis of brain sections from three individual mice from each genotype (two sagittal sections per animal). *P < 0.05. (H) Top: Immunofluorescence analysis of the hippocampus from P35 mice of the indicated genotypes, performed as in (G). Bottom: Quantification based on analysis of brain sections from two individual mice from each genotype (three sagittal sections per animal).

Similar articles

References

    1. Pollard K. S., Salama S. R., Lambert N., Lambot M. A., Coppens S., Pedersen J. S., Katzman S., King B., Onodera C., Siepel A., Kern A. D., Dehay C., Igel H., Ares M. Jr., Vanderhaeghen P., Haussler D., An RNA gene expressed during cortical development evolved rapidly in humans. Nature 443, 167–172 (2006). - PubMed
    1. Prabhakar S., Noonan J. P., Paabo S., Rubin E. M., Accelerated evolution of conserved noncoding sequences in humans. Science 314, 786 (2006). - PubMed
    1. Whalen S., Pollard K. S., Enhancer function and evolutionary roles of human accelerated regions. Annu. Rev. Genet. 56, 423–439 (2022). - PMC - PubMed
    1. Levchenko A., Kanapin A., Samsonova A., Gainetdinov R. R., Human accelerated regions and other human-specific sequence variations in the context of evolution and their relevance for brain development. Genome Biol. Evol. 10, 166–188 (2018). - PMC - PubMed
    1. Girskis K. M., Stergachis A. B., DeGennaro E. M., Doan R. N., Qian X., Johnson M. B., Wang P. P., Sejourne G. M., Nagy M. A., Pollina E. A., Sousa A. M. M., Shin T., Kenny C. J., Scotellaro J. L., Debo B. M., Gonzalez D. M., Rento L. M., Yeh R. C., Song J. H. T., Beaudin M., Fan J., Kharchenko P. V., Sestan N., Greenberg M. E., Walsh C. A., Rewiring of human neurodevelopmental gene regulatory programs by human accelerated regions. Neuron 109, 3239–3251.e7 (2021). - PMC - PubMed

LinkOut - more resources