. 2025 Aug 15;11(33):eadv1499.
doi: 10.1126/sciadv.adv1499. Epub 2025 Aug 13.

Membrane curvature association of amphipathic helix 8 drives constitutive endocytosis of GPCRs

Affiliations

Membrane curvature association of amphipathic helix 8 drives constitutive endocytosis of GPCRs

Jan Hendrik Schmidt et al. Sci Adv. .

Abstract

Cellular signaling relies on the activity of transmembrane receptors and their presentation on the cellular surface. Their continuous insertion in the plasma membrane is balanced by constitutive and activity-dependent internalization, which is orchestrated by adaptor proteins recognizing semispecific motifs within the receptors' intracellular regions. Here, we describe a complementary trafficking mechanism for G protein-coupled receptors (GPCRs) that is evolutionary conserved and refined. This mechanism relies on the insertion of their amphipathic helix 8 into the inner leaflet of lipid membranes, orthogonal to the transmembrane helices. These amphipathic helices dictate subcellular localization of the receptors and autonomously drive their endocytosis by cooperative assembly and association with areas of high membrane curvature. The strength of helix 8 membrane insertion propensity quantitatively predicts the rate of constitutive internalization of GPCRs. This discovery advances our understanding of membrane protein trafficking and highlights a principle of receptor-lipid interactions that may have broad implications for cellular signaling and therapeutic targeting.


Figures

Fig. 1.
Fig. 1.. AHs in TMPs autonomously drive their endocytosis.
(A) Illustration of GPCR H8 sequences transferred to the single TMP Tac for determination of their autonomous endocytic drive alongside mutational disruption of amphipathicity by introduction of negative charges in the hydrophobic face of H8. (B) Representative images of human embryonic kidney (HEK) 293 cells transfected with Tac-H8 constructs and subjected to antibody feeding (illustrated in inset, bottom left). (C) Quantification of internalization (red/green fluorescence ratio), relative to Tac, from confocal images (every dot represents a cell), n = 3. (D) Internalization of Tac-H8 constructs assessed by flow cytometry and normalized to Tac. Means ± SEM, n = 3. (E) Internalization of Tac with AHs from cytosolic proteins or exogenous AHs assessed by flow cytometry. Means ± SEM, n = 3. (F) Linear correlation (R2 = 0.64, P < 0.0001) between MIP of Tac-AH constructs and their respective endocytic rate (relative to Tac). Means ± SEM, n = 3. (G) Illustration of chimeric H8 GPCRs with swapped part highlighted in helical wheel representations using HeliQuest (58). (H) Constitutive and agonist-induced (10 μM agonists) internalization rates of chimeric FLAG-tagged GPCR constructs with swapped H8 sequences relative to Tac. Means ± SEM, n = 3. n.s., not significant. *P < 0.05, **P < 0.01, ***P < 0.001, and ****P < 0.0001.
Fig. 2.
Fig. 2.. Increasing MIP drives association with the biosynthetic pathway and away from the plasma membrane.
(A) Schematic of proximity biotinylation assay with BioID2. (B) Top: Western blot (M1 ab) of Flag-Tac AH-BioID2 constructs transfected in HEK293 cells showing mature proteins [high molecular weight (MW) band] and immature protein (low MW band). Bottom: Quantification of internalization of Flag-Tac AH BioID2 constructs from confocal images (every dot represents a cell, compiled from three independent experiments). (C) Differences in label-free quantification (LFQ) values for indicated constructs versus basal levels (pcDNA) normalized to Tac compiled for all identified proteins belonging to endolysosomal compartments of MMF grouping in (26). FC, fold change. (D) Principal components analysis (PCA) biplot showing spread of MS samples along principal component 1 (PC1) and PC2 indicating a MIP-driven separation. (E) Volcano plot highlighting slope and R2 values of linear correlations for each identified protein with MIP of the Tac-AH-BioID2 constructs. Protein correlating with MIP (slope > 0 and R2 > 0.4) highlighted in blue. Identified AP complex subunits (indicated in green). (F) STRING protein network analysis of the proteins identified as MIP correlated in (E) in functional groups based on database annotations.
Fig. 3.
Fig. 3.. ToTAM associates with CME machinery in a noncanonical manner.
(A and B) Absolute difference in LFQ values (normalized to Tac) of identified actin and dynamin subunits (A) and selected identified proteins associated with CME, CLIG/GEEC, caveolae, and other endocytic pathways (B). (C) Schematic of (ppH-TIRFM) protocol enabling definition of time of scission for individual endocytic events. (D) Images of representative endocytic event from ppHTIRFM experiments of superecliptic pHluorin (SEP)–tagged transferrin receptor (TfR) together with clathrin light chain (CLC)–mCherry. (E) Endocytic event rate for the five different SEP-TacAH constructs compared to TfR-SEP. Statistical analysis using Kruskal-Wallis multiple comparisons test. (F) Top: Average of individually normalized CLC-mCherry traces for TfR-SEP and 5 SEP-TacAH constructs. Bottom: Heatmaps of normalized individual CLC-mCherry traces pre- and postscission. n = 5 to 10 cells (846 to 2797 events) per condition. *P < 0.05, **P < 0.01, ***P < 0.001, and ****P < 0.0001.
Fig. 4.
Fig. 4.. ToTAM involves accelerated endocytic maturation and scission.
(A) Top: Average of individually normalized pH 7.4 TfR-SEP and SEP-TacAH fluorescence intensity traces building up to point of scission (time = 0). Bottom: Heatmaps of normalized individual SEP-fluorescence profiles at pH 7.4 of TfR-SEP and SEP-TacAH constructs before scission. n = 5 to 10 cells per condition and n = 518 to 2367 total traces. (B) Nonlinear regression fits of averaged normalized pHluorin traces up to point of scission. H is the Hill coefficient. (C) Effect of TacAH constructs on AF647-labeled transferrin endocytosis in trans by flow cytometry. (D) Averaged fluorescent traces measured at pH 5.5 in cell populations expressing either of the six indicated SEP-TacAH constructs. Absolute values shown postscission (t = 0). (E) Average traces from (D) are normalized to initial fluorescence observed at time of scission (t = 0) and fitted to the “Acidification Kinetics Function” (see Materials and Methods). Fits shown for all six SEP-TacAH constructs with TfR eliciting slowest acidification kinetics, while AT1 elicits the fastest acidification kinetics. AU, arbitrary units.
Fig. 5.
Fig. 5.. ToTAM involves association with high membrane curvature during endocytosis.
(A) Relative protein density (Hecate peptide) as a function of tubule diameter determined in buckled membrane MD analysis indicating a strong preference for positive curvature. (B) Free energy from (A) as a function of membrane curvature. (C) Representative images of Oregon Green 488–labeled Hecate (green) bound to free floating BODIPY-TR–labeled GUVs (red), revealing selective organization of peptides in deformed microdomain structures on the GUVs. Scale bars, 5 μm. (D) Tethers pulled from GUVs (red) preincubated with Oregon Green–labeled Hecate peptide (green). Insets 1 and 3, zooms of GUV and summed intensity profile. Insets 2 and 4, zooms of tether and summed intensity profile. (E) Quantification of the relative sorting to the tether as a function of relative size of the tether (Tetherred/GUVred). (F) Representative 3D-dSTORM images of FLAG-Tac and five FLAG-TacAH constructs after surface labeling with Alexa Fluor 647–conjugatedM1 α-FLAG antibody. Scale bars, 5 μm. Insets show representative single clusters color coded for localization density. (G) Average size of clusters for the individual constructs, median ± 95% CI, n = 6. (H) Logarithmic relationship of cluster size and cargo density (FLAG-Tac-AH). Black bars show binned averages ± SEM, and the blue line represents a linear fit of the data. Better adherence of the fit to the binned averages indicates curvature dependent sorting for Tac-AH constructs with high MIP. (I) Selectivity slope (i.e., curvature sensitivity) derived for linear fits with error on log-log plots of the data in (H) (see fig. S22).
Fig. 6.
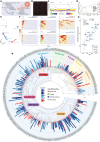
Fig. 6.. Proteome-wide characterization of C-terminal membrane interactions in GPCRs and their role in constitutive endocytosis of GPCR.
(A) Schematic of chip array for scanning of liposome binding strength throughout the full range of human GPCR C termini. Individual peptides are randomly positioned on the chip. (B) Representative image of fluorescent signal from bound liposomes on enlarged area of array. Regular pattern in top left corner is control Hecate peptide. (C) Compiled binding profile of the C termini of rhodopsin, β2, and AT1 along with corresponding MIP and net charge values (below). CI, confidence interval. (D) Average liposome binding profiles of peptide sequences corresponding to 16–amino acid stretches of GPCR C termini split by GRAFS family (left y axis) and cumulative distribution function of all human GPCR C termini (right y axis) starting at 16 amino acids. (E) UMAP-based clustering of all human GPCR C termini based on position and strength of liposome binding. (F) Heatmaps of all individual GPCR C-terminal liposome binding profiles within the six clusters and profile plots of the median fluorescence intensity (line above) (for detailed view, see fig. S23). (G) Linear correlation (R2 = 0.83, P < 0.0001) between MIP of H8 from clusters 2 to 5, based on sequences (fig. S27) in pharmacologically relevant GPCRs and their respective endocytic rate (relative to Tac) determined by flow cytometry (39). Means ± SEM, n = 3. (H) Circular phylogenetic tree of human GPCRs based on sequence homology and divided into GRAFS families and clusters, alongside the corresponding calculated MIP based on H8 from either refined representative structures as annotated on GPCRdb (purple) (11), AlphaFold2 prediction (magenta) (59) or manually curated. Receptors used in (G) are highlighted by green, and receptors described as mechanosensitive (45) are highlighted by asterisks (name). GPCRs from cluster 1 (no binding) in gray. Receptors with a structural H8 predicted longer than 20 amino acids marked with asterisk (bar). AU, arbitrary units. CDF, cumulative distribution function.
Fig. 7.
Fig. 7.. Functional conservation and evolutionary refinement of MIP of H8 in GPCRs.
(A) Normalized BLOSUM62 (60) substitution cost of natural variants mapped to full C terminus versus H8. AA, amino acid. (B) Frequency of natural variants (UK Biobank) (61) in the full C terminus (C-term) versus H8 of human GPCRs of clusters 2 to 6. [(A) and (B)] Wilcoxon nonparametric statistical test. Asterisks indicate P value of < 0.05 and n.s. P value of > 0.05. (C) Scatter plot of MIP values of all identified nonsynonymous natural variants (red dots) identified in the UK Biobank (61) and nonidentified possible nonsynonymous substitutions (black dots) as a function of the wildtype receptors MIP. Linear regression analysis of observed natural variants with a slope of 0.87 ± 0.01 is closer to full conservation (indicated by dashed yellow line, slope of 1) than for nonobserved 0.81 ± 0.004 (all other possible variants). (D) Scatter plot showing frequency of nonsynonymous natural variants of individual GPCRs as a function of MIP (each receptor represented by a dot), with a negative linear correlation indicating lowered variant frequency for receptors with high MIP (cyan, R2 = 0.089, P < 0.0001). Lines indicate average frequency of binned MIP intervals ± SD. (E) UMAP-based clustering of combined D. melanogaster, C. elegans, and S. cerevisiae GPCR C termini based on position and strength of liposome binding motifs. Heatmaps of individual GPCR C-terminal liposome binding profiles within the five clusters and profile plots of their median fluorescence (top) (see fig. S30 for the list of individual receptors and species). (F) Evolutionary tree of GPCRs displaying MIP of H8 sequences identified in human receptors and aligned across species (left). The ratio of variance versus mean of all MIP decreases with increasing MIP (top, left). Top, right: MIP values for viral GPCRs (table S2). Bottom, right: Density distribution of MIP values for individual species shift to the right during evolution. *P < 0.05, **P < 0.01, ***P < 0.001, and ****P < 0.0001. AU, arbitrary units.

Similar articles

References

    1. McMahon H. T., Boucrot E., Molecular mechanism and physiological functions of clathrin-mediated endocytosis. Nat. Rev. Mol. Cell. Biol. 12, 517–533 (2011). - PubMed
    1. Bonifacino J. S., Traub L. M., Signals for sorting of transmembrane proteins to endosomes and lysosomes. Annu. Rev. Biochem. 72, 395–447 (2003). - PubMed
    1. Sanger A., Hirst J., Davies A. K., Robinson M. S., Adaptor protein complexes and disease at a glance. J. Cell Sci. 132, jcs222992 (2019). - PubMed
    1. McMahon H. T., Boucrot E., Membrane curvature at a glance. J. Cell Sci. 128, 1065–1070 (2015). - PMC - PubMed
    1. Antonny B., Mechanisms of membrane curvature sensing. Annu. Rev. Biochem. 80, 101–123 (2011). - PubMed

Substances

LinkOut - more resources