. 2025 Aug 15;11(33):eadv7490.
doi: 10.1126/sciadv.adv7490. Epub 2025 Aug 13.

Src/Fas2-dependent Ephrin phosphorylation initiates Eph/Ephrin reverse signaling through Rac1 to shape columnar units in the fly brain

Affiliations

Src/Fas2-dependent Ephrin phosphorylation initiates Eph/Ephrin reverse signaling through Rac1 to shape columnar units in the fly brain

Miaoxing Wang et al. Sci Adv. .

Abstract

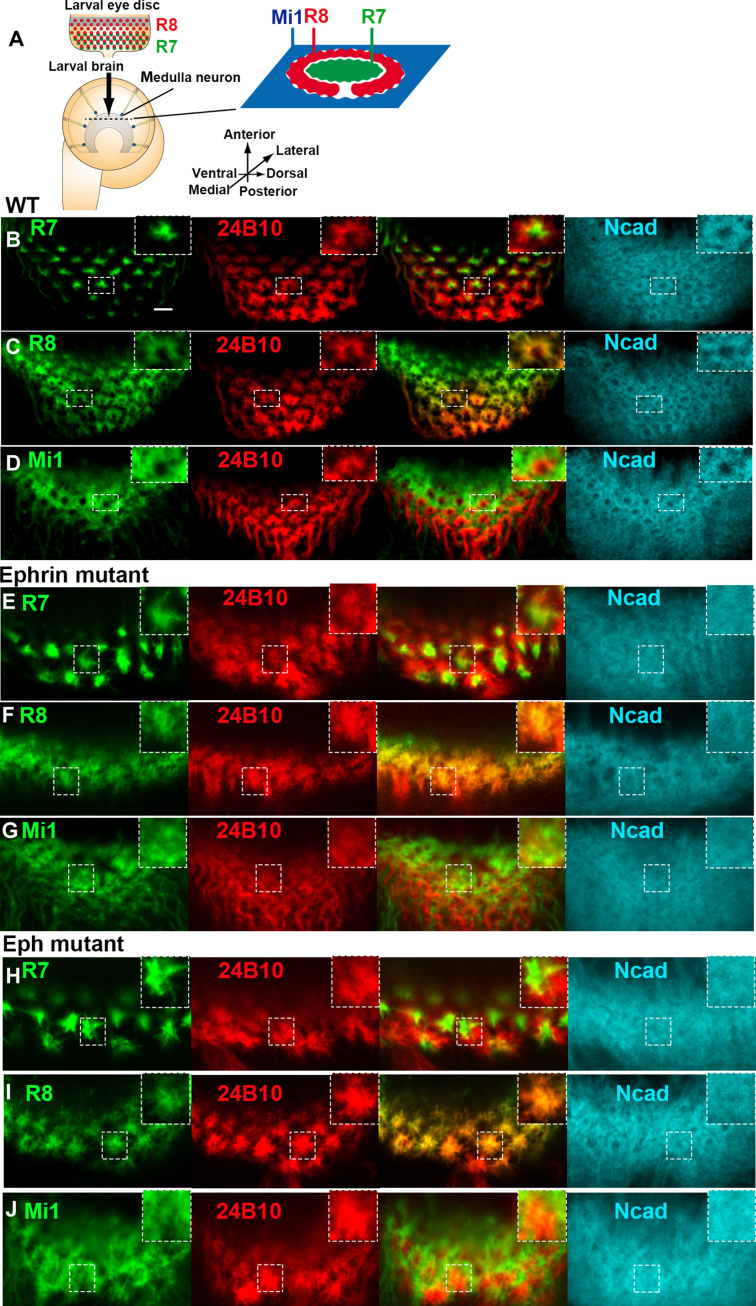
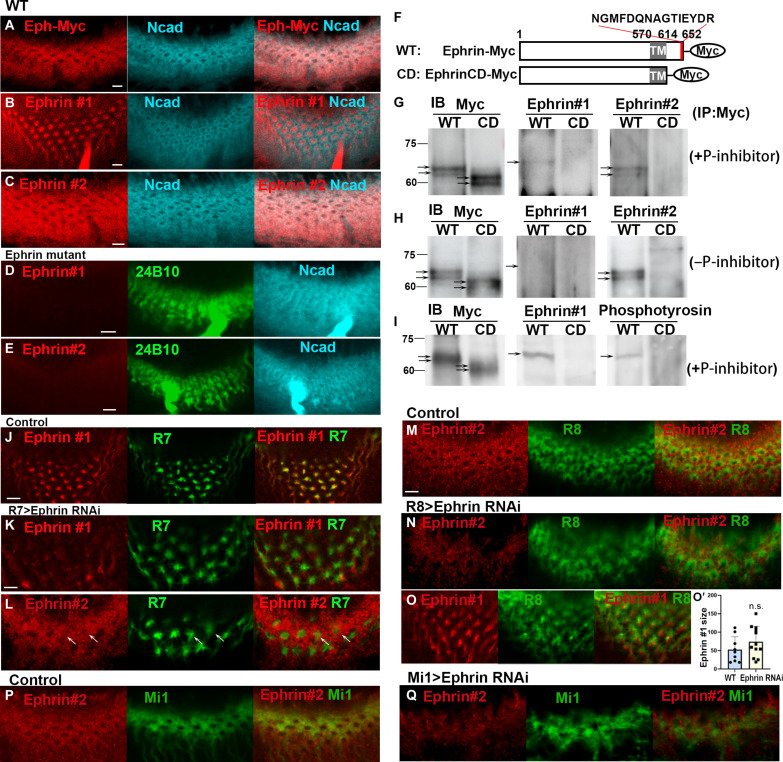
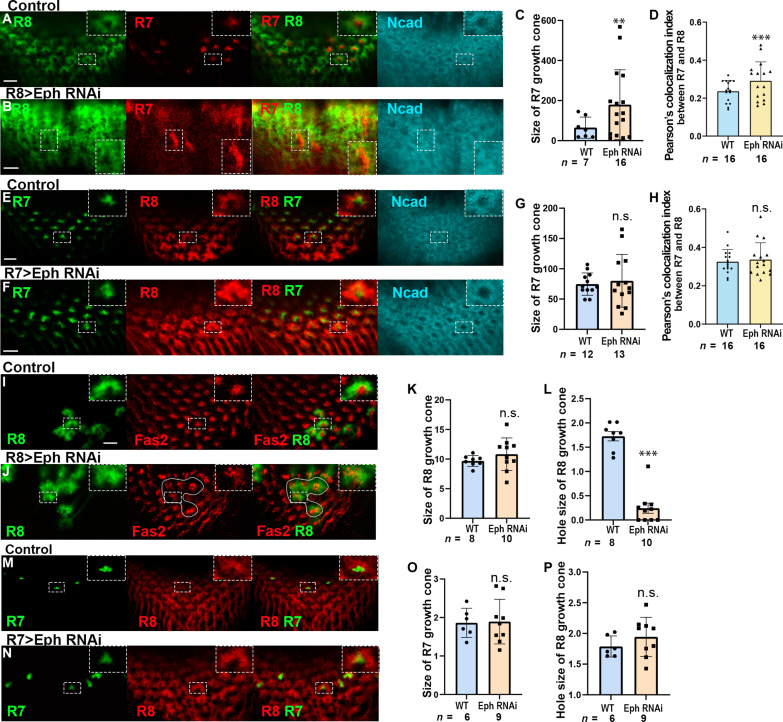
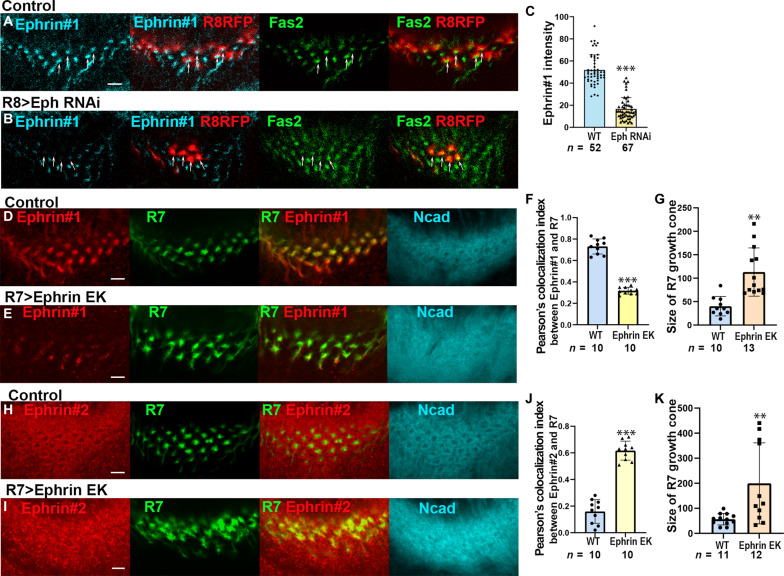
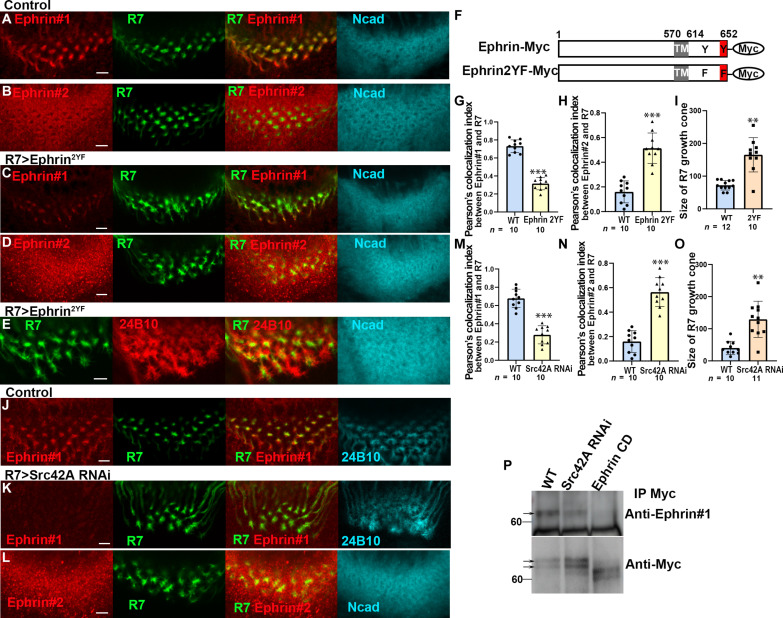
Columns are the morphological and functional units containing multiple neurons in the brain. The molecular mechanisms of column formation are largely unknown. Ephrin/Eph signaling mediates a variety of developmental processes. Ephrin acts as a ligand for Eph to regulate forward signaling, whereas Eph acts as a ligand for Ephrin to regulate reverse signaling. However, whether and how the uni- or bidirectional Ephrin/Eph signaling is involved in column formation remains elusive. In this study, we show that Ephrin and Eph regulate the morphology and location of columnar neurons through bidirectional repulsive signaling. Furthermore, Eph ligand triggers cytoplasmic tyrosine phosphorylation of Ephrin under the control of Src kinases and Fasciclin 2 (Fas2), forming the Ephrin/Src/Fas2 complex to promote reverse signaling through a downstream regulator, Rac1. This study provides the detailed analysis of the molecular interactions involved in column formation using the fly brain as a model.


Figures

Fig. 1.
Fig. 1.. Ephrin and Eph regulate the morphology of neurites of columnar neurons.
Schematics of the developing larval visual systems. In the larval eye disc, R8 and R7 are sequentially differentiated behind the morphogenetic furrow. Columns are identifiable along the planes indicated by dashed lines in the optic lobe. (A to D) R7 growth cone (B; green) occupies the dot-like central region of the column shown by Ncad (blue), R8 (C; green) enwraps the R7 growth cone forming a horseshoe-like region, and Mi1 (D; green) occupies a grid-like region outside the R8 growth cone. 24B10 (red) visualizes R8 growth cones. (E to J) In Ephrin-null mutant (EphrinI95) (E to G) and Eph-null mutant (EphX652) (H to J), the morphology of the three core columnar neurons is disorganized: R7 shows an expanded axon growth cone; R8 axon growth cone penetrates the central hole region, disrupting the horseshoe-like pattern; Mi1 neurite also penetrates the central hole region, disrupting the grid-like pattern. Scale bar, 5 μm.
Fig. 2.
Fig. 2.. Distributions of Eph and Ephrin in columnar neurons.
(A) Anti-Myc antibody staining revealed a grid-like expression of Eph-Myc (red) overlapping with Ncad staining (blue). (B and C) Ephrin #1 and Ephrin #2 antibodies (red) show different patterns that are complementary to each other. Ephrin #1 shows a dot-like pattern, and Ephrin #2 shows a grid-like pattern. Ncad, blue. (D and E) Both the signals of Ephrin #1 and Ephrin #2 were lost in the Ephrin mutant. (F) Structure of Ephrin-Myc (WT) and EphrinCD-Myc (CD), a cytoplasmic deletion mutant. (G and H) Validation of Ephrin antibodies by immunoblotting (IB) followed by anti-Myc immunoprecipitation (IP). In the presence of phosphatase inhibitor, Ephrin #1 detects one band in WT, whereas Ephrin #2 detects two bands that are also detected with Myc-antibody in WT (G). In the absence of the phosphatase inhibitor, no band is detected by Ephrin #1, whereas signals of Ephrin #2 are enhanced (H). (I) Validation of Ephrin phosphorylation by immunoblotting followed by anti-Myc immunoprecipitation. In the presence of phosphatase inhibitor, both Ephrin #1 and phosphotyrosine antibodies detect one band in WT, which is absent in CD. (J to L) Knocking down Ephrin in R7 decreased Ephrin #1 signals and caused ectopic Ephrin #2 signals (arrows in L). (M to O) Ephrin knockdown in R8 (N) reduced Ephrin #2 signals (red) in R8 growth cones (R8-Gal4 UAS-GFP, green) without affecting Ephrin #1 signals (O). (O′) Quantification of the area size of Ephrin #1 signals (in J and O). (P and Q) Ephrin knockdown in Mi1 (Q) reduced Ephrin #2 signals (red; Mi1-Gal4 UAS-GFP, green). Scale bars, 5 μm.
Fig. 3.
Fig. 3.. Ephrin expressed in R7 regulates the organization of columnar neurons.
(A and B) Ephrin knockdown in R7 disturbs the separation of R7 (green) and R8 (red) growth cones and column formation (Ncad, blue). (C) Quantification of the size of R7 growth cones (in A and B). (D) Overlapping of the growth cones of R7 and R8 (in A and B). (E) Quantification of the R7 growth cone arrangement (in A and B). (F and G) Ephrin knockdown in R8 did not affect the separation of R7 (red) and R8 growth cones (green) and column formation (Ncad, blue). (H) Quantification of the size of R7 growth cones (in F, G). (I) Overlapping of the growth cones of R7 and R8 (in F and G). (J and K) R7-specific MARCM clones expressing Ephrin RNAi show the disorganization and overlapping of R7 (green) and R8 (24B10, red) growth cones. (L) Quantification of the size of R7 growth cones (in J and K). (M) Quantification of the hole size of R8 growth cones (in J and K). (N and O) R8-specific MARCM clones expressing Ephrin RNAi show no defects of R7 and R8 growth cones. Arrows indicate the clones. (P) Quantification of the size of R8 growth cones (in N and O). (Q) Quantification of the hole size of R8 growth cones (in N and O). (R) Overexpression of EphrinEK in R7 disturbs the separation of R7 (green) and R8 (24B10, red) growth cones. (T) Overexpression of EphrinEK in R8 did not affect the separation of R7 and R8 growth cones. (S and U) Quantification of the size of R7 growth cones (in R and T, respectively). The dashed boxes are enlarged in the top-right panels (in A, B, F, G, J, K, N, O, R, and T). Scale bars, 5 μm.
Fig. 4.
Fig. 4.. Eph expressed in R8 regulates the organization of columnar neurons.
(A and B) Eph knockdown in R8 disturbs the separation of R8 (R8-Gal4 UAS-GFP, green) and R7 (R7-LexA LexAop-RFP, red) growth cones and column formation (Ncad, blue). (C) Quantification of the size of R7 growth cones (in A and B). (D) Overlapping of the growth cones of R7 and R8 (in A and B). (E and F) Eph knockdown in R7 did not affect the separation of R7 and R8 growth cones and column formation (Ncad, blue). (G) Quantification of the size of R7 growth cones (in E and F). (H) Overlapping of the growth cones of R7 and R8 (in E and F). (I and J) R8-specific MARCM clones expressing Eph RNAi show the disorganization of R7 (Fas2, red) and R8 (R8-Gal4 UAS-GFP, green) growth cones. (K) Quantification of the size of R8 growth cones (in I and J). (M and N) R7-specific MARCM clones expressing Eph RNAi show no significant defect of R7 (R7-Gal4 UAS-GFP, green) and R8 (24B10, red) growth cones. (L) Quantification of the hole size of R8 growth cones (in I and J). (O) Quantification of the size of R7 growth cones (in M and N). (P) Quantification of the hole size of R8 growth cones (in M and N). Arrows indicate the clones. The dashed boxes are enlarged in the top-right panels (in A, B, E, F, I, J, M, and N). Scale bars, 5 μm.
Fig. 5.
Fig. 5.. Interaction between Ephrin and Eph is required for Ephrin phosphorylation.
(A and B) Ephrin#1 signals (blue) were down-regulated nearby R8 growth cones (R8-LexA LexAop-RFP) expressing Eph RNAi (white arrows). R7 growth cones were visualized by Fas2 staining (green). (C) Quantification of the signal intensities of Ephrin #1 (in A and B). (D to K) Expression of EphrinEK in R7 caused down-regulation of Ephrin #1 signals (E), up-regulation of Ephrin #2 signals (I), and enlargement of R7 growth cones (E and I). (F and J) Quantification of the signal intensities of Ephrin #1 (in D and E) and Ephrin #2 (in H and I) in R7 growth cones. (G and K) Quantification of the size of R7 growth cones (in D, E, H, and I). Scale bars, 5 μm.
Fig. 6.
Fig. 6.. Tyrosine phosphorylation of Ephrin under the control of Src is required for Eph/Ephrin signaling.
(A to E) Expression of Ephrin2YF in R7 decreased Ephrin #1 signals (C), increased Ephrin #2 signals (D), and enlarged the growth cones of R7 (B, D, and E). (F) Two tyrosine residues in the cytoplasmic domain of Ephrin were mutated to phenylalanine in Ephrin2YF. (G to I) Quantification of the signal intensities of Ephrin #1 (in A and C), Ephrin #2 (in B and D), and the size of R7 growth cones (in A to E). (J to L) Src42A knocked down in R7 decreased Ephrin #1 signals (K) and increased Ephrin #2 signals (L). 24B10, blue (J and K); Ncad, blue (L). (M to O) Quantification of the signal intensities of Ephrin#1 (in J and K), Ephrin #2 (in B and L), and the growth cones of R7 (in J and K). Results were statistically analyzed using Welch’s t test. **P < 0.001; ***P < 0.001; n.s., not significant. Scale bars, 5 μm. (P) Ephrin#1 signals were decreased upon Src42A RNAi and EphrinCD expression after immunoprecipitation.
Fig. 7.
Fig. 7.. Fas2 is required for Ephrin phosphorylation in R7.
(A and B) Down-regulation of Ephrin #1 signals (red) and Fas2 (blue) upon Fas2 RNAi in R7. (C to F) Down-regulation of Ephrin#1 (red in C and E) and up-regulation of Ephrin #2 signals (red in D and F) upon Fas2 RNAi in R7. Ncad, blue. (G to K) Quantification of the intensities of Ephrin #1 (in C and E) and Ephrin #2 (in D and F). (I and J) The growth cones of R7 (green) and R8 (24B10, red) were disorganized upon Fas2 RNAi in R7. (K) Quantification of the size of R7 growth cones (in I and J). (L) Ephrin#1 signals decreased upon Fas2 RNAi after immunoprecipitation (arrows). (M) Src42A and Fas2 were coimmunoprecipitated by Ephrin-Myc, whereas only Fas2 was coimmunoprecipitated by EphrinCD-Myc. (N and O) Simultaneous overexpression of Fas2 (PA+ in N or PA− in O isoforms) and Ephrin RNAi in R7 shows disorganized R7 (green) and R8 (red) growth cones. (P and Q) Quantification of the size of R7 growth cones (in P and Q). (R) The growth cones of R7 (green) and R8 (24B10, blue) were disorganized upon Rac1L89 expression in R7. (S) Ectopic expression of Fas2 (blue) in R7 reduced the size of R7 growth cones. (T) Ectopic expression of Fas2 (blue) together with Rac1L89 enlarged R7 growth cones. (U) Quantification of the size of R7 growth cones (in I and R to T). Scale bars, 5 μm. (V) Schematic drawing of Ephrin phosphorylation in R7 depending on the complex of Src, Fas2, and Ephrin triggered by Eph expressed in R8.

Similar articles

References

    1. Hasegawa E., Kitada Y., Kaido M., Takayama R., Awasaki T., Tabata T., Sato M., Concentric zones, cell migration and neuronal circuits in the Drosophila visual center. Development 138, 983–993 (2011). - PubMed
    1. Sanes J. R., Zipursky S. L., Design principles of insect and vertebrate visual systems. Neuron 66, 15–36 (2010). - PMC - PubMed
    1. Trush O., Liu C., Han X., Nakai Y., Takayama R., Murakawa H., Carrillo J. A., Takechi H., Hakeda-Suzuki S., Suzuki T., Sato M., N-cadherin orchestrates self-organization of neurons within a columnar unit in the Drosophila medulla. J. Neurosci. 39, 5861–5880 (2019). - PMC - PubMed
    1. Fischbach K. F., Dittrich A. P. M., The optic lobe of Drosophila melanogaster. I. A Golgi analysis of wild-type structure. Cell Tissue Res. 258, 441–475 (1989).
    1. Takemura S.-Y., Lu Z., Meinertzhagen I. A., Synaptic circuits of the Drosophila optic lobe: The input terminals to the medulla. J. Comp. Neurol. 509, 493–513 (2008). - PMC - PubMed

LinkOut - more resources