. 2025 Aug 15;11(33):eadx0968.
doi: 10.1126/sciadv.adx0968. Epub 2025 Aug 13.

Transcriptome fingerprinting of aberrant fibroblast activation unlocks effective therapeutics to tackle cardiac fibrosis

Affiliations

Transcriptome fingerprinting of aberrant fibroblast activation unlocks effective therapeutics to tackle cardiac fibrosis

Mathieu Cinato et al. Sci Adv. .

Abstract

Aberrant activation of fibroblasts is a pivotal component of cardiac fibrosis predisposing to heart failure. However, the molecular regulation of the functional state of cardiac fibroblasts in fibrosis resolution remains largely unexplored, and therefore, effective antifibrosis therapies are still lacking. By translating mouse transcriptomics to humans, we unlocked common molecular denominators connecting the fibroblast phenotypic state and fibrogenic signaling pathways in cardiac fibrosis. Through the construction of a fibroblast-specific transcriptional gene regulatory network, we found ITGAL and DUSP9 as key druggable targets for human myocardial fibrosis. A computational drug repurposing approach predicted 367 antifibrotic candidate compounds for heart disease. In primary cardiac fibroblasts derived from patients with heart failure, we provided experimental validation of the top 2-ranked repositioned drug candidates and their combination. These innovative approaches facilitate the identification of potential targets and drug candidates for cardiac fibrosis, providing actionable opportunities for clinical translation.


Figures

Fig. 1.
Fig. 1.. Phenotypic and transcriptome switching of activated mouse cardiac fibroblasts priming cardiac fibrosis.
Cells were starved for 2 hours in 2% serum-containing medium and then treated with TGFβ (10 ng/ml) at the indicated times. (A to C) Analysis of the TGFβ-activated fibrogenic phenotype in mouse cardiac fibroblasts (n = 3 to 10[Vehicle], 4 to 11[TGFβ]). (A) Abnormal collagen production after 72 hours of TGFβ. Left: Representative images of Picrosirius red staining and immunofluorescence staining of Collagen 1A1 (Col1A1) in red. Right: Quantifications of Collagen level by measuring the 570-nm absorbance after eluting the Sirius Red deposit and measurement of Col1A1 fluorescence intensity. (B) Fibroblast-to-myofibroblast transition after 24 hours of TGFβ. Left: Representative images of the immunofluorescence staining of αSMA in green. Right: Quantifications of αSMA expression. (C) MitoSOX-detected mitochondrial ROS release after 1 hour of TGFβ. Left: Representative images for the MitoSOX signal in red. Right: Quantifications of mitochondrial ROS production. Nuclei are stained in blue with 4′,6-diamidino-2-phenylindole (DAPI). (D) Heatmap of the top 40 genes enriched in TRANSPATH categories. The colored bar at the top indicates sample types. (E and F) Validation of RNA-seq results using qRT-PCR: (E) up-regulated and (F) down-regulated genes in naive and 24 hours of TGFβ-activated cardiac fibroblasts (nmice = 4 from independent isolations). Values are presented as means ± SEM. P values were calculated using an unpaired two-tailed Student’s t test.
Fig. 2.
Fig. 2.. Validation of up-regulated and down-regulated genes in a mouse model of TAC-induced HF.
(A to F) Phenotypic validation of TAC mouse model after 5 weeks of pressure overload. (A) Representative images of Picrosirius red staining. (B) Quantification of collagen disposition in heart cryosections. (C) mRNA expression of Collagen 1A1 (Col1a1) measured by qRT-PCR. (D) Representative echocardiographic images of LV structure and function. [(E) and (F)] Quantification of LV systolic function: (E) EF and (F) FS. (G and H) Validation of RNA-seq results using qRT-PCR: mRNA expression of the indicated (G) up-regulated and (H) down-regulated genes in sham and TAC-challenged mice. Values are presented as means ± SEM (nmice = 3 to 6[Sham], 4 to 6[TAC]). P values were calculated using an unpaired two-tailed Student’s t test.
Fig. 3.
Fig. 3.. Characteristics of up-regulated and down-regulated genes in aberrantly activated mouse cardiac fibroblasts.
Enriched GO (biological process) of (A) up-regulated and (B) down-regulated genes in naive and TGFβ-activated cardiac fibroblasts. Enriched TRANSPATH Pathways (2020.1) of (C) up-regulated and (D) down-regulated genes in TGFβ-challenged cardiac fibroblasts versus naive cells.
Fig. 4.
Fig. 4.. Diagram of intracellular regulatory signal transduction pathways of up-regulated genes in TGFβ-activated cardiac fibroblasts versus naive cells for top 5 master regulators.
Designations: pink rectangles, master regulators; light blue rectangles, TFs; green rectangles are intermediate molecules, which have been added to the network during the search for master regulators from the selected TFs. Orange and blue frames highlight molecules that are encoded by up-regulated and down-regulated genes, respectively.
Fig. 5.
Fig. 5.. Diagram of intracellular regulatory signal transduction pathways of down-regulated genes in TGFβ-challenged cardiac fibroblasts for five top-ranking master regulators.
Designations: pink rectangles, master regulators; light blue and violet rectangles, entities related to TFs; green rectangles are intermediate molecules, which have been added to the network during the search for master regulators from the selected TFs. Orange and blue frames highlight molecules that are encoded by up-regulated and down-regulated genes, respectively.
Fig. 6.
Fig. 6.. Signal transduction cascades regulating activation or deactivation of cardiac fibroblasts in response to TGFβ.
Signal transduction cascade that demonstrates the causative relationship between TGFβ-triggered up-regulation of integrins expression (pink node at the top of the network) and activation of respective TFs (blue nodes at the end of the network) that, in turn, bind to their colocalized binding sites in the promoters of genes leading to the up-regulation of their expression. Red arrow shows the position of TSSs in each gene. The promoter aria (from −1000 to +100 around the TSS) is shown with the TFBSs marked by the names of the respective PWMs of the TFs binding to these sites.
Fig. 7.
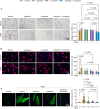
Fig. 7.. Collagen and mitochondrial ROS production inhibition by drug candidates and their combination in TGFβ-activated cardiac fibroblasts from patients with HF.
(A and B) Analysis of the TGFβ-activated fibrogenic phenotype in human primary cardiac fibroblasts treated with 5 nM dasatinib, 1 μM lovastatin, or a combination of 5 nM dasatinib and 1 μM lovastatin. Cells were starved for 2 hours in 0.5% serum-containing medium, pretreated with the indicated doses of the drugs for 20 min, and stimulated with TGFβ during the indicated times. (A) Collagen production after 72-hour exposure to TGFβ (10 ng/ml). Left: Representative images of Picrosirius red staining. Right: Quantifications of total collagen content by measuring the 570-nm absorbance after eluting the Sirius Red deposit in cardiac fibroblasts from patients with HF (nwell per patient = 2; npatient = 3). (B) MitoSOX-detected mitochondrial ROS release after 1-hour exposure to TGFβ (10 ng/ml). Left: Representative images of MitoSOX immunofluorescence staining in red. Right: Quantifications of MitoSOX signals in cardiac fibroblasts from patients with HF (n = 4 to 9 fields of 6.25 mm2 from three patients per group). Nuclei are stained in blue with DAPI. Values are the means ± SEM; P values are calculated by two-way ANOVA followed by Tukey’s multiple comparisons post hoc test. (C) Fibroblast-to-myofibroblast transition after 24 hours of TGFβ. Left: Representative confocal images of immunofluorescence staining of αSMA in green. Right: Quantifications of αSMA expression. Nuclei are stained in blue with DAPI (n = 17 to 43 cells from three patients per group).

References

    1. Gyöngyösi M., Winkler J., Ramos I., Do Q.-T., Firat H., McDonald K., González A., Thum T., Díez J., Jaisser F., Pizard A., Zannad F., Myocardial fibrosis: Biomedical research from bench to bedside. Eur. J. Heart Fail. 19, 177–191 (2017). - PMC - PubMed
    1. Aoki T., Fukumoto Y., Sugimura K., Oikawa M., Satoh K., Nakano M., Nakayama M., Shimokawa H., Prognostic impact of myocardial interstitial fibrosis in non-ischemic heart failure—Comparison between preserved and reduced ejection fraction heart failure. Circ. J. 75, 2605–2613 (2011). - PubMed
    1. Assomull R. G., Prasad S. K., Lyne J., Smith G., Burman E. D., Khan M., Sheppard M. N., Poole-Wilson P. A., Pennell D. J., Cardiovascular magnetic resonance, fibrosis, and prognosis in dilated cardiomyopathy. J. Am. Coll. Cardiol. 48, 1977–1985 (2006). - PubMed
    1. Gulati A., Jabbour A., Ismail T. F., Guha K., Khwaja J., Raza S., Morarji K., Brown T. D. H., Ismail N. A., Dweck M. R., Di Pietro E., Roughton M., Wage R., Daryani Y., O’Hanlon R., Sheppard M. N., Alpendurada F., Lyon A. R., Cook S. A., Cowie M. R., Assomull R. G., Pennell D. J., Prasad S. K., Association of fibrosis with mortality and sudden cardiac death in patients with nonischemic dilated cardiomyopathy. JAMA 309, 896–908 (2013). - PubMed
    1. Travers J. G., Kamal F. A., Robbins J., Yutzey K. E., Blaxall B. C., Cardiac fibrosis: The fibroblast awakens. Circ. Res. 118, 1021–1040 (2016). - PMC - PubMed

LinkOut - more resources