. 2025 Aug 15;11(33):eadx4909.
doi: 10.1126/sciadv.adx4909. Epub 2025 Aug 13.

Elusive tropical forest canopy diversity revealed through environmental DNA contained in rainwater

Affiliations

Elusive tropical forest canopy diversity revealed through environmental DNA contained in rainwater

Lucie Zinger et al. Sci Adv. .

Abstract

Exploring the biodiversity hidden in tropical rainforests canopies represents a major frontier in biodiversity research yet remains challenging. Environmental DNA (eDNA) can revolutionize this field as it did already in various ecosystems. Here, we test the hypothesis that eDNA contained in canopy throughfall could be used to monitor this elusive diversity and detect anthropogenic disturbance. Using custom-made, low-cost rain collectors, we sampled rainwash eDNA in a mature Amazonian forest and a nearby tree plantation. We successfully detected eDNA from tropical woody and epiphyte plants, vertebrates (mammals, birds, and amphibians), and insects (e.g., mosquitoes, ants, and beetles). The taxonomic composition and diversity reflected disturbance, with significantly lower diversity in the plantation. Crucially, rainwash eDNA integrated biodiversity over a 10-day period in passive collectors and provided a local signature. This approach has thus potential for establishing a cost-effective monitoring system for tropical moist forest canopies, applicable in impact assessments and sustainable management.


Figures

Fig. 1.
Fig. 1.. Overview of the study experimental designs.
(A) Description of the temporal and spatial experiments in terms of precipitation received throughout the sampling periods, initial setting (i.e., addition of carrot spike-in or not), and the spatial and temporal distribution of the sampling points. Orange plots: Tree plantation. Green plots: Old-growth forest. (B) Pictures of a canopy rainwash sampler (see also fig. S1) and of passive eDNA samplers through eDNA fixation (Cm, ceramic mosaics; CEm, cellulose ester membrane; Cs, cotton strips) or through rainwash water filtration by gravity (Wf, Waterra filters). Image credits: A.I., CNRS.
Fig. 2.
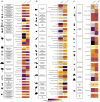
Fig. 2.. Taxonomic composition of canopy rainwash eDNA in the tree plantation and the old-growth forest plots for plants and animals.
(A) Plants, (B) vertebrates, and (C) insects in the temporal experiment. Only taxa with a relative abundance (in terms of % reads) > 0.5% in the total dataset are shown (summarized at the family levels for plants and insects). The percentage of reads reported here corresponds to sequencing reads summed across all samples of the same condition (n = 25 per forest type, i.e., five spatial and five temporal sampling points). Gray cells correspond to null values and black ones to very small and yellow ones to high values. NA, not applicable.
Fig. 3.
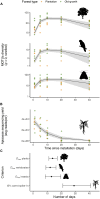
Fig. 3.. Dynamics and optimal temporal sampling window of rainwash eDNA.
Dynamics of (A) MOTU diversity (q = 0, rarefied data) of plants, vertebrates, or insects and (B) amount of carrot spike-in DNA. Gray lines and gray transparent ribbons in (A) and (B) correspond to the models’ fits (see also table S3) and 95% confidence interval. (C) Temporal window of detection in terms of maximum diversity for each target clade or of 5% of spike-in initial concentration, with confidence intervals at 95%.
Fig. 4.
Fig. 4.. Accumulation of rainwash eDNA diversity with increasing sampling effort for plants and insects.
Points correspond to observed diversity values. The different line types represent parameters or curves derived from the Monod models’ fits (see also table S4). Vertical lines correspond to the number of samples required to sample 70 and 90% of the plot-scale diversity. For insects, 90% of the diversity requires exceeds 100 samples (see table S4). The transparent ribbons represent the confidence intervals at 95% of extrapolated diversity.

References

    1. Antonelli A., Zizka A., Carvalho F. A., Scharn R., Bacon C. D., Silvestro D., Condamine F. L., Amazonia is the primary source of Neotropical biodiversity. Proc. Natl. Acad. Sci. U.S.A. 115, 6034–6039 (2018). - PMC - PubMed
    1. Kier G., Kreft H., Lee T. M., Jetz W., Ibisch P. L., Nowicki C., Mutke J., Barthlott W., A global assessment of endemism and species richness across island and mainland regions. Proc. Natl. Acad. Sci. U.S.A. 106, 9322–9327 (2009). - PMC - PubMed
    1. FAO, The State of the World’s Biodiversity for Food and Agriculture (FAO Commission on Genetic Resources for Food and Agriculture Assessments, 2019).
    1. IPBES, The IPBES Regional Assessment Report on Biodiversity and Ecosystem Services for the Americas (Secretariat of the Intergovernmental Science-Policy Platform on Biodiversity and Ecosystem Services, 2018).
    1. Lapola D. M., Pinho P., Barlow J., Aragão L. E. O. C., Berenguer E., Carmenta R., Liddy H. M., Seixas H., Silva C. V. J., Silva-Junior C. H. L., Alencar A. A. C., Anderson L. O., Armenteras D., Brovkin V., Calders K., Chambers J., Chini L., Costa M. H., Faria B. L., Fearnside P. M., Ferreira J., Gatti L., Gutierrez-Velez V. H., Han Z., Hibbard K., Koven C., Lawrence P., Pongratz J., Portela B. T. T., Rounsevell M., Ruane A. C., Schaldach R., da Silva S. S., von Randow C., Walker W. S., The drivers and impacts of Amazon forest degradation. Science 379, eabp8622 (2023). - PubMed

Substances

LinkOut - more resources