. 2025 Aug;240(8):e70084.
doi: 10.1002/jcp.70084.

Fasting-Induced Hepatic Gluconeogenesis Is Compromised In Anxa6-/- Mice

Affiliations

Fasting-Induced Hepatic Gluconeogenesis Is Compromised In Anxa6-/- Mice

Anna Alvarez-Guaita et al. J Cell Physiol. 2025 Aug.

Abstract

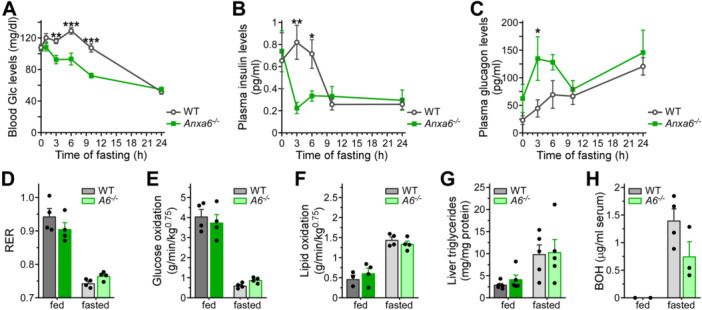
Maintaining constant blood glucose levels is essential for energizing glucose-dependent tissues. During the fed state, insulin lowers elevated blood glucose, while in the fasted state, glucagon maintains blood glucose levels through hepatic stimulation of fatty acid oxidation, glycogenolysis, and gluconeogenesis (GNG). The liver plays a crucial role in these metabolic adaptations. Deregulation of GNG is a hallmark of type 2 diabetes mellitus (T2DM), driven by hepatic insulin resistance, elevated glucagon levels, and excess circulating free fatty acids. The glucose metabolism of 8- to 12-week-old WT and Anxa6 knock-out (Anxa6-/-) mice was analysed during regular feeding and fasting using indirect calorimetry, tolerance tests and biochemical analysis. Despite normal insulin-sensitive control of glucose levels and effective glycogen mobilization, Anxa6-/- mice display rapid hypoglycaemia during fasting. This metabolic disarrangement, in particular during the early stages of fasting is characterized by a low respiratory exchange ratio (RER) and increased lipid oxidation during the diurnal period, indicating a reliance on lipid oxidation due to hypoglycaemia. Elevated glucagon levels during fasting suggest deficiencies in GNG. Further analysis reveals that Anxa6-/- mice are unable to utilize alanine for hepatic GNG, highlighting a specific impairment in the glucose-alanine cycle in fasted Anxa6-/- mice, underscoring the critical role of ANXA6 in maintaining glucose homeostasis under metabolic stress. During fasting, slightly reduced expression levels of alanine aminotransferase 2 (Gpt2) and lactate dehydrogenase (Ldha2), enzymes converting alanine to pyruvate, and the hepatic alanine transporter SNAT4 might contribute to these observations in the Anxa6-/- mice. These findings identify that ANXA6 deficiency causes an inability to maintain glycolytic metabolism under fasting conditions due to impaired alanine-dependent GNG.

Keywords: Annexin A6; SNAT; alanine; alanine‐dependent gluconeogenesis; hypoglycaemia.


Conflict of interest statement

The authors declare no conflicts of interest.

Figures

Figure 1
Figure 1
Energetic imbalance during voluntary fasting (light period) in Anxa6 −/− mice. (A) Respiratory exchange ratio (RER) from WT and Anxa6 −/− mice measured every 20 min (n = 4 mice per group). (B) Glucose oxidation flux expressed as the mean of 6‐h period during day and night‐time of WT and Anxa6 −/− mice (n = 4 mice per group). (C) Lipid oxidation flux expressed as the mean of 6 h period during day and night‐time of WT and Anxa6 −/− mice (n = 4 mice per group). (D) AUC from glucose tolerance test of WT and Anxa6 −/− mice (n = 6 mice per group) after 5 h fasting administrating i.p. 2 g/kg glucose. (E) AUC from insulin tolerance test of WT and Anxa6 −/− mice (n = 6 mice per group) administrating i.p. 0.75 U/kg insulin. (F) Liver glycogen levels in WT and Anxa6 −/− mice (n = 3–6 mice per group and time point) during fasting. (G) Mice ambulation per hour from WT and Anxa6 −/− mice (n = 4 mice per group). Data are expressed as means ± SEM. Data was analysed by two‐way ANOVA with Bonferroni's post‐hoc test (B, F) or unpaired t test (D, E), *p < 0.05, **p < 0.01, ***p < 0.001 comparing Anxa6 −/− to WT mice.
Figure 2
Figure 2
Glucose metabolism during fasting in Anxa6 −/− mice. (A) Blood glucose levels in WT and Anxa6 −/− mice (n = 13 mice per group) during fasting. (B) Plasma insulin levels in WT and Anxa6 −/− mice (n = 6–9 mice per group) during fasting. (C) Plasma glucagon levels in WT and Anxa6 −/− mice (n = 3–6 mice per group) during fasting. (D) Respiratory exchange ratio (RER) expressed as the mean value of a fed period and 12 h fasting period of WT and Anxa6 −/− mice (n = 4 mice per group). (E) Glucose oxidation flux expressed as the mean value of a fed period and 12 h fasting period of WT and Anxa6 −/− mice (n = 4 mice per group). (F) Lipid oxidation flux expressed as the mean value of a fed period and 12 h fasting period of WT and Anxa6 −/− mice (n = 4 mice per group). (G) Hepatic triglyceride levels of WT and Anxa6 −/− mice before and after 12 h fasting (n = 5 mice per group). (H) Blood β‐hydroxybutyrate (BOH, ketone body) levels of WT and Anxa6 −/− mice before and after 12 h fasting (n = 4 mice per group). Data are expressed as means ± SEM. Data was analysed by two‐way ANOVA with Bonferroni's post‐hoc test, *p < 0.05, **p < 0.01, ***p < 0.001 comparing Anxa6 −/− to WT mice.
Figure 3
Figure 3
Hepatic gluconeogenic impairment in Anxa6 −/− mice. (A) Relative liver mRNA expression levels of glucose‐6‐phosphatase (G6pc2) during fasting in WT and Anxa6 −/− mice liver (n = 5 mice per group and time point). (B) Relative liver mRNA expression levels of phosphoenolpyruvate carboxykinase (Pck1) during fasting in WT and Anxa6 −/− mice liver (n = 5 mice per group and time point). (C) Relative liver mRNA expression levels of fructose‐1,6‐bisphosphatase (Fbp1) during fasting in WT and Anxa6 −/− mice liver (n = 5 mice per group and time point). (D) Pyruvate tolerance test of WT and Anxa6 −/− mice (n = 6 mice per group) after 24 h fasting administrating i.p. 2 g/kg of sodium pyruvate. (E) Glycerol tolerance test of WT and Anxa6 −/− mice (n = 6 mice per group) after 24 h fasting administrating i.p. 2 g/kg of glycerol. (F) Glutamine tolerance test of WT and Anxa6 −/− mice (n = 11 mice per group) after 24 h fasting administrating i.p. 2 g/kg of l‐glutamine. (G) Lactate tolerance test of WT and Anxa6 −/− mice (n = 11 mice pre group) after 24 h fasting administrating i.p. 2 g/kg of lactate. (H) Alanine tolerance test of WT and Anxa6 −/− mice (n = 12 mice pre group) after 24 h fasting administrating i.p. 2 g/kg of l‐alanine. Data are expressed as means ± SEM. Data was analysed by two‐way ANOVA with Bonferroni's post‐hoc test, *p < 0.05, **p < 0.01, ***p < 0.001 comparing Anxa6 −/− to WT mice.
Figure 4
Figure 4
ANXA6 deficiency do not affect alanine metabolization capability of the mice liver. (A) Spider diagram representation of relative plasma threonine (l‐Thr), serine (l‐Ser), glutamine (l‐Gln), proline (l‐Pro), glycine (l‐Gly), alanine (l‐Ala), valine (l‐Val), cysteine (l‐Cys), methionine (l‐Met), isoleucine (l‐Ile), leucine (l‐Leu), tyrosine (l‐Tyr), phenylalanine (l‐Phe), lysine (l‐Lys), histidine (l‐His) and arginine (l‐Arg) levels of WT and Anxa6 −/− mice fed and fasted for 24 h (n = 4 mice per group). (B) Spider diagram representation of relative hepatic aspartic acid (l‐Asp), threonine (l‐Thr), serine (l‐Ser), asparagine (l‐Asn), glutamic acid (l‐Glu), glutamine (l‐Gln), proline (l‐Pro), glycine (l‐Gly), alanine (l‐Ala), valine (l‐Val), methionine (l‐Met), isoleucine (l‐Ile), leucine (l‐Leu), tyrosine (l‐Tyr), phenylalanine (l‐Phe), lysine (l‐Lys), histidine (l‐His) and arginine (l‐Arg) levels of WT and Anxa6 −/− mice fed and fasted for 24 h (n = 4 mice per group). (C) Plasma alanine levels in WT and Anxa6 −/− mice fed and fasted for 24 h (n = 4 each group). (D) Hepatic alanine levels in WT and Anxa6 −/− mice fed and fasted for 24 h (n = 4 each group). (E) Hepatic glutamic acid levels in WT and Anxa6 −/− mice fed and fasted for 24 h (n = 4 each group). (F) Urine urea levels in WT and Anxa6 −/− mice fed and fasted for 24 h (n = 4‐6 each group). (G) Hepatic ornithine levels in WT and Anxa6 −/− mice fed and fasted for 24 h (n = 4 each group). Data are expressed as means ± SEM. Data was analysed by two‐way ANOVA with Bonferroni's post‐hoc test, *p < 0.05, **p < 0.01, ***p < 0.001 comparing Anxa6 −/− to WT mice. In panels (A) and (B), # indicates lack of expected differences between fed and fast state in Anxa6 −/− compared to WT mice.
Figure 5
Figure 5
Hepatic alanine metabolization capacity in Anxa6 −/− mice. (A) Relative liver mRNA expression levels of alanine aminotransferase 1 (Gpt1) during fasting in WT and Anxa6 −/− mice liver (n = 5 per group and time point). (B) Relative liver mRNA expression levels of alanine aminotransferase 2 (Gpt2) during fasting in WT and Anxa6 −/− mice liver (n = 5 per group and time point). (C) Alanine aminotransferase activity in WT and Anxa6 −/− liver during fasting (n = 5 per group and time point). (D) Relative liver mRNA expression levels of lactate dehydrogenase (Ldha2) during fasting in WT and Anxa6 −/− mice liver (n = 5 per group and time point). Data are expressed as means ± SEM. Data was analysed by two‐way ANOVA with Bonferroni's post‐hoc test, *p < 0.05, **p < 0.01, ***p < 0.001 comparing Anxa6 −/− to WT mice.
Figure 6
Figure 6
Hepatic alanine transporters during fasting in Anxa6 −/− mice. (A) Relative liver mRNA expression levels of SNAT2 (Slc38a2) after 24 h fasting in WT and Anxa6 −/− mice liver (n = 5 per group and time point). (B) Relative liver mRNA expression levels of SNAT4 (Slc38a4) after 24 h fasting in WT and Anxa6 −/− mice liver (n = 5 per group and time point). (C) Relative expression of SNAT4 amino acid transporter after 24 h fasting in WT and Anxa6 −/− mice liver (n = 2 per group and time point). (D) Relative quantification of SNAT4 amino acid transporter expression after 24 h fasting in WT and Anxa6 −/− mice liver (n = 4 mice per group and time point). (E) Schematic representation of gluconeogenic pathway in WT and Anxa6 −/− hepatocytes during fasting in mice. The lack of ANXA6 reduces hepatic alanine uptake and compromises alanine‐dependent gluconeogenesis required for blood glucose homeostasis during fasting. Abbreviations: 2‐OG, 2‐oxoglutarate; Glu, glutamic acid; Orn, ornithine; ALAT, alanine aminotransferase; LDH, lactate dehydrogenase; GLC‐6‐Pase, glucose‐6‐phosphatase. Data are expressed as means ± SEM. Data was analysed by two‐way ANOVA with Bonferroni's post‐hoc test, *p < 0.05, **p < 0.01, ***p < 0.001 comparing Anxa6 −/− to WT mice.

Similar articles

References

    1. Alvarez‐Guaita, A. , Blanco‐Muñoz P., Meneses‐Salas E., et al. 2020. “Annexin A6 Is Critical to Maintain Glucose Homeostasis and Survival During Liver Regeneration in Mice.” Hepatology 72, no. 6: 2149–2164. 10.1002/hep.31232. - DOI - PubMed
    1. Alvarez‐Guaita, A. , Vilà de Muga S., Owen D. M., et al. 2015. “Evidence for Annexin A6‐Dependent Plasma Membrane Remodelling of Lipid Domains.” British Journal of Pharmacology 172, no. 7: 1677–1690. 10.1111/bph.13022. - DOI - PMC - PubMed
    1. Cahill, Jr., G. F. 2006. “Fuel Metabolism in Starvation.” Annual Review of Nutrition 26: 1–22. 10.1146/annurev.nutr.26.061505.111258. - DOI - PubMed
    1. Cairns, R. , Fischer A. W., Blanco‐Munoz P., et al. 2018. “Altered Hepatic Glucose Homeostasis in AnxA6‐KO Mice Fed a High‐Fat Diet.” PLoS One 13, no. 8: e0201310. 10.1371/journal.pone.0201310. - DOI - PMC - PubMed
    1. Curnock, R. , Calcagni A., Ballabio A., and Cullen P. J.. 2019. “TFEB Controls Retromer Expression in Response to Nutrient Availability.” Journal of Cell Biology 218, no. 12: 3954–3966. 10.1083/jcb.201903006. - DOI - PMC - PubMed

MeSH terms

LinkOut - more resources