. 2025 Aug 13;20(8):e0329441.
doi: 10.1371/journal.pone.0329441. eCollection 2025.

Effects of low-temperature stress at different growth stages on rice physiology, pollen viability and yield in China's cold region

Affiliations

Effects of low-temperature stress at different growth stages on rice physiology, pollen viability and yield in China's cold region

Lifeng Guo et al. PLoS One. .

Abstract

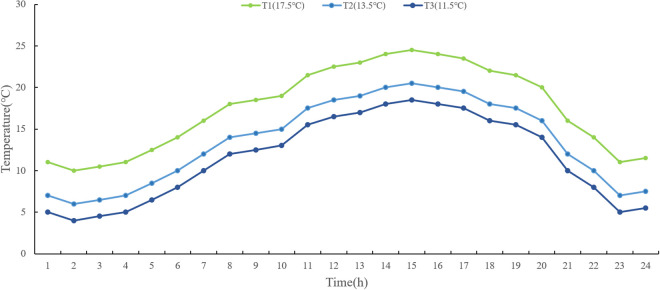
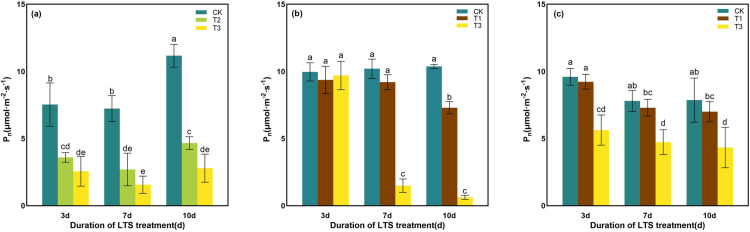
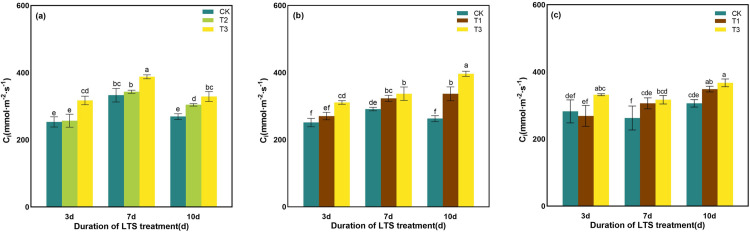
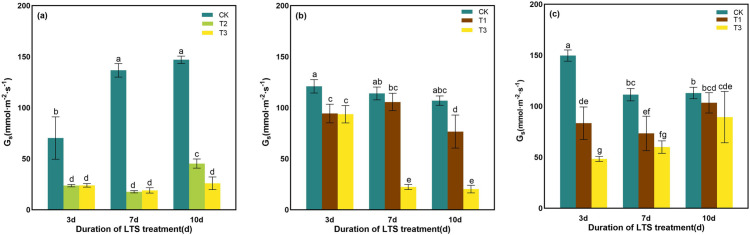
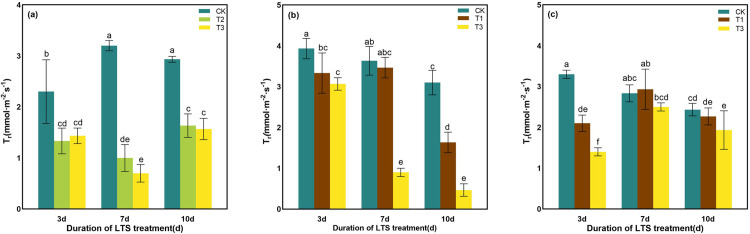
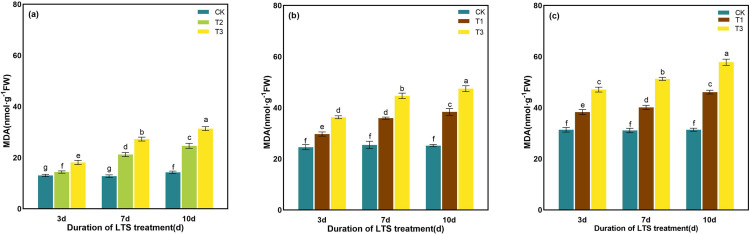
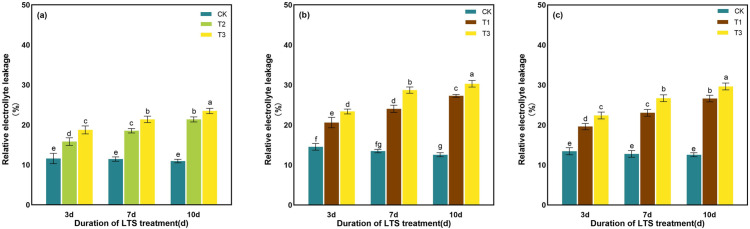
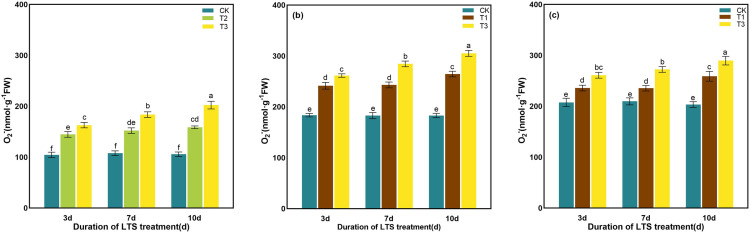
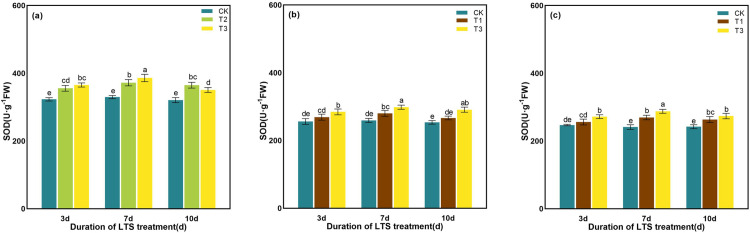
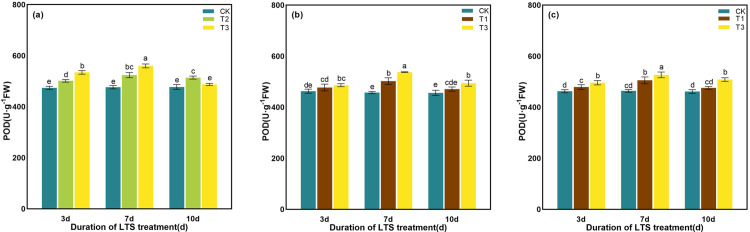
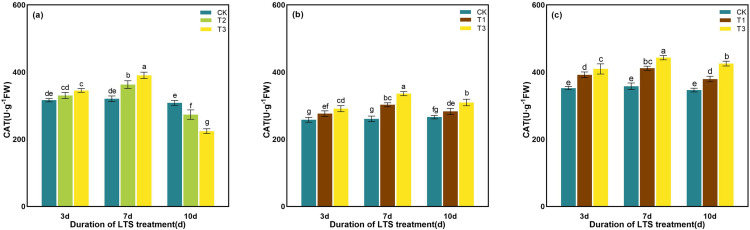
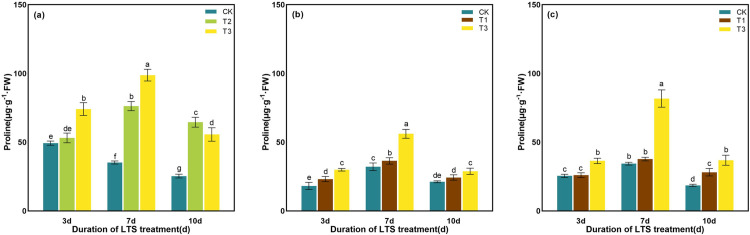
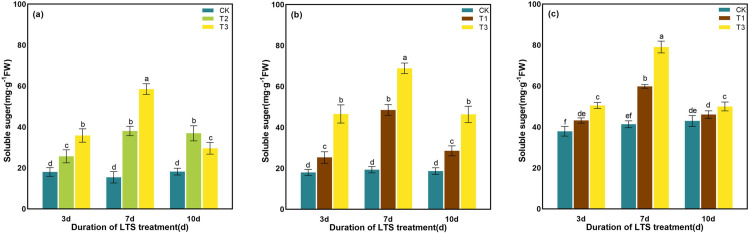
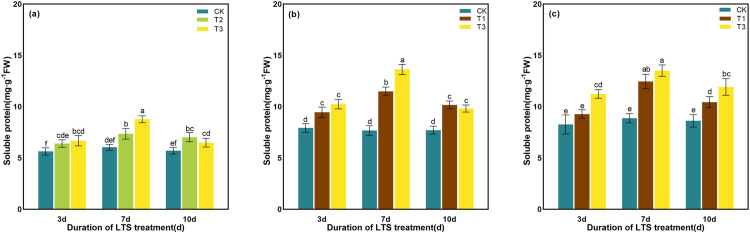
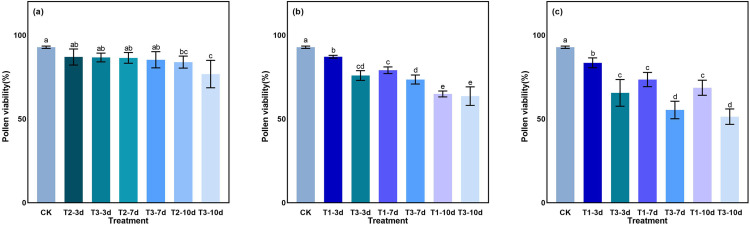
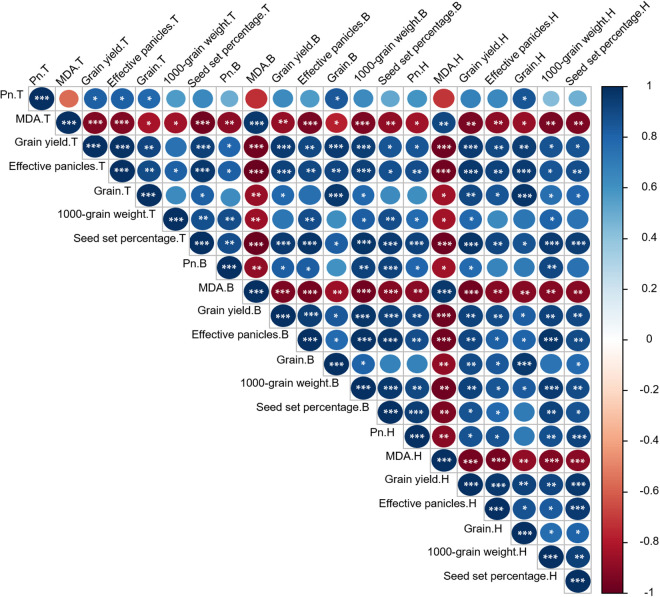
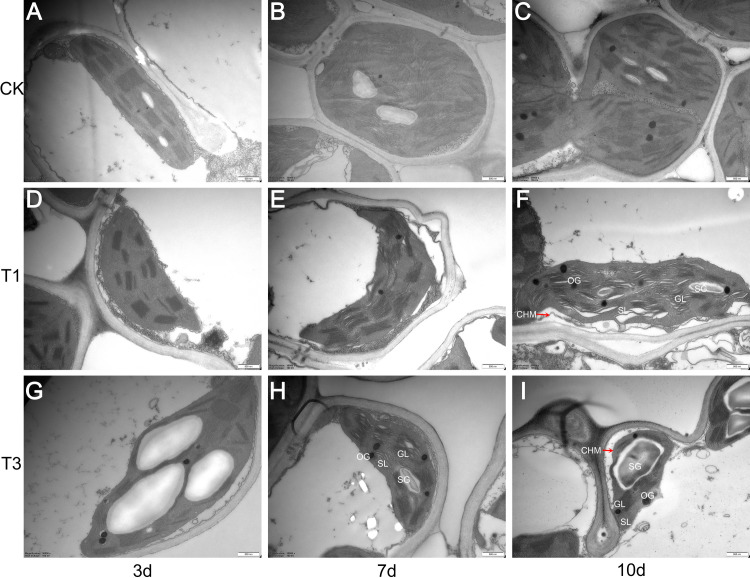
Low-temperature stress (LTS) is a major limiting factor for rice production in high-latitude regions. Many studies have reported the impacts of LTS on leaf photosynthesis and yield, but few of them explored the response of photosynthesis, chloroplast ultrastructure, pollen fertility, cold stress adaptation to LTS at different growth stages of rice. In this study, we conducted a two-year temperature-controlled field experiment (in 2023 and 2024) to investigate the effects of LTS at the tillering, booting, and heading stages on physiological and biochemical characteristics, plant growth, pollen fertility, and grain yield for a japonica rice cultivar (Longgeng31). The results showed that rice photosynthesis gradually decreased as the LTS temperature was decreasing and the LTS duration was increasing. The net photosynthetic rate (Pn) decreased the most at the booting stage, followed by the tillering, and the heading stages. Compared with controlled group (CK), the LTS treatment at 11.5°C for 3-10 days significantly reduced Pn by 52.2% ~ 62.7%, 85.3% ~ 93.9% and 39.3% ~ 44.9%, at the tillering stage, booting and heading stages respectively. Increasing LTS intensity and duration caused distorted chloroplast morphology and reduced plant height. The concentrations of the antioxidant and osmotic regulation systems in rice peaked after 7 days of LTS treatment, indicating that the stress response to LTS showed a trend of initially increasing and subsequently decreasing. The grain yield decreased the most under LTS at the booting stage by 59.30%-88.76% on D10, followed by the heading and tillering stages. After 10 days of exposure to LTS, the pollen viability decreased most significantly at the heading stage by 44.67%, followed by the booting and the tillering stages. These findings could provide a theoretical basis for identifying and evaluating LTS in rice under field conditions, and provide a methodological reference for the identification and monitoring of LTS in other crops, thereby holding significant practical implications.


Conflict of interest statement

The authors have declared that no competing interests exist.

Figures

Fig 1
Fig 1. The hourly temperatures in the phytotron.
Fig 2
Fig 2. Effects of LTS on Pn.
(a)-(c) the variation trend of the tillering, booting and heading stages. CK, under natural conditions (control); T1, under LTS of 17.5°C; T2, under LTS of 13.5°C; T3, under LTS of 11.5°C. 3d, 7d and 10d were duration of LTS. Error bars represented Mean ± SE (n = 3). Different letters in lowercase indicated significant difference of the data in all treatments at P < 0.05.
Fig 3
Fig 3. Effects of LTS on Ci.
(a)-(c) the variation trend of the tillering, booting and heading stages. CK, under natural conditions (control); T1, under LTS of 17.5°C; T2, under LTS of 13.5°C; T3, under LTS of 11.5°C. 3d, 7d and 10d were duration of LTS. Error bars represented Mean ± SE (n = 3). Different letters in lowercase indicated significant difference of the data in all treatments at P < 0.05.
Fig 4
Fig 4. Effects of LTS on Gs.
(a)-(c) the variation trend of the tillering, booting and heading stages. CK, under natural conditions (control); T1, under LTS of 17.5°C; T2, under LTS of 13.5°C; T3, under LTS of 11.5°C. 3d, 7d and 10d were duration of LTS. Error bars represented Mean ± SE (n = 3). Different letters in lowercase indicated significant difference of the data in all treatments at P < 0.05.
Fig 5
Fig 5. Effects of LTS on Tr.
(a)-(c) the variation trend of the tillering, booting and heading stages. CK, under natural conditions (control); T1, under LTS of 17.5°C; T2, under LTS of 13.5°C; T3, under LTS of 11.5°C. 3d, 7d and 10d were duration of LTS. Error bars represented Mean ± SE (n = 3). Different letters in lowercase indicated significant difference of the data in all treatments at P < 0.05.
Fig 6
Fig 6. Effects of LTS on MDA.
(a)-(c) the variation trend of the tillering, booting and heading stages. CK, under natural conditions (control); T1, under LTS of 17.5°C; T2, under LTS of 13.5°C; T3, under LTS of 11.5°C. 3d, 7d and 10d were duration of LTS. Error bars represented Mean ± SE (n = 3). Different letters in lowercase indicated significant difference of the data in all treatments at P < 0.05.
Fig 7
Fig 7. Effects of LTS on EL.
(a)-(c) the variation trend of the tillering, booting and heading stages. CK, under natural conditions (control); T1, under LTS of 17.5°C; T2, under LTS of 13.5°C; T3, under LTS of 11.5°C. 3d, 7d and 10d were duration of LTS. Error bars represented Mean ± SE (n = 3). Different letters in lowercase indicated significant difference of the data in all treatments at P < 0.05.
Fig 8
Fig 8. Effects of LTS on the production rate of O2-.
(a)-(c) the variation trend of the tillering, booting and heading stages. CK, under natural conditions (control); T1, under LTS of 17.5°C; T2, under LTS of 13.5°C; T3, under LTS of 11.5°C. 3d, 7d and 10d were duration of LTS. Error bars represented Mean ± SE (n = 3). Different letters in lowercase indicated significant difference of the data in all treatments at P < 0.05.
Fig 9
Fig 9. Effects of LTS on H2O2.
(a)-(c) the variation trend of the tillering, booting and heading stages. CK, under natural conditions (control); T1, under LTS of 17.5°C; T2, under LTS of 13.5°C; T3, under LTS of 11.5°C. 3d, 7d and 10d were duration of LTS. Error bars represented Mean ± SE (n = 3). Different letters in lowercase indicated significant difference of the data in all treatments at P < 0.05.
Fig 10
Fig 10. Effects of LTS on SOD.
(a)-(c) the variation trend of the tillering, booting and heading stages. CK, under natural conditions (control); T1, under LTS of 17.5°C; T2, under LTS of 13.5°C; T3, under LTS of 11.5°C. 3d, 7d and 10d were duration of LTS. Error bars represented Mean ± SE (n = 3). Different letters in lowercase indicated significant difference of the data in all treatments at P < 0.05.
Fig 11
Fig 11. Effects of LTS on POD.
(a)-(c) the variation trend of the tillering, booting and heading stages. CK, under natural conditions (control); T1, under LTS of 17.5°C; T2, under LTS of 13.5°C; T3, under LTS of 11.5°C. 3d, 7d and 10d were duration of LTS. Error bars represented Mean ± SE (n = 3). Different letters in lowercase indicated significant difference of the data in all treatments at P < 0.05.
Fig 12
Fig 12. Effects of LTS on CAT.
(a)-(c) the variation trend of the tillering, booting and heading stages. CK, under natural conditions (control); T1, under LTS of 17.5°C; T2, under LTS of 13.5°C; T3, under LTS of 11.5°C. 3d, 7d and 10d were duration of LTS. Error bars represented Mean ± SE (n = 3). Different letters in lowercase indicated significant difference of the data in all treatments at P < 0.05.
Fig 13
Fig 13. Effects of LTS on proline.
(a)-(c) the variation trend of the tillering, booting and heading stages. CK, under natural conditions (control); T1, under LTS of 17.5°C; T2, under LTS of 13.5°C; T3, under LTS of 11.5°C. 3d, 7d and 10d were duration of LTS. Error bars represented Mean ± SE (n = 3). Different letters in lowercase indicated significant difference of the data in all treatments at P < 0.05.
Fig 14
Fig 14. Effects of LTS on the soluble sugar.
(a)-(c) the variation trend of the tillering, booting and heading stages. CK, under natural conditions (control); T1, under LTS of 17.5°C; T2, under LTS of 13.5°C; T3, under LTS of 11.5°C. 3d, 7d and 10d were duration of LTS. Error bars represented Mean ± SE (n = 3). Different letters in lowercase indicated significant difference of the data in all treatments at P < 0.05.
Fig 15
Fig 15. Effects of LTS on the soluble protein.
(a)-(c) the variation trend of the tillering, booting and heading stages. CK, under natural conditions (control); T1, under LTS of 17.5°C; T2, under LTS of 13.5°C; T3, under LTS of 11.5°C. 3d, 7d and 10d were duration of LTS. Error bars represented Mean ± SE (n = 3). Different letters in lowercase indicated significant difference of the data in all treatments at P < 0.05.
Fig 16
Fig 16. Effects of LTS on pollen viability.
(a)-(c) the variation trend of the tillering, booting and heading stages. CK, under natural conditions (control); T1, under LTS of 17.5°C; T2, under LTS of 13.5°C; T3, under LTS of 11.5°C. 3d, 7d and 10d were duration of LTS. Error bars represented Mean ± SE (n = 3). Different letters in lowercase indicated significant difference of the data in all treatments at P < 0.05.
Fig 17
Fig 17. The Pearson correlation matrix between Pn, MDA as well as yield and yield related parameters under LTS at tillering (T), booting (B), and heading (H) stages.
*, ** and *** represent the significant correlation at p < 0.05, p < 0.01 and p < 0.001, respectively.
Fig 18
Fig 18. The effect of LTS on chloroplast ultrastructure of rice at booting stage.
Chloroplast structure and thylakoid organization in control and LTS were analyzed by transmission electron microscopy (TEM). CK, under the natural conditions (control) for duration of 3, 7 and 10 days (A, B and C); T1, LTS of mean temperature 17.5°C for duration of 3, 7 and 10 days (D, E and F); T3, LTS of mean temperature 11.5°C for duration of 3, 7 and 10 days (G, H and I). G: granum; SL: stroma lamellae; GL: grana lamellae; SG: starch grain; OG: osmophilic gramules; CHM: chloroplast membrane. Bar = 500 nm.
Fig 19
Fig 19. The Pearson correlation matrix between pollen viability as well as yield and yield related parameters under LTS.
*, ** and *** represent the significant correlation at p < 0.05, p < 0.01 and p < 0.001, respectively.

Similar articles

References

    1. Ito VC, Lacerda LG. Black rice (Oryza sativa L.): a review of its historical aspects, chemical composition, nutritional and functional properties, and applications and processing technologies. Food Chem. 2019;301:125304. doi: 10.1016/j.foodchem.2019.125304 - DOI - PubMed
    1. Yuan S, Linquist BA, Wilson LT, Cassman KG, Stuart AM, Pede V, et al. Sustainable intensification for a larger global rice bowl. Nat Commun. 2021;12(1):7163. doi: 10.1038/s41467-021-27424-z - DOI - PMC - PubMed
    1. Hsiaoping C, Toriyama K, Heong KL, Hardy B. Rice consumption in China: can China change rice consumption from quantity to quality?, In Rice Is life: scientific perspectives for the century world rice, 2005.
    1. Yan W, Huang K. Determinants of agricultural protection in China and the rest of the world. Asian-Pacific Econ Lit. 2018;32:64–75.
    1. Almeida DM, Almadanim MC, Lourenço T, Abreu IA, Saibo NJM, Oliveira MM. Screening for abiotic stress tolerance in rice: salt, cold, and drought. Methods Mol Biol. 2016;1398:155–82. doi: 10.1007/978-1-4939-3356-3_14 - DOI - PubMed

LinkOut - more resources