. 2025 Aug 13;23(8):e3003338.
doi: 10.1371/journal.pbio.3003338. eCollection 2025 Aug.

Mitochondrial ROS and HIF-1α signaling mediate synaptic plasticity in the critical period

Affiliations

Mitochondrial ROS and HIF-1α signaling mediate synaptic plasticity in the critical period

Daniel Sobrido-Cameán et al. PLoS Biol. .

Abstract

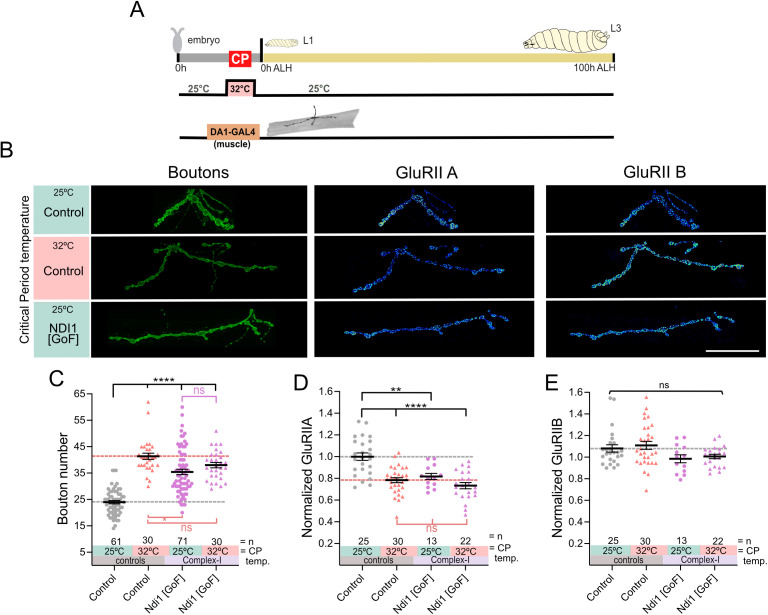
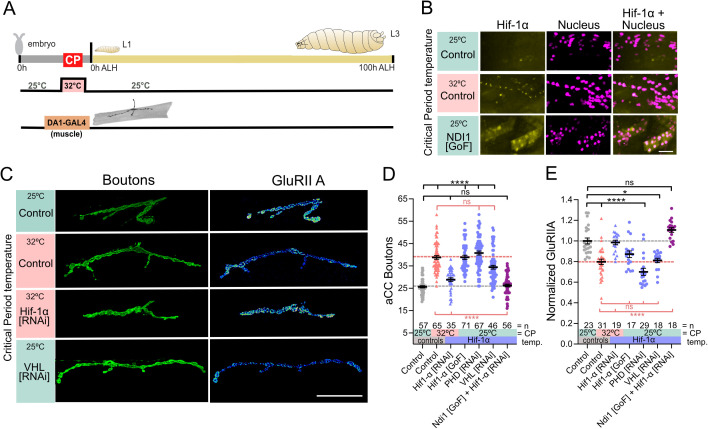
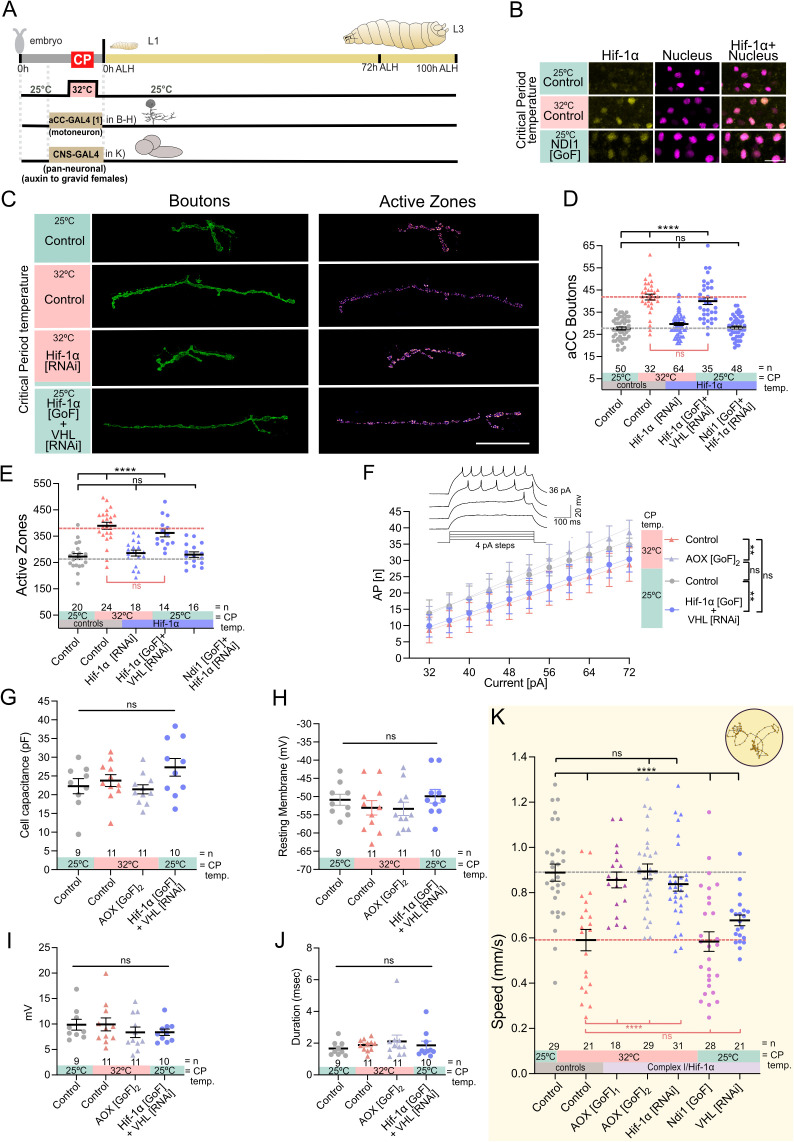
As developing networks transition from spontaneous irregular to patterned activity, they undergo plastic tuning phases, termed "critical periods"; "critical" because disturbances during these phases can lead to lasting changes in network development and output. Critical periods are common to developing nervous systems, with analogous features shared from insects to mammals, yet the core signaling mechanisms that underlie cellular critical period plasticity have remained elusive. To identify these, we exploited the Drosophila larval locomotor network as an advantageous model system. It has a defined critical period and offers unparalleled access to identified network elements, including the neuromuscular junction as a model synapse. We find that manipulations of a single motoneuron or muscle cell during the critical period lead to predictable, and permanent, cell-specific changes. This demonstrates that critical period adjustments occur at a single-cell level. Mechanistically, we identified mitochondrial reactive oxygen species (ROS) as causative. Specifically, we show that ROS produced by Complex-I of the mitochondrial electron transport chain, generated by the reverse flow of electrons, is necessary and instructive for critical period-regulated plasticity. Downstream of ROS, we identified the Drosophila homologue of hypoxia-inducible factor (HIF-1α), as required for transducing the mitochondrial ROS signal to the nucleus. This signaling axis is also sufficient to cell autonomously specify changes in neuronal properties and animal behavior but, again, only when activated during the embryonic critical period. Thus, we have identified specific mitochondrial ROS and HIF-1α as primary signals that mediate critical period plasticity.


Conflict of interest statement

The authors have declared that no competing interests exist.

Figures

Fig 1
Fig 1. Mitochondrial ROS generated by reverse electron transport in muscles is necessary for critical period heat stress to change NMJ development.
(A) Experimental paradigm. (B) 32°C during the critical period increases mitochondrial ROS production in muscles. Dot plots of mitochondrion-targeted ratiometric mito::roGFP2::Tsa2ΔCPΔCR ROS sensor in late stages at 25°C control temperature and 32°C. (C) Heat stress experienced during the embryonic critical period (32°C vs. 25°C control) leads to increased aCC NMJ terminal size and decreased postsynaptic GluRIIA, while not affecting subunit GluRIIB expression. Simultaneous genetic manipulation of muscle DA1 during embryonic stages only identifies mitochondrial ROS generated by reverse electron transport as necessary signals. “Control” indicates control genotype heterozygous for Oregon-R and DA1-GAL4. Larvae were reared at the control temperature of 25°C until the late wandering stage, 100 h after larval hatching (ALH). GluRIIA and GluRIIB subunits are displayed with lookup table “fire” to illustrate signal intensities (warmer colors indicating greater signal intensities). Scale bar = 20 µm. (D) Dot-plot quantification shows changes to aCC NMJ growth on its target muscle DA1, based on the standard measure of the number of boutons (swellings containing multiple presynaptic release sites/active zones). Data are shown with mean ± SEM, ANOVA, ***p < 0.0001, ****p < 0.00001, ‘ns’ indicates statistical non-significance. Black asterisks indicate comparison with the control condition of 25°C throughout, genetically unmanipulated. Red asterisks indicate comparisons with control genotype exposed to 32°C heat stress during the embryonic critical period. (E) Dot-plot quantification shows changes in levels of the GluRIIA receptor subunit at aCC NMJs quantified in (C). Data are shown with mean ± SEM, ANOVA, ****p < 0.00001, ‘ns’ indicates statistical non-significance. Black asterisks indicate comparison with the control condition of 25°C throughout, genetically unmanipulated. Red asterisks indicate comparisons with control genotype exposed to 32°C heat stress during the embryonic critical period. (F) Dot-plot quantification as in (D), but for the low conductance GluRIIB receptor subunit, which remains unaffected by these manipulations. See raw data in S1 Data.
Fig 2
Fig 2. ROS by Complex-I, during the critical period, is sufficient to induce lasting changes to NMJ development.
(A) Experimental paradigm. (B) Induction of ROS at Complex-I via transient mis-expression of NDI1 in muscle DA1 during embryonic stages only phenocopies the effects that critical period heat stress has on subsequent NMJ development. “Control” indicates control genotype heterozygous for Oregon-R and DA1-GAL4. Larvae were reared at the control temperature of 25°C until the late wandering stage, 100 h ALH. GluRIIA and GluRIIB subunits are displayed with lookup table “fire” to illustrate signal intensities (warmer colors indicating greater signal intensities). Scale bar = 20 µm. (C) Dot-plot quantification shows changes to aCC NMJ growth on its target muscle DA1, based on the standard measure of the number of boutons (swellings containing multiple presynaptic release sites/active zones). Data are shown with mean ± SEM, ANOVA, ***p < 0.0001, ****p < 0.00001. Black asterisks indicate comparison with the control condition of 25°C throughout, genetically unmanipulated. Red asterisks indicate comparisons with control genotype exposed to 32°C heat stress during the embryonic critical period. (D) Dot-plot quantification shows changes in levels of the GluRIIA receptor subunit at aCC NMJs quantified in C). Data are shown with mean ± SEM, ANOVA, **p < 0.001, ***p < 0.0001, ‘ns’ indicates statistical non-significance. Black asterisks indicate comparison with the control condition of 25°C throughout, genetically unmanipulated. Red asterisks indicate comparisons with control genotype exposed to 32°C heat stress during the embryonic critical period. (E) Dot-plot quantification as in (D), but for the low conductance GluRIIB receptor subunit, which remains unaffected by these manipulations. See raw data in S2 Data.
Fig 3
Fig 3. ROS by RET in embryonic motoneurons instructs subsequent NMJ development.
(A) Experimental paradigm. (B) 32°C during the critical period increases mitochondrial ROS production in aCC motoneurons. Images generated by dividing the region of interest of 405 nm image by the same region obtained by 488 nm. Dot plots of mitochondrion-targeted ratiometric mito::roGFP2::Tsa2ΔCPΔCR ROS sensor in late stages at 25°C control temperature and 32°C. Scale bar = 10 µm. (C) Temperature experienced during the embryonic critical period (25°C control vs. 32°C heat stress) and simultaneous, transient genetic manipulation of motoneuron aCC during embryonic stages only via aCC-GAL4[1] (akaRN2-O-GAL4). “Control” indicates control genotype heterozygous for Oregon-R and aCC-GAL4[1]. Larvae were reared at the control temperature of 25°C until the late wandering stage, 100 h ALH. Scale bar = 20 µm. (D) Dot-plot quantification shows changes to aCC NMJ growth on its target muscle DA1, based on the standard measure of the number of boutons (swellings containing multiple presynaptic release sites/active zones). Data are shown with mean ± SEM, ANOVA, ****p < 0.00001, ‘ns’ indicates statistical non-significance. Black asterisks indicate comparison with the control condition of 25°C throughout, genetically unmanipulated. Red asterisks indicate comparisons with control genotype exposed to 32°C heat stress during the embryonic critical period. (E) Dot-plot quantification shows changes in the number of active zones at aCC NMJs quantified in (C). Data are shown with mean ± SEM, ANOVA, ****p < 0.00001, ‘ns’ indicates statistical non-significance. Black asterisks indicate comparison with the control condition of 25°C throughout, genetically unmanipulated. Red asterisks indicate comparisons with control genotype exposed to 32°C heat stress during the embryonic critical period. (F) Dot-plot quantification shows changes in NMJ area. Data are shown with mean ± SEM, ANOVA, ****p < 0.00001, ‘ns’ indicates statistical non-significance. Black asterisks indicate comparison with the control condition of 25°C throughout, genetically unmanipulated. Red asterisks indicate comparisons with control genotype exposed to 32°C heat stress during the embryonic critical period. (G) Dot-plot quantification shows no changes in active zones density (active zone/μm2). Data are shown with mean ± SEM, ‘ns’ indicates statistical non-significance. Comparison with the control condition of 25°C throughout, genetically unmanipulated. See raw data in S3 Data.
Fig 4
Fig 4. HIF-1α is the signal downstream of ROS-RET.
(A) Experimental paradigm. (B) HIF-1α is stabilized and translocated to nucleus in muscles following 32°C or increase ROS by mitochondrial Complex-I (Ndi1 mis-expression) during the critical period. Images show GFP tagged endogenous HIF-1α and a nuclear expression of a red fluorescent protein. Scale bar = 100 µm. (C) Temperature experienced during the embryonic critical period (25°C control vs. 32°C heat stress) and simultaneous genetic manipulation of muscle DA1 during embryonic stages only. “Control” indicates control genotype heterozygous for Oregon-R and DA1-GAL4. Larvae were reared at the control temperature of 25°C until the late wandering stage, 100 h ALH. GluRIIA subunit is displayed with a lookup table “fire” to illustrate signal intensities (warmer colors indicating greater signal intensities). Scale bar = 20 µm. (D) Dot-plot quantification shows changes to aCC NMJ growth on its target muscle DA1, based on the standard measure of the number of boutons (swellings containing multiple presynaptic release sites/active zones). Data are shown with mean ± SEM, ANOVA, ****p < 0.00001, ‘ns’ indicates statistical non-significance. Black asterisks indicate comparison with the control condition of 25°C throughout, genetically unmanipulated. Red asterisks indicate comparisons with control genotype exposed to 32°C heat stress during the embryonic critical period. (E) Dot-plot quantification shows changes in levels of the GluRIIA receptor subunit at aCC NMJs quantified in (D). Data are shown with mean ± SEM, ANOVA, *p < 0.01, ****p < 0.00001, ‘ns’ indicates statistical non-significance. Black asterisks indicate comparison with the control condition of 25°C throughout, genetically unmanipulated. Red asterisks indicate comparisons with control genotype exposed to 32°C heat stress during the embryonic critical period. See raw data in S4 Data.
Fig 5
Fig 5. ROS by RET and HIF-1α signaling during the embryonic critical period is necessary and sufficient to reduce motoneuron excitability and crawling behavior.
(A) Experimental paradigm. (B) HIF-1α is stabilized and translocated to nucleus in motoneurons following 32°C or increase ROS by mitochondrial Complex-I (Ndi1 mis-expression) during the critical period. Images show GFP tagged endogenous HIF-1α and a nuclear expression of a red fluorescent protein. Scale bar = 10 µm. (C) Temperature experienced during the embryonic critical period (25°C control vs. 32°C heat stress) and simultaneous genetic manipulation of motoneuron aCC during embryonic stages only. “Control” indicates control genotype heterozygous for Oregon-R and aCC-GAL4[1]. Larvae were reared at the control temperature of 25°C until the late wandering stage, 100 h ALH. Scale bar = 20 µm. (D) Dot-plot quantification shows changes to aCC NMJ growth on its target muscle DA1, based on the standard measure of the number of boutons (swellings containing multiple presynaptic release sites/active zones). Data are shown with mean ± SEM, ANOVA, ****p < 0.00001, ‘ns’ indicates statistical non-significance. Black asterisks indicate comparison with the control condition of 25°C throughout, genetically unmanipulated. Red asterisks indicate comparisons with control genotype exposed to 32°C heat stress during the embryonic critical period. (E) Dot-plot quantification shows changes in levels of the active zones in aCC motoneurons quantified in (D). Data are shown with mean ± SEM, ANOVA, *p < 0.01, ****p < 0.00001, ‘ns’ indicates statistical non-significance. Black asterisks indicate comparison with the control condition of 25°C throughout, genetically unmanipulated. Red asterisks indicate comparisons with control genotype exposed to 32°C heat stress during the embryonic critical period. (F) aCC motoneuron excitability at the late third instar larval stage (i.e., action potential firing frequency triggered by current injected). Temperature experienced during the embryonic critical period (25°C control vs. 32°C heat stress) and simultaneous transient genetic manipulation of aCC motoneuron during embryonic stages, via aCC-GAL4[1] (RN2-O-GAL4). “Control” indicates control genotype heterozygous for Oregon-R and aCC-GAL4[1]. Larvae were reared at the control temperature of 25°C until the late wandering stage, c. 100 h ALH. Control at 25°C vs. 32°C is significant at p = 0.0005; Control at 25°C vs. HIF-1α[GoF] is significant at p = 0.0015; Control at 25°C vs. AOX[GoF]2 at 32°C is not significant at p = 0.28. (G) Cell capacitance measurements as indicators of cell size show no significant differences between aCC motoneurons from specimens in (F). (H) Resting membrane potential, as an indicator for cell integrity, shows no significant differences between aCC motoneurons from specimens in (F). (I) Quantification of the first action potential amplitude (in mV) recorded from aCC motoneurons from specimens in (F). (J) Duration of first action potential fired (measured at 50% relative amplitude) shows no significant differences between aCC motoneurons from specimens in (F). (K) Crawling speed of third instar larvae (72 h ALH). Temperature experienced during the embryonic critical period (25°C control vs. 32°C heat stress) and simultaneous genetic manipulation of CNS neurons during embryonic stages only. “Control” indicates control genotype heterozygous for Oregon-R and CNS-GAL4; Auxin-GAL80. Larvae were reared at the control temperature of 25°C. All animals, including “Control” are from gravid females fed with auxin. Each data point represents the crawling speed from an individual uninterrupted continuous forward crawl, n = specimen replicate number, up to three crawls assayed for each larva. Mean ± SEM, ANOVA, ns = not significant, ****p < 0.00001. See raw data in S5 Data.
Fig 6
Fig 6. Working model.
(A) Heat stress during the critical period induces mitochondrial ROS, which leads to HIF-1α stabilization and its accumulation in the nucleus, where HIF-1α generates long-lasting changes that impact on (B) NMJ development: larger presynaptic terminals and less GluRIIA, as well as reductions in motoneuron excitability and, behaviorally, crawling speed. Figure A created using BioRender (https://www.biorender.com/).

Similar articles

References

    1. Hensch TK. Critical period regulation. Annu Rev Neurosci. 2004;27:549–79. doi: 10.1146/annurev.neuro.27.070203.144327 - DOI - PubMed
    1. Hensch TK. Critical period plasticity in local cortical circuits. Nat Rev Neurosci. 2005;6(11):877–88. doi: 10.1038/nrn1787 - DOI - PubMed
    1. Hensch TK, Quinlan EM. Critical periods in amblyopia. Vis Neurosci. 2018;35:E014. doi: 10.1017/S0952523817000219 - DOI - PubMed
    1. Do KQ, Cuenod M, Hensch TK. Targeting oxidative stress and aberrant critical period plasticity in the developmental trajectory to schizophrenia. Schizophr Bull. 2015;41(4):835–46. doi: 10.1093/schbul/sbv065 - DOI - PMC - PubMed
    1. Steullet P, Cabungcal J-H, Coyle J, Didriksen M, Gill K, Grace AA, et al. Oxidative stress-driven parvalbumin interneuron impairment as a common mechanism in models of schizophrenia. Mol Psychiatry. 2017;22(7):936–43. doi: 10.1038/mp.2017.47 - DOI - PMC - PubMed

MeSH terms

Substances

LinkOut - more resources