. 2025 Aug 12:119:105884.
doi: 10.1016/j.ebiom.2025.105884. Online ahead of print.

Tumour extracellular vesicle surface Protein-mRNA integration assay for early detection of epithelial ovarian cancer

Affiliations

Tumour extracellular vesicle surface Protein-mRNA integration assay for early detection of epithelial ovarian cancer

Ying-Tzu Yen et al. EBioMedicine. .

Abstract

Background: Early detection of epithelial ovarian cancer (EOC) is crucial for improving clinical outcomes. However, the sensitivity of primary serological marker cancer antigen 125 (CA125) is suboptimal for detecting early-stage EOC. Tumour-derived extracellular vesicles (EVs) are promising biomarkers for early cancer detection.

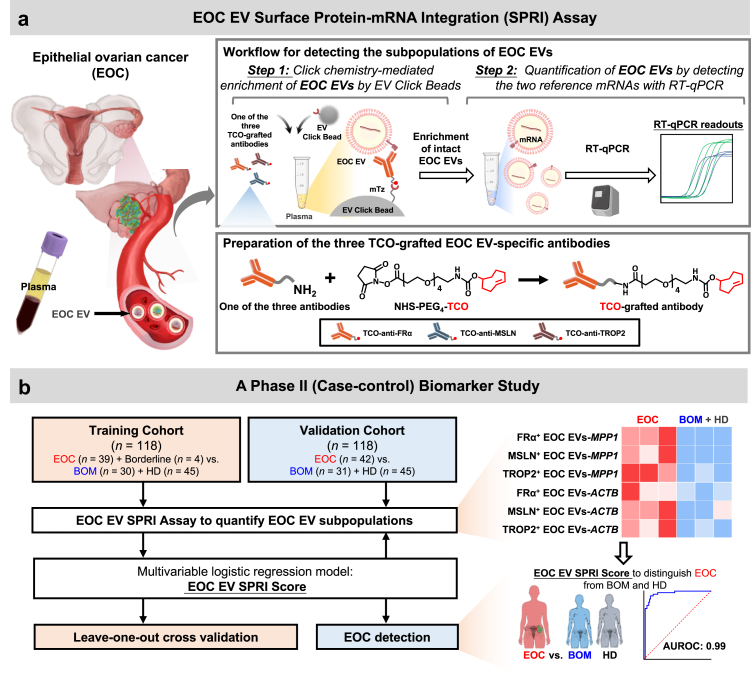
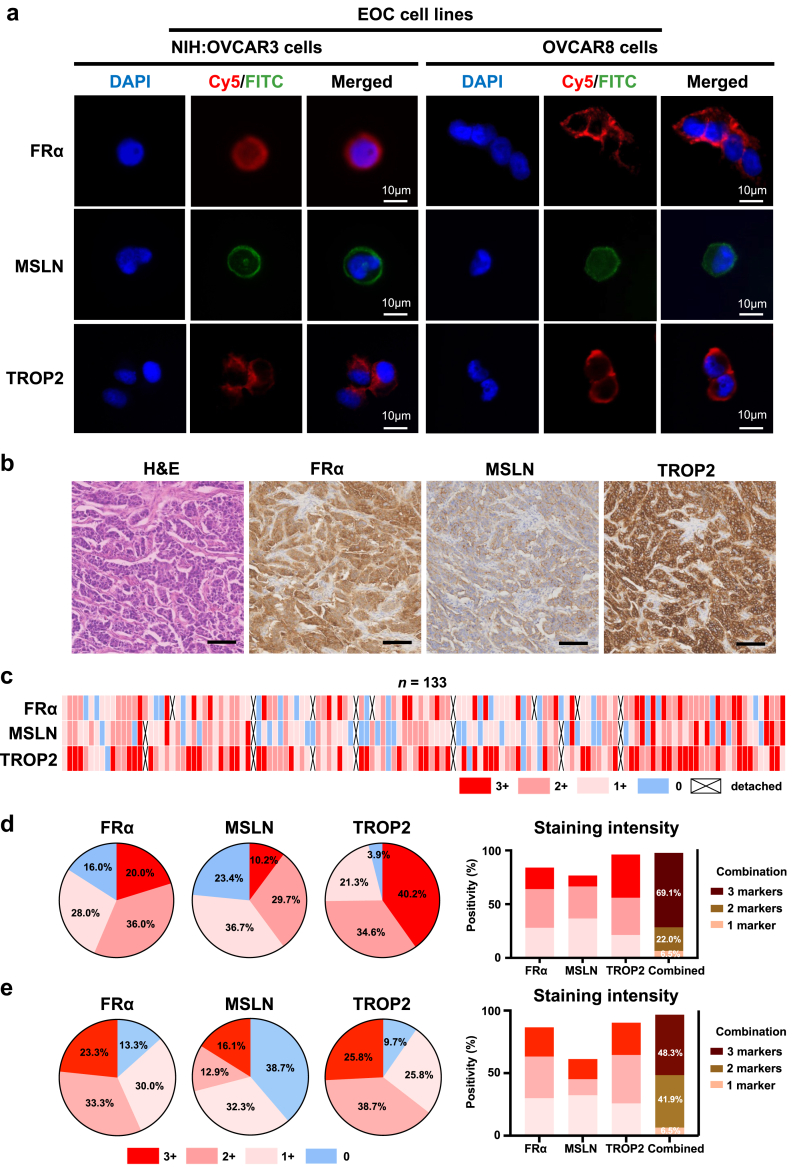
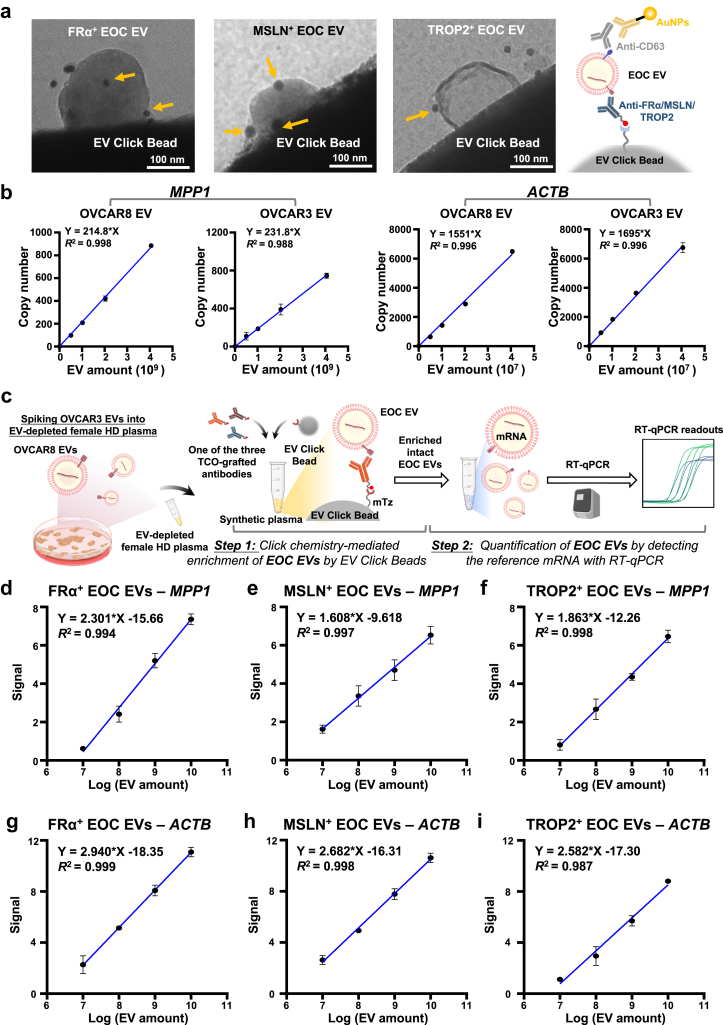
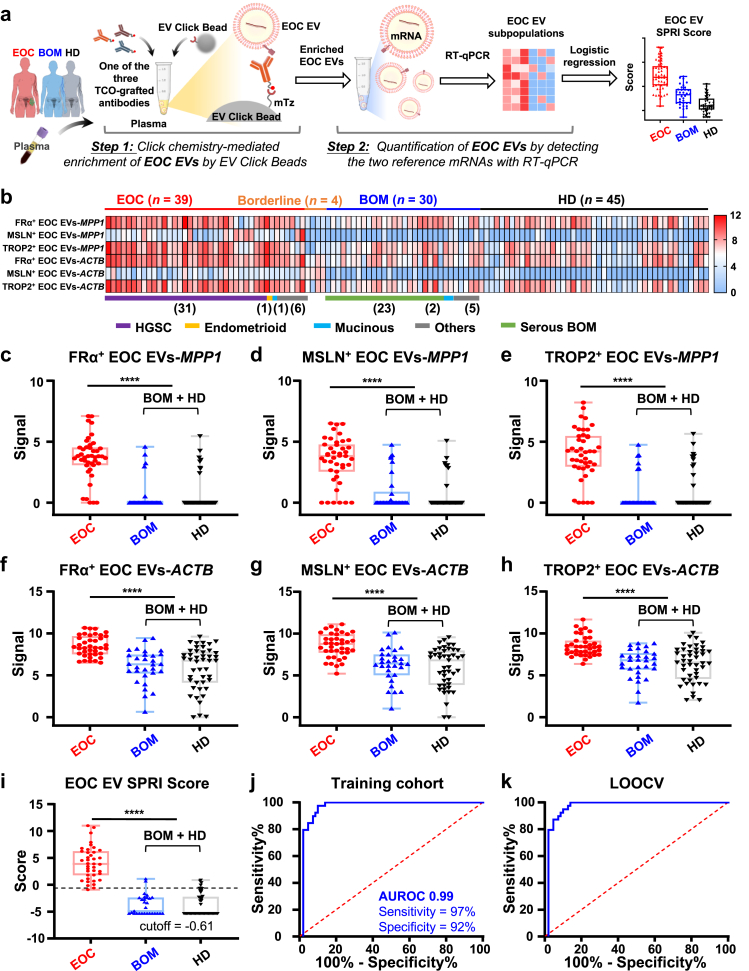
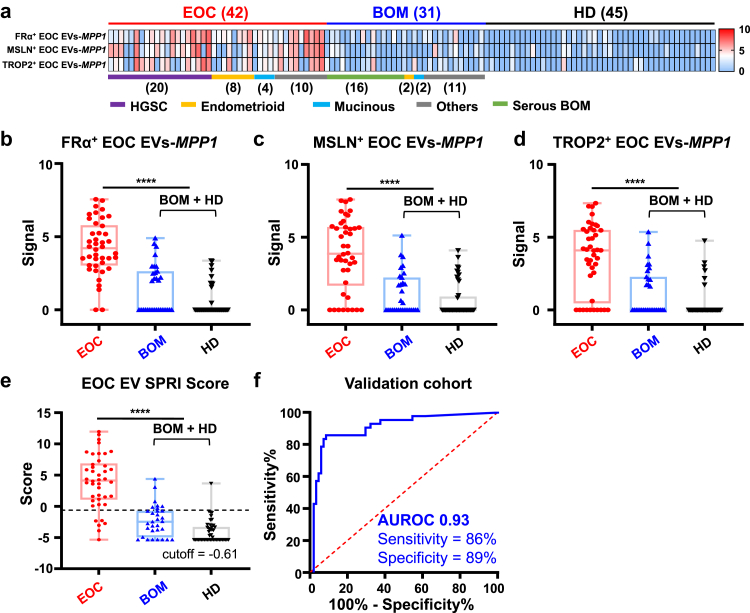
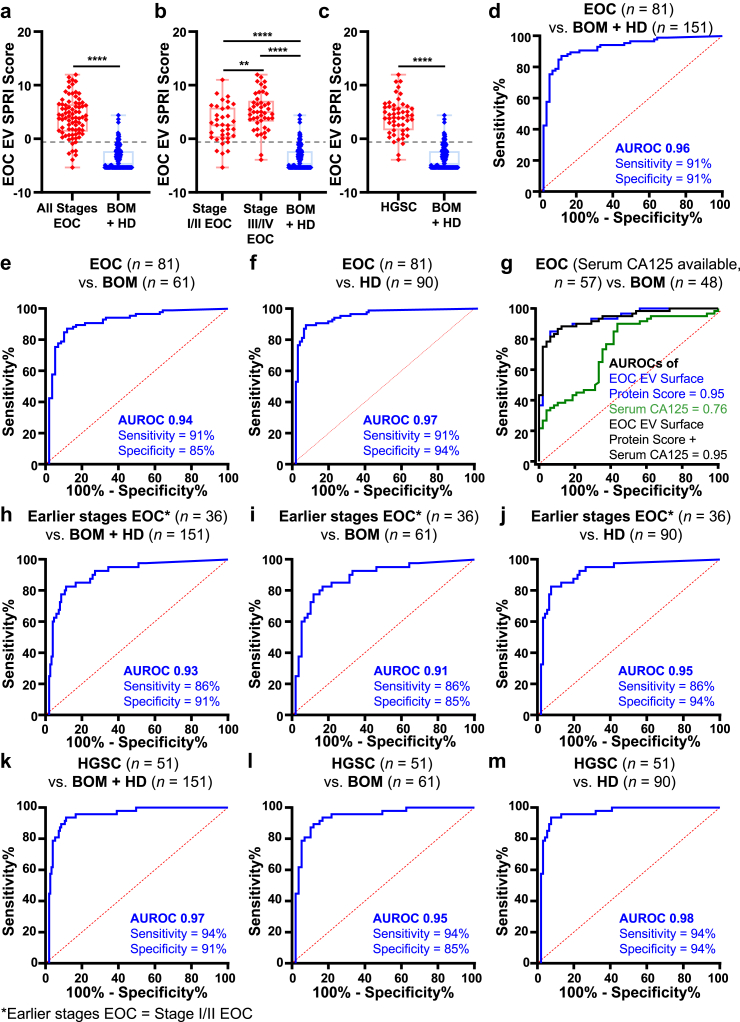
Methods: We developed an EOC EV Surface Protein-mRNA Integration (SPRI) Assay for early detection of EOC. This assay quantifies reference mRNAs within subpopulations of EOC EVs enriched by EV Click Beads targeting three EOC EV surface protein markers. Three EOC EV surface protein markers (i.e., FRα, MSLN, and TROP2) were selected through a bioinformatic framework using multi-omics data and underwent rigorous validation using EOC cell lines and EOC tissue microarrays. We then explored the translational potential of the EOC EV SPRI Assay through a phase II case-control study. The EOC EV SPRI Score was established using a logistic regression model in a training cohort (n = 118) and then validated in an independent validation cohort (n = 118).

Findings: EOC EV SPRI Score demonstrated superior performance for distinguishing EOC from benign ovarian masses and healthy donors with an area under the receiver operating characteristic (AUROC) of 0.99 (95% CI: 0.97-1.00) in the training cohort and 0.93 (95% CI: 0.88-0.97) in the validation cohort. It outperformed matched serum CA125, and the performance remained excellent in earlier stages of EOC (Stage I/II, AUROC = 0.93, 95% CI: 0.88-0.98) and the subgroup of high-grade serous carcinoma (AUROC = 0.97, 95% CI: 0.87-0.97).

Interpretation: The EOC EV SPRI assay demonstrated significant potential for early detection of EOC and improving long-term patient outcomes.

Funding: This work is supported by National Institutes of Health (R01CA277530, R01CA255727, R01CA253651, R01CA253651-04S1, R21CA280444, R01CA246304, U01EB026421, R44CA288163, U01CA271887, and U01CA230705), DOD (HT9425-23-1-0361) and OCRA (CRDG-2023-3-1000) for the U.S.

Study: Additionally, we acknowledge the support of the Science and Technology Foundation of Suzhou (SZS2023006, SSD2023004) and the Youth Innovation Promotion Association CAS (2023335) for the work conducted at SINANO.

Keywords: Biomarker; Epithelial ovarian cancer; Extracellular vesicle; Liquid biopsy.


Conflict of interest statement

Declaration of interests HRT is a co-founder and shareholder in Cytolumina Technologies Corp, Pulsar Therapeutics, and Eximius Diagnostics Corp. Y Zhu is a co-founder and shareholder in Eximius Diagnostics Corp.

Figures

Fig. 1
Fig. 1
Schematic illustration of the Epithelial Ovarian Cancer (EOC) Extracellular Vesicle (EV) Surface Protein-mRNA Integration (SPRI) Assay for early detection of EOC. (a) The EOC EV Surface Protein-mRNA Integration (SPRI) Assay was carried out via a two-step workflow––Step 1: Click chemistry-mediated enrichment of EOC EVs by EV Click Beads, and Step 2: Quantification of enriched EOC EVs by detecting the two reference mRNAs through reverse transcription-quantitative polymerase chain reaction (RT-qPCR). Three trans-cyclooctene (TCO)-grafted EOC-specific antibodies, i.e., TCO-anti-folate receptor alpha (FRα), TCO-anti-mesothelin (MSLN), and TCO-anti-trophoblast cell-surface antigen 2 (TROP2) were prepared to enable click chemistry-mediated enrichment of EOC EV subpopulations. Each EOC EV subpopulation was then subjected to RT-qPCR quantification of the two reference mRNAs, i.e., MPP1 and ACTB. The signals from MPP1 and ACTB reflect the amount of EOC EVs. (b) Clinical study design flowchart. First, plasma samples from eligible participants were collected from a training cohort comprising 39 patients with EOC, 4 with borderline ovarian tumour, 30 with benign ovarian masses (BOM), and 45 healthy donors (HD). All samples were subjected to EOC EV SPRI Assay to quantify the six subpopulations of EOC EVs (i.e., FRα+ EOC EVs-MPP1, MSLN+ EOC EVs-MPP1, TROP2+ EOC EVs-MPP1, FRα+ EOC EVs-ACTB, MSLN+ EOC EVs-ACTB, and TROP2+ EOC EVs-ACTB). Subsequently, the EOC EV SPRI Score was generated by logistic regression analysis and cross-validated by leave-one-out cross validation. Finally, the diagnostic performance of EOC EV SPRI Score was validated in an independent validation cohort comprising 42 EOC, 31 BOM, and 45 HD.
Fig. 2
Fig. 2
Validation of the three EOC EV surface protein markers using EOC cell lines and EOC tissue microarray (TMA). (a) Representative IF micrographs illustrating expression of FRα, MSLN, and TROP2 in OVCAR3 and OVCAR8 EOC cell lines. Blue: DAPI; red: Cy5; green: FITC. Scale bar, 10 μm. (b) Representative haematoxylin and eosin (H&E) and immunohistochemistry (IHC) images displaying expression of the three EOC EV surface protein markers on EOC TMA slides. Scale bar, 200 μm. (c) Heatmap summarising IHC staining intensity and positive percentages for each marker across EOC TMA. Pie charts depicting the percentage of (d) all-stage EOC samples and (e) earlier-stage EOC samples (stage I-II) categorised by IHC staining intensity of strong (3+), moderate (2+), weak (1+), and negative (0) for the three EOC EV surface protein. Bar charts summarising the percentage of IHC positive staining for each surface protein marker and their combinations in (d) all-stage EOC samples and (e) earlier-stage EOC samples.
Fig. 3
Fig. 3
Characterisation of EOC cell line-derived EVs and linearity study of EOC EV SPRI Assay using synthetic plasma samples. (a) Representative transmission electron microscopy (TEM) images of click chemistry mediated immobilisation of TCO-anti-FRα, TCO-anti-MSLN, and TCO-anti-TROP2 labelled OVCAR3 EVs, visualised by immunogold staining with anti-CD63-grafted gold nanoparticles (gold arrows). Scale bar, 100 nm. (b) Linearity study showing correlation between EV concentration and reference mRNA (i.e., MPP1 and ACTB) expression in OVCAR8 and OVCAR3 EVs. Two replicates were examined for each group. Data are presented as mean ± SD. R2 was calculated using simple linear regression. (c) Workflow for linearity study of the EOC EV SPRI Assay using synthetic plasma samples spiked with OVCAR3 EVs. The EVs were enriched using EV Click Beads in conjunction with each of the three TCO-grafted antibodies, i.e., TCO-anti-FRα, TCO-anti-MSLN, or TCO-anti-TROP2. RT-qPCR detection of the ACTB mRNA served as a surrogate for enriched OVCAR3 EV concentrations (d–i) Dynamic linearity ranges of ACTB signal for the EOC EV subpopulations enriched by TCO-grafted EOC EV-specific antibodies. Two replicates were examined for each group. Data are presented as mean ± SD. R2 was calculated using simple linear regression.
Fig. 4
Fig. 4
EOC EV SPRI Score for detecting EOC in the training cohort. (a) Workflow for the EOC EV SPRI Assay applied to plasma samples from the training cohort, which included 39 patients with EOC, 4 with borderline ovarian tumours, 30 with benign ovarian masses (BOM), and 45 healthy donors (HD). (b) Heatmaps summarising six subpopulations of EOC EVs (i.e., FRα+ EOC EVs-MPP1, MSLN+ EOC EVs-MPP1, TROP2+ EOC EVs-MPP1, FRα+ EOC EVs-ACTB, MSLN+ EOC EVs-ACTB, and TROP2+ EOC EVs-ACTB) in the training cohort. (ch) Significantly higher signals in patients with EOC compared to the combined BOM and HD control group in the training cohort were observed in the subpopulations of FRα+ EOC EVs-MPP1, MSLN+ EOC EVs-MPP1, TROP2+ EOC EVs-MPP1, FRα+ EOC EVs-ACTB, MSLN+ EOC EVs-ACTB, and TROP2+ EOC EVs-ACTB. Data are presented as mean ± SD. ∗∗∗∗p < 0.0001 (unpaired Student's t-tests). (i) The EOC EV SPRI Score was generated using a stepwise logistic regression. Significantly higher EOC EV SPRI Scores were observed in patients with EOC compared to the combined BOM and HD controls in the training cohort, with an optimal cutoff of −0.61. Data are presented as mean ± SD. ∗∗∗∗p < 0.0001 (unpaired Student's t-test). (j) Receiver operating characteristic (ROC) curve illustrating the diagnostic performance of EOC EV SPRI Score in distinguishing EOC from the combined BOM and HD control group in the training cohort. (k) ROC curve showing the performance of EOC EV SPRI Score after leave-one-out cross-validation (LOOCV).
Fig. 5
Fig. 5
EOC EV SPRI Score for distinguishing EOC from BOM and HD controls in the validation cohort. (a) Heatmaps summarising MPP1 mRNA signals across FRα+ EOC EVs, MSLN+ EOC EVs, and TROP2+ EOC EVs. (b–d) Significantly higher MPP1 mRNA signals in the subpopulations of EOC EVs were observed in patients with EOC compared to the combined BOM and HD control group. The signal is represented as 40—Ct value. Data are presented as mean ± SD. ∗∗∗∗p < 0.0001 (unpaired Student's t-tests). (e) Boxplot illustrating EOC EV SPRI Scores in EOC versus BOM and HD controls at a cutoff of −0.61. Data are presented as mean ± SD. ∗∗∗∗p < 0.0001 (unpaired Student's t-test). (f) ROC curve showing the diagnostic performance of the EOC EV SPRI Score in distinguishing EOC from BOM and HD.
Fig. 6
Fig. 6
Subgroup analyses of the EOC EV SPRI Score for detecting EOC across all participants. (a–c) Boxplots summarising the distribution of the EOC EV SPRI Scores across different subgroups. Data are presented as mean ± SD. ∗∗p < 0.01 (unpaired Student's t-tests), ∗∗∗∗p < 0.0001 (unpaired Student's t-tests). (df) ROC curves for distinguishing patients with EOC (n = 81) from the combined BOM and HD control group (n = 151), EOC (n = 81) from BOM (n = 61), and EOC (n = 81) from HD (n = 90). (g) Comparison and combination of the diagnostic performance of the EOC EV SPRI Score and serum CA125 in distinguishing EOC (n = 57) from BOM (n = 48) among participants with available CA125 data, with the EOC EV SPRI Score significantly outperforming CA-125. p < 0.001 (DeLong's test). (hm) ROC curves for distinguishing earlier stages EOC (Stage I/II EOC, n = 36) from BOM and HD controls (n = 151), earlier stages EOC (n = 36) from BOM (n = 61), earlier stages EOC (n = 36) from HD controls (n = 90), high-grade serous carcinoma (HGSC, n = 51) from BOM and HD controls (n = 151), patients with HGSC (n = 51) from BOM (n = 61), and patients with HGSC (n = 51) from HD controls (n = 90).

Similar articles

References

    1. Siegel R.L., Miller K.D., Wagle N.S., Jemal A. Cancer statistics, 2023. CA Cancer J Clin. 2023;73(1):17–48. - PubMed
    1. Sung H., Ferlay J., Siegel R.L., et al. Global cancer statistics 2020: GLOBOCAN estimates of incidence and mortality worldwide for 36 cancers in 185 countries. CA Cancer J Clin. 2021;71(3):209–249. - PubMed
    1. Lheureux S., Gourley C., Vergote I., Oza A.M. Epithelial ovarian cancer. Lancet. 2019;393(10177):1240–1253. - PubMed
    1. Lheureux S., Braunstein M., Oza A.M. Epithelial ovarian cancer: evolution of management in the era of precision medicine. CA Cancer J Clin. 2019;69(4):280–304. - PubMed
    1. Kuroki L., Guntupalli S.R. Treatment of epithelial ovarian cancer. BMJ. 2020;371 - PubMed