. 2025 Aug 21;85(16):3057-3073.e10.
doi: 10.1016/j.molcel.2025.07.014. Epub 2025 Aug 12.

Distinct specificity and functions of PRC2 subcomplexes in human stem cells and cardiac differentiation

Affiliations

Distinct specificity and functions of PRC2 subcomplexes in human stem cells and cardiac differentiation

Christian Much et al. Mol Cell. .

Abstract

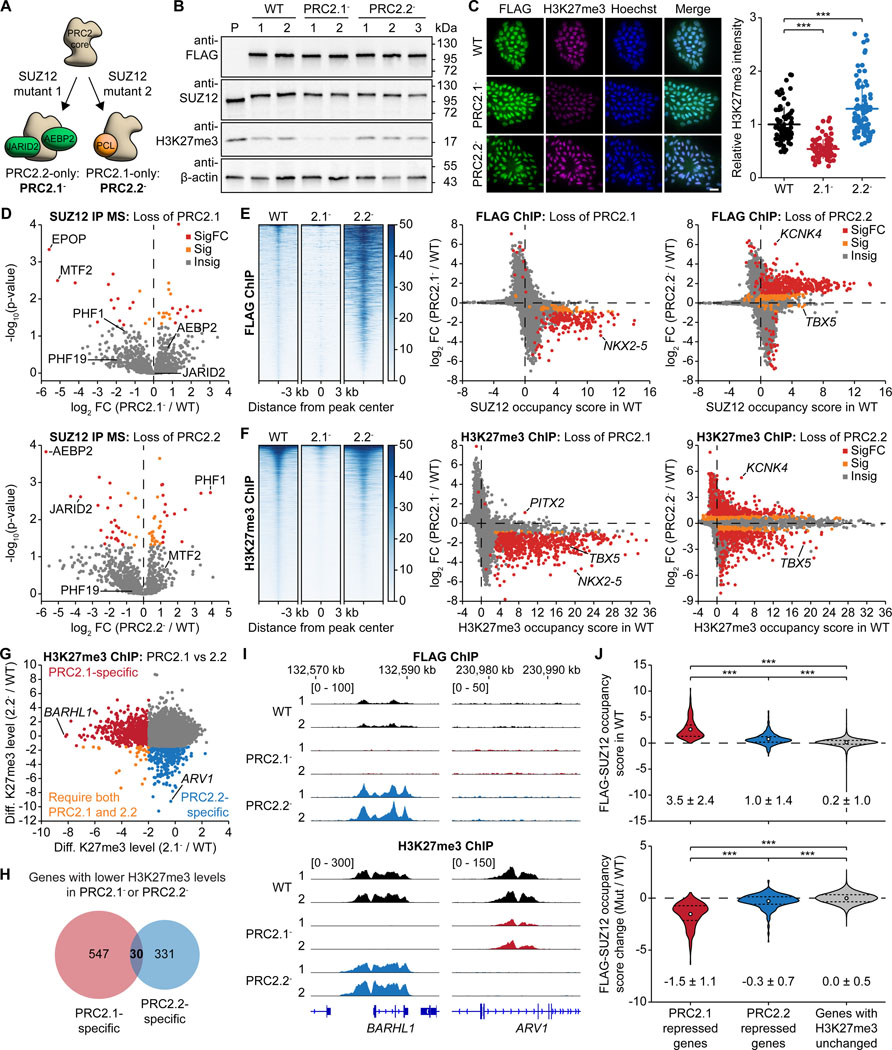
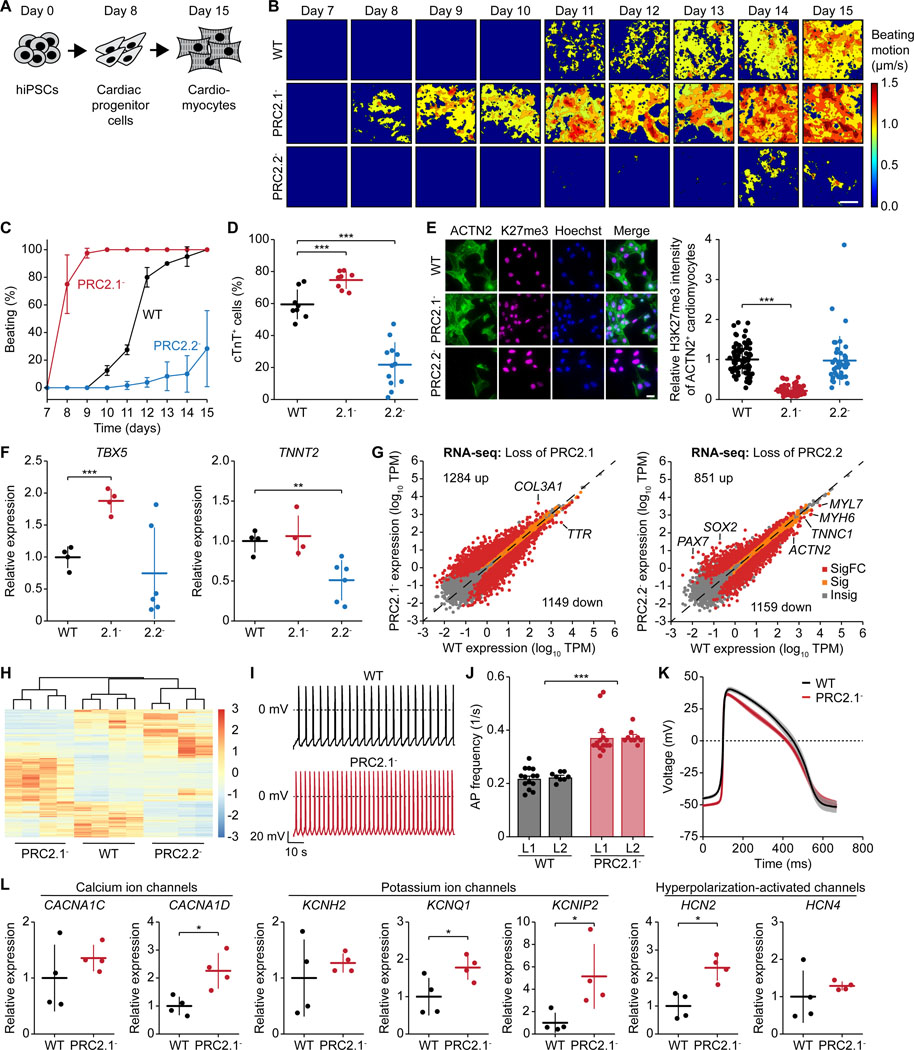
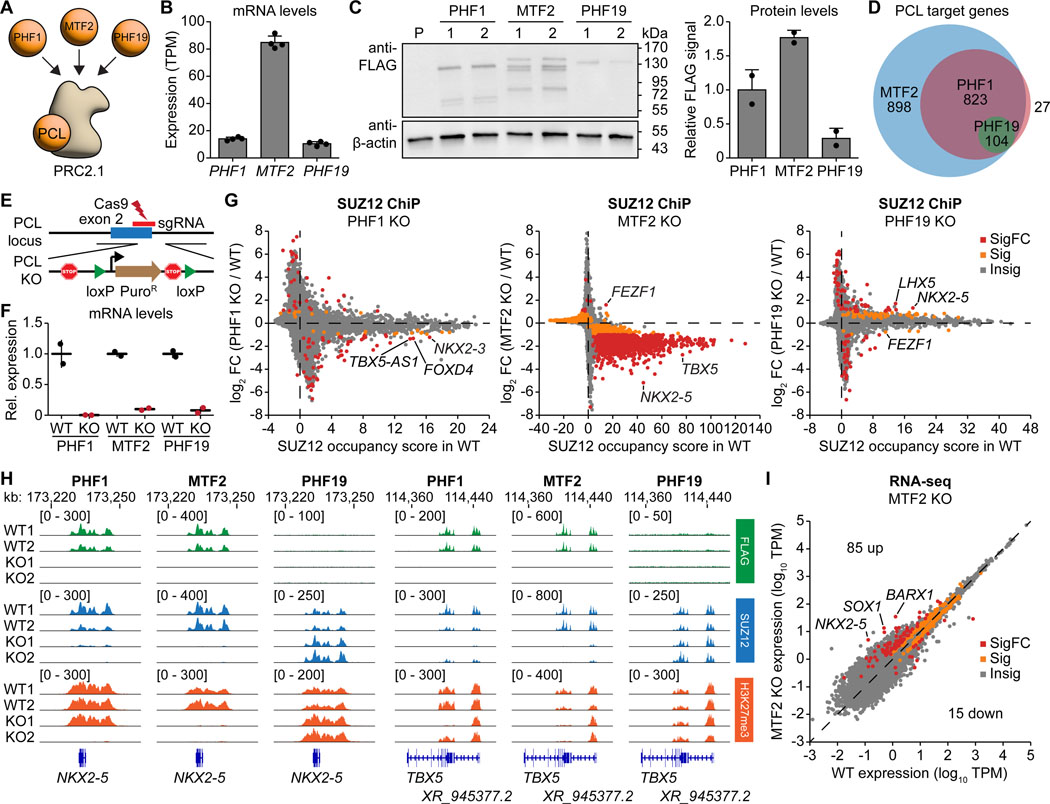
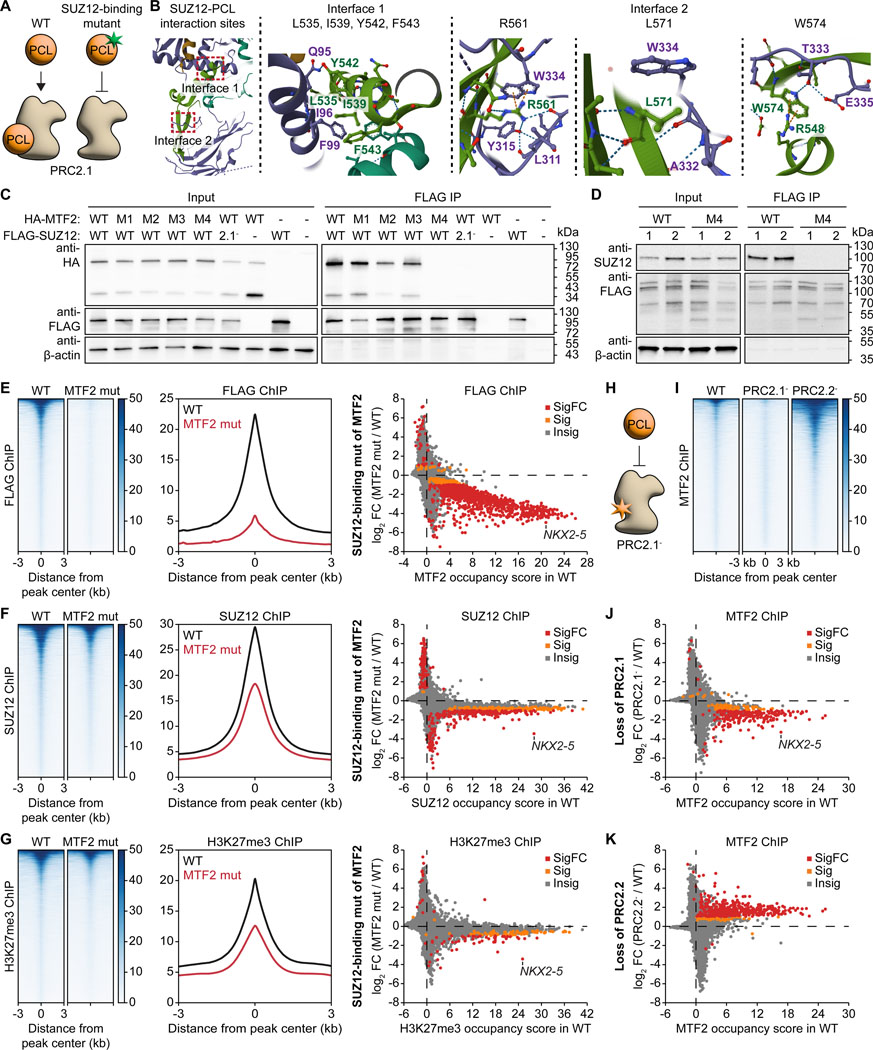
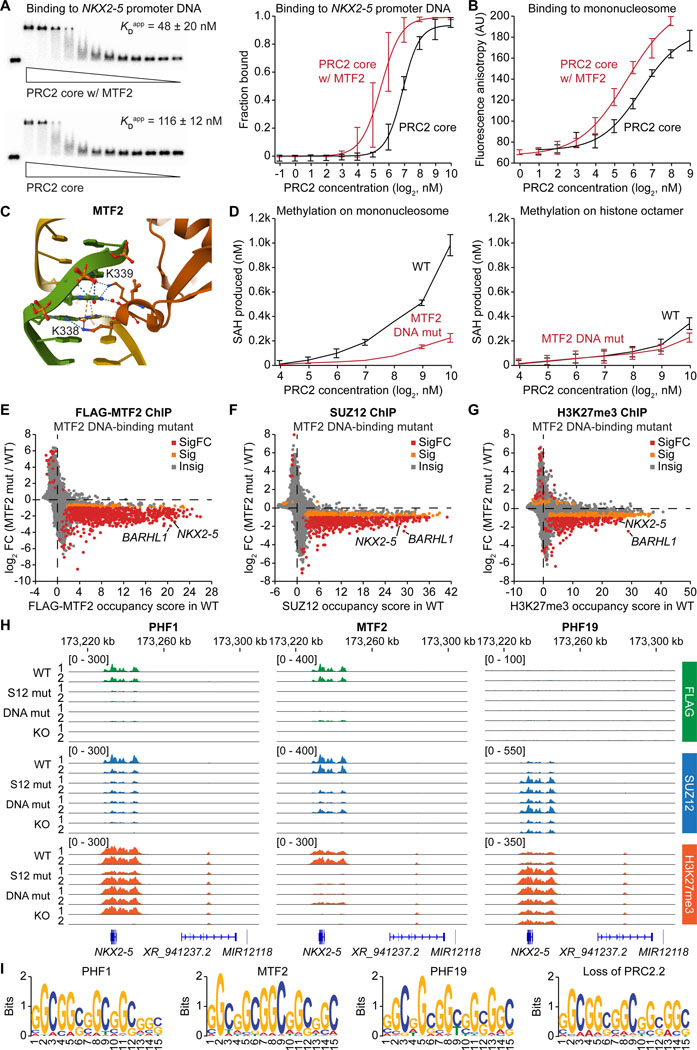
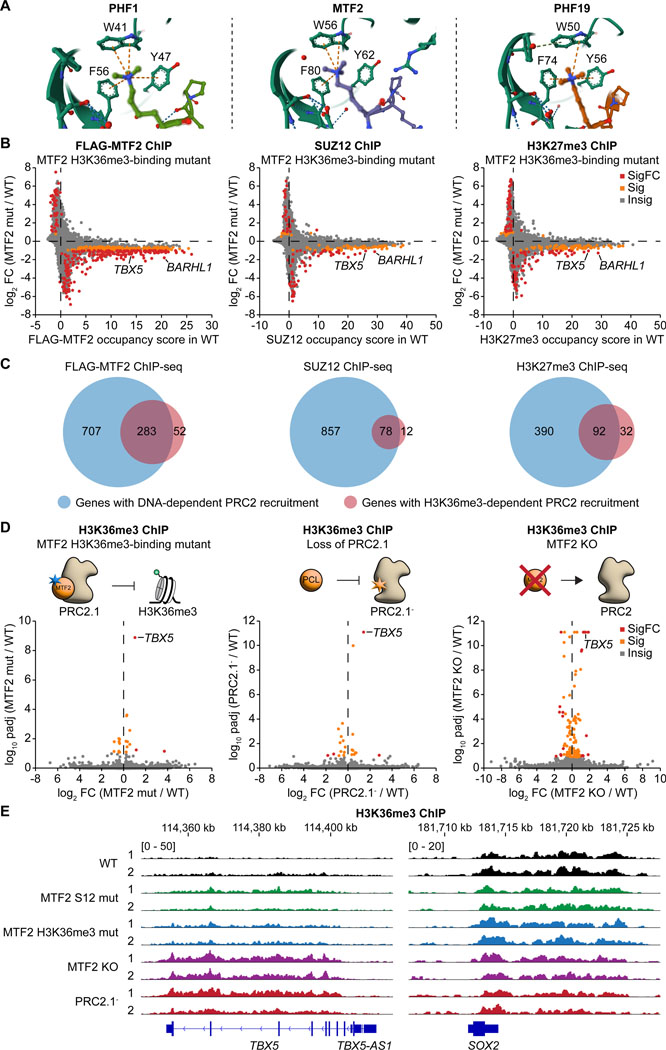
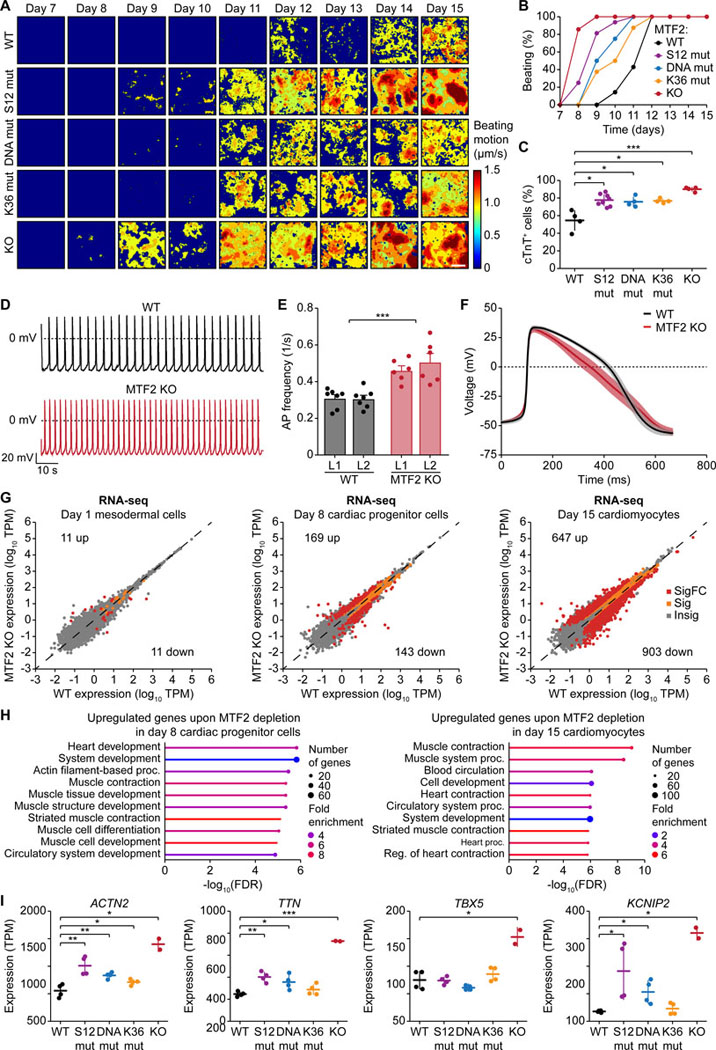
The dynamic regulation of epigenetic states relies on complex macromolecular interactions. PRC2, the methyltransferase complex depositing H3K27me3, interacts with distinct accessory proteins to form the mutually exclusive subcomplexes PHF1-PRC2.1, MTF2-PRC2.1, PHF19-PRC2.1, and PRC2.2. The functions of these subcomplexes are thought to be largely redundant. Here, we show that PRC2 subcomplexes have distinct roles in epigenetic repression of lineage-specific genes and stem cell differentiation. Using human pluripotent stem cells, we engineered a comprehensive set of separation-of-function mutants to dissect the roles of individual protein-protein and DNA-protein interactions. Our results show that PRC2.1 and PRC2.2 deposit H3K27me3 locus-specifically, resulting in opposing outcomes in cardiomyocyte differentiation. We find that MTF2 stimulates PRC2.1-mediated repression in stem cells and cardiac differentiation through its interaction with DNA and H3K36me3, while PHF19 antagonizes it. Together, these results reveal the importance and specificity of individual macromolecular interactions in Polycomb-mediated epigenetic repression in human stem cells and differentiation.

Keywords: H3K27me3; PRC2; Polycomb; cardiac differentiation; epigenetics; human pluripotent stem cells.


Conflict of interest statement

Declaration of interests The authors declare no competing interests.

Figures

Figure 1.
Figure 1.. Distinct roles of PRC2.1 and PRC2.2 subcomplexes in H3K27me3 deposition
(A) Schematic showing the separation-of-function mutants to split the PRC2.1 and PRC2.2 subcomplexes. (B) Western blot on whole-cell lysates of CRISPR-edited 3XFLAG-tagged WT and mutant SUZ12 hiPSCs PRC2.1- and PRC2.2-. 1–3, independent clones for each line; P, untagged parental line. (C) Immunofluorescence micrographs of WT and mutant SUZ12 hiPSC lines stained with anti-FLAG and anti-H3K27me3 antibody. Scale bar represents 20 μm. Quantification of H3K27me3 signal is shown on the right. *** P < 0.001, two-tailed Student’s t-test. (D) Mass spectrometry analysis of proteins co-immunoprecipitating with SUZ12 in WT and mutant SUZ12 hiPSCs. PRC2 accessory proteins are labelled. Insig: P ≥ 0.05, Sig: P < 0.05 and |log2FC| < 1, SigFC: P < 0.05 and |log2FC| ≥ 1. (E and F) ChIP-seq analysis comparing genome-wide chromatin occupancy changes of FLAG-tagged SUZ12 (E) and H3K27me3 (F) upon disruption of PRC2.1 or PRC2.2. Heatmaps (left) and gene scatter plots (right) are shown. Insig: P ≥ 0.1, Sig: P < 0.1 and |log2FC| < 1, SigFC P < 0.1 and |log2FC| ≥ 1, empirical Wald test, FDR-adjusted. (G) ChIP-seq scatter plot comparing the genome-wide differential H3K27me3 levels upon disruption of PRC2.1 and PRC2.2 compared to the WT, identifying PRC2.1 and PRC2.2-specific genes and those genes that require both subcomplexes. Cutoff: P < 0.1 and log2FC < 0. (H) Venn diagram showing the overlap between PRC2.1 and PRC2.2-repressed genes as defined by their loss of H3K27me3 upon PRC2.1 or PRC2.2 disruption. (I) FLAG and H3K27me3 ChIP-seq genome tracks of WT and mutant SUZ12 hiPSC lines at the BARHL1 and ARV1 gene loci. (J) Violin plots showing the occupancy of FLAG-SUZ12 on PRC2.1 and PRC2.2-repressed genes in the WT (top) and its change upon loss of PRC2.1 or PRC2.2 (bottom). Numbers indicate the mean and standard deviation of each group of genes. *** P < 0.001, Welch’s t-test.
Figure 2.
Figure 2.. Distinct functions of PRC2.1 and PRC2.2 subcomplexes in cardiomyocyte differentiation
(A) Schematic showing the induced cardiac differentiation of hiPSCs. (B) Heatmaps showing the time-averaged magnitude of spontaneous contractions of WT, PRC2.1-, and PRC2.2- cardiomyocytes along the differentiation process. (C) Percentage of cell culture wells with spontaneous contractions of WT and mutant SUZ12 cardiomyocytes over time. (D) Percentage of WT and mutant SUZ12 cells expressing cTnT after 15 days of differentiation. *** P < 0.001, two-tailed Student’s t-test. (E) Immunofluorescence micrographs of WT and mutant SUZ12 day 15 cardiomyocytes. Scale bar represents 20 μm. Quantification of the H3K27me3 signal of ACTN2+ day 15 cardiomyocytes is shown on the right. *** P < 0.001, two-tailed Student’s t-test. (F) Relative expression of cardiomyocyte marker genes in day 15 cardiomyocytes as determined by qRT-PCR. * P < 0.05, ** P < 0.01, *** P < 0.001, two-tailed Student’s t-test. (G) RNA-seq scatter plots showing gene expression changes upon loss of PRC2.1 or PRC2.2 in day 15 cardiomyocytes. Insig: P ≥ 0.05, Sig: P < 0.05 and |log2FC| < 1, SigFC: P < 0.05 and |log2FC| ≥ 1, two-sided Wald test. (H) Gene cluster heatmap showing SigFC gene expression changes among WT, PRC2.1-, and PRC2.2- day 15 cardiomyocytes. (I-K) Electrophysiological analysis of WT and PRC2.1- day 24 cardiomyocytes. Representative action potential (AP) traces (I), bar plots of average AP frequency (J), and average single AP trace of all measured cells over time (K) of spontaneous contractions are shown. *** P < 0.001, two-way ANOVA. (L) Relative expression of ion channel genes in day 24 cardiomyocytes as determined by qRT-PCR. * P < 0.05, two-tailed Student’s t-test.
Figure 3.
Figure 3.. Distinct and overlapping roles of PCL proteins in PRC2.1 function
(A) Schematic illustrating the three PCL proteins PHF1, MTF2, and PHF19 associating with the PRC2 core to form three mutually exclusive PRC2.1 subcomplexes. (B) Expression of the three PCL genes in hiPSCs as measured by RNA-seq. (C) Western blot on whole-cell lysates of CRISPR-edited 3XFLAG-HALO-tagged PHF1, MTF2, and PHF19 hiPSCs. Quantification of the FLAG-tagged protein signal of each PCL protein normalized to the β-actin signal is shown on the right. P, untagged parental line. (D) Venn diagram showing the number of distinct and overlapping target genes of the three PCL proteins as defined by FLAG-tagged PCL protein occupancy in the ChIP-seq experiments. (E) Schematic illustrating the PCL gene depletion strategy by inserting poly(A) sites together with a loxP-flanked puromycin resistance gene expression cassette immediately downstream of the translation start site. (F) Relative expression of each PCL gene in WT and KO hiPSC lines as determined by qRT-PCR. (G) ChIP-seq gene scatter plot comparing genome-wide SUZ12 chromatin occupancy changes upon loss of PHF1, MTF2, or PHF19. Insig: P ≥ 0.1, Sig: P < 0.1 and |log2FC| < 1, SigFC: P < 0.1 and |log2FC| ≥ 1, empirical Wald test. (H) FLAG, SUZ12, and H3K27me3 ChIP-seq genome tracks of the PCL protein WT and KO hiPSC lines at the NKX2–5 and TBX5 gene loci. (I) RNA-seq scatter plots showing gene expression changes upon MTF2 depletion. Insig: P ≥ 0.05, Sig: P < 0.05 and |log2FC| < 1, SigFC: P < 0.05 and |log2FC| ≥ 1, two-sided Wald test.
Figure 4.
Figure 4.. Splitting each PCL protein from the PRC2.1 subcomplex results in different epigenetic consequences
(A) Schematic showing the engineering of PCL protein separation-of-function mutants to disrupt their interaction with SUZ12 and the PRC2 core. (B) Crystal structure (PDB: 6NQ3) highlighting the two interaction sites between SUZ12 (purple) and PHF19 (green) including critical amino acid residues. (C) Co-immunoprecipitation assay of transiently expressed ectopic HA-tagged MTF2 and FLAG-tagged SUZ12 in HEK293T cells. Input samples represent the whole cell lysate and the FLAG-IP samples the fraction eluted off the anti-FLAG beads. Mutants of MTF2: M1: L548A, I552A, Y555A, F556A; M2: L584A, W587A; M3: R574A; M4: R574A, L584A, W587A. PRC2.1- mutant of SUZ12: (338–353)GSGSGS. (D) Co-immunoprecipitation assay performed in WT and SUZ12-binding mutant MTF2 hiPSCs. Whole cell lysate (input) was incubated with anti-FLAG beads to pull down the FLAG-tagged MTF2. M4 mutant as in (C): R574A, L584A, W587A. (E-G) ChIP-seq analysis comparing genome-wide chromatin occupancy changes of FLAG-tagged MTF2 (E), SUZ12 (F), and H3K27me3 (G) between WT and the SUZ12-binding mutant of MTF2. Heatmaps (left), metaplots of the peak signals (middle), and gene scatter plots (right) are shown. Insig: P ≥ 0.1, Sig: P < 0.1 and |log2FC| < 1, SigFC: P < 0.1 and |log2FC| ≥ 1, empirical Wald test. (H) Schematic showing the disruption of the PCL protein-PRC2 core interaction using the PRC2.1- mutant. (I-K) ChIP-seq analysis comparing genome-wide chromatin occupancy changes of MTF2 upon loss of PRC2.1 and PRC2.2. Heatmaps (I) and gene scatter plots for PRC2.1- (J) and PRC2.2- (K) are shown. Insig: P ≥ 0.1, Sig: P < 0.1 and |log2FC| < 1, SigFC: P < 0.1 and |log2FC| ≥ 1, empirical Wald test.
Figure 5.
Figure 5.. The DNA-PCL protein interaction is a main driver of PRC2-chromatin interaction
(A) EMSA comparing the binding affinity between an NKX2–5 promoter DNA and the recombinant PRC2 core or the MTF2-containing PRC2.1 complex. Representative EMSA gels (left) and quantification of the fraction of DNA bound (right) are shown. (B) Fluorescence polarization assay measuring the binding affinity between the PRC2 core or the MTF2-containing PRC2.1 complex and fluorescently labeled mononucleosome. (C) Crystal structure (PDB: 5XFR) highlighting the two lysine residues of MTF2 (K338 and K339) interacting with the major groove of double-stranded DNA. (D) Histone H3 methylation assay using recombinant WT or DNA-binding mutant (K338A, K339A) MTF2-containing PRC2.1 complexes on either reconstituted mononucleosome or histone octamer. (E-G) ChIP-seq gene scatter plots comparing genome-wide chromatin occupancy changes of FLAG-MTF2 (E), SUZ12 (F), and H3K27me3 (G) between WT and DNA-binding mutant MTF2 hiPSC lines. Insig: P ≥ 0.1, Sig: P < 0.1 and |log2FC| < 1, SigFC: P < 0.1 and |log2FC| ≥ 1, empirical Wald test. (H) FLAG, SUZ12, and H3K27me3 ChIP-seq genome tracks of WT, SUZ12-binding mutant, DNA-binding mutant, and KO of each PCL protein around the NKX2–5 gene locus. (I) Sequence logos of the most significant DNA motif for PHF1, MTF2, and PHF19 identified in the FLAG ChIP-seq of the respective FLAG-tagged PCL protein hiPSC lines.
Figure 6.
Figure 6.. The H3K36me3-MTF2 interaction provides an alternative recruitment mechanism for PRC2 and stimulates H3K36me3 demethylation at TBX5
(A) Crystal structures showing the recognition of the tri-methylated lysine of H3K36me3 by the aromatic cage of the Tudor domain of PHF1 (PDB: 6WAV), MTF2 (PDB: 5XFR), and PHF19 (PDB: 4BD3). (B) ChIP-seq gene scatter plots comparing genome-wide chromatin occupancy changes of FLAG-MTF2, SUZ12, and H3K27me3 between WT and H3K36me3-binding mutant (Y62A) MTF2 hiPSC lines. Insig: P ≥ 0.1, Sig: P < 0.1 and |log2FC| < 1, SigFC: P < 0.1 and |log2FC| ≥ 1, empirical Wald test. (C) Venn diagrams showing the number of genes with DNA- and H3K36me3-specific recruitment of MTF2 and SUZ12 and deposition of H3K27me3. (D) ChIP-seq volcano plots comparing the gene-specific changes of H3K36me3 levels upon mutating the aromatic cage (Y62A) of MTF2, perturbing SUZ12’s interface with all three PCL proteins, and depleting MTF2. Insig: P ≥ 0.1, Sig: P < 0.1 and |log2FC| < 1, SigFC: P < 0.1 and |log2FC| ≥ 1, empirical Wald test. (E) H3K36me3 ChIP-seq genome tracks of WT, MTF2 SUZ12-binding mutant, MTF2 H3K36me3-binding mutant, MTF2 KO, and PRC2.1- lines at the TBX5 and SOX2 loci.
Figure 7.
Figure 7.. MTF2 loss-of-function accelerates cardiac differentiation
(A) Heatmaps showing the time-averaged magnitude of spontaneous contractions of WT and mutant MTF2 cardiomyocytes along the differentiation process. (B) Percentage of cell culture wells with spontaneous contractions of WT and mutant MTF2 cardiomyocytes over time. (C) Percentage of WT and mutant MTF2 cells expressing cTnT after 15 days of differentiation. * P < 0.05, *** P < 0.001, two-tailed Student’s t-test. (D-F) Electrophysiological analysis of WT and MTF2 KO day 24 cardiomyocytes. Representative action potential (AP) traces (D), bar plots of average AP frequency (E), and average single AP trace of all measured cells over time (F) of spontaneous contractions are shown. *** P < 0.001, two-way ANOVA. (G) RNA-seq scatter plots showing gene expression changes upon loss of MTF2 at day 1, 8, and 15 of the cardiac differentiation process. Insig: P ≥ 0.05, Sig: P < 0.05 and |log2FC| < 1, SigFC P < 0.05 and |log2FC| ≥ 1, two-sided Wald test. (H) Gene ontology analysis of the upregulated genes upon depletion of MTF2 in day 8 cardiac progenitor cells and day 15 cardiomyocytes. (I) Gene expression of ACTN2, TTN, TBX5, and KCNIP2 in WT and MTF2 mutant day 15 cardiomyocytes as determined by RNA-seq. * P < 0.05, ** P < 0.01, *** P < 0.001, two-tailed Student’s t-test.

References

    1. Atlasi Y, and Stunnenberg HG (2017). The interplay of epigenetic marks during stem cell differentiation and development. Nat Rev Genet 18, 643–658. 10.1038/nrg.2017.57. - DOI - PubMed
    1. Trojer P, and Reinberg D (2007). Facultative heterochromatin: is there a distinctive molecular signature? Mol Cell 28, 1–13. 10.1016/j.molcel.2007.09.011. - DOI - PubMed
    1. Yu JR, Lee CH, Oksuz O, Stafford JM, and Reinberg D (2019). PRC2 is high maintenance. Gene Dev 33, 903–935. 10.1101/gad.325050.119. - DOI - PMC - PubMed
    1. Loh CH, van Genesen S, Perino M, Bark MR, and Veenstra GJC (2021). Loss of PRC2 subunits primes lineage choice during exit of pluripotency. Nat Commun 12, 6985. 10.1038/s41467-021-27314-4. - DOI - PMC - PubMed
    1. Fischer S, and Liefke R (2023). Polycomb-like Proteins in Gene Regulation and Cancer. Genes (Basel) 14. 10.3390/genes14040938. - DOI - PMC - PubMed

MeSH terms

LinkOut - more resources