. 2025 Aug 13;16(1):7246.
doi: 10.1038/s41467-025-62517-z.

Dopamine signaling drives skin invasion by human-infective nematodes

Affiliations

Dopamine signaling drives skin invasion by human-infective nematodes

Ruhi Patel et al. Nat Commun. .

Abstract

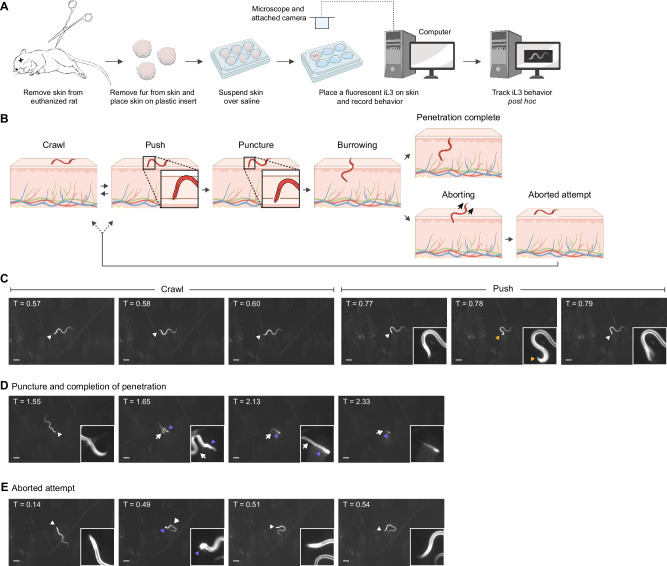
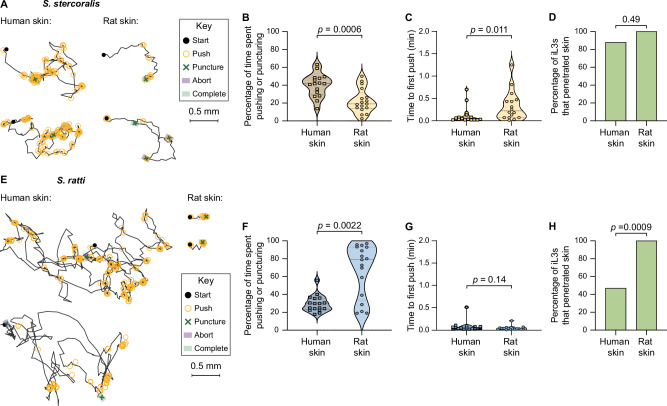
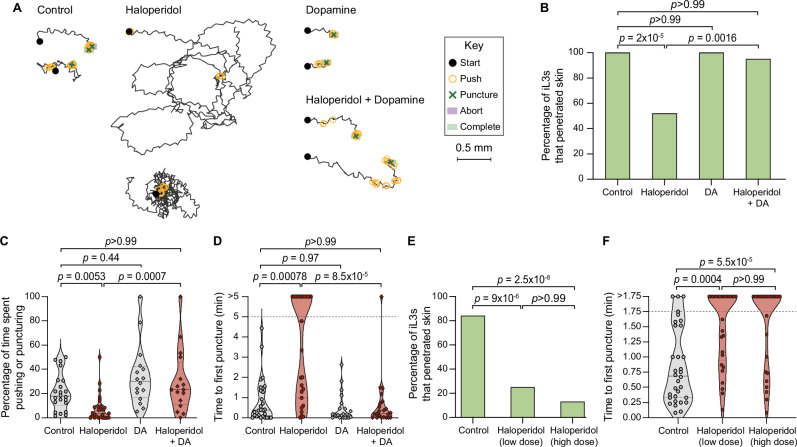
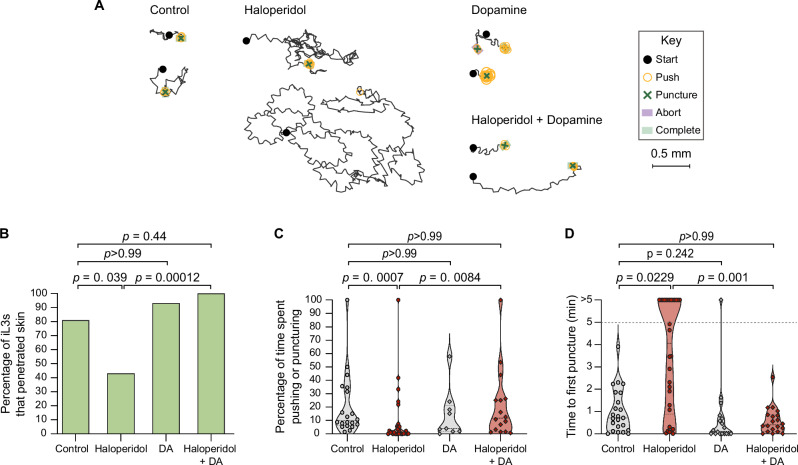
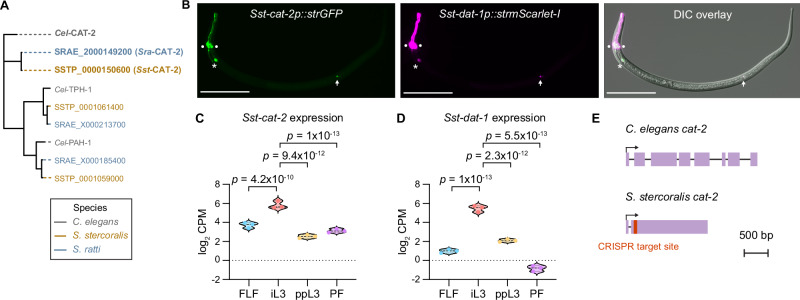
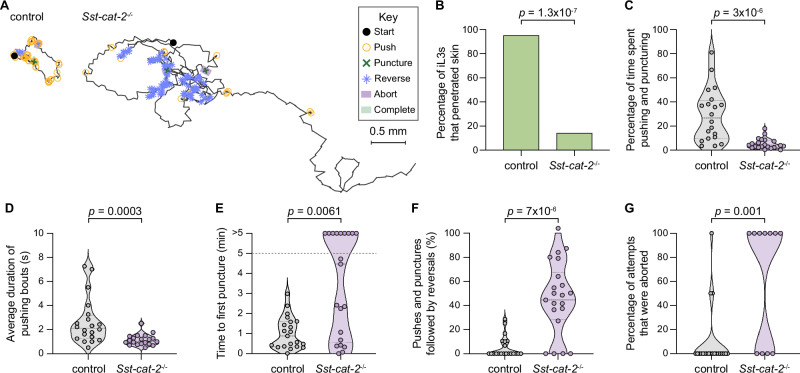
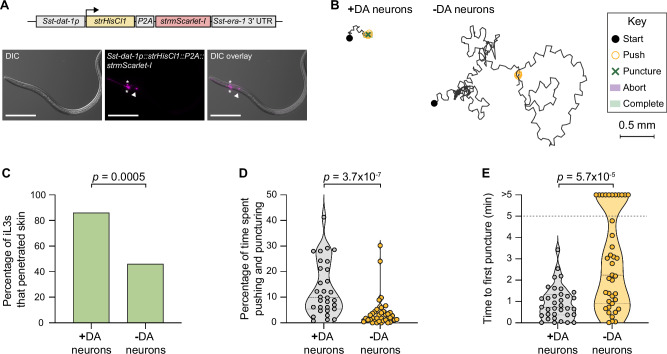
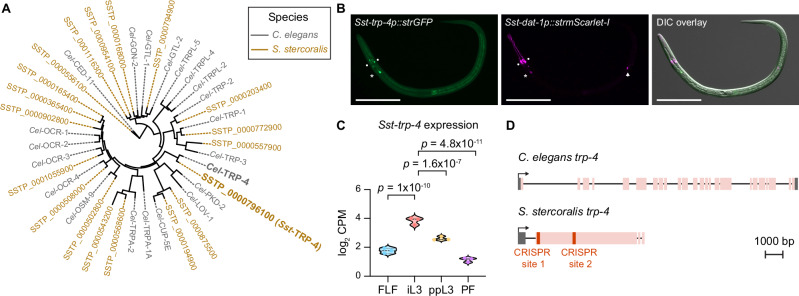
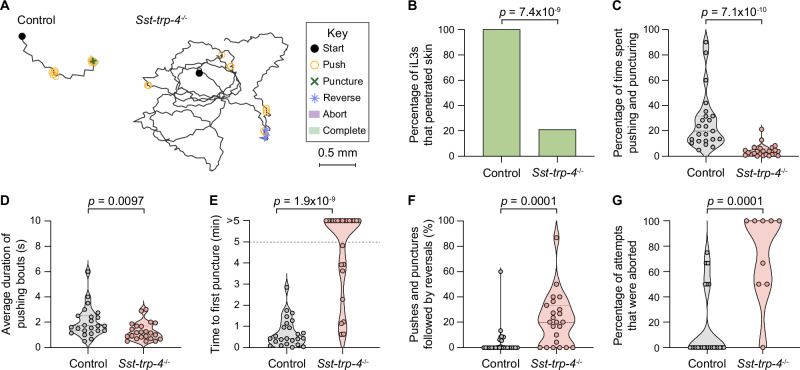
Skin-penetrating nematodes are one of the most prevalent causes of disease worldwide. The World Health Organization has targeted these parasites for elimination by 2030, but the lack of preventative measures is a major obstacle to this goal. Infective larvae enter hosts through skin and blocking skin penetration could prevent infection. However, in order to prevent worm ingress via the skin, an understanding of the behavioral and neural mechanisms that drive skin penetration is required. Here, we describe the skin-penetration behavior of the human-infective threadworm Strongyloides stercoralis. We show that S. stercoralis engages in repeated cycles of pushing, puncturing, and crawling on the skin surface before penetrating. Pharmacological inhibition of dopamine signaling inhibits these behaviors in S. stercoralis and the human hookworm Ancylostoma ceylanicum, suggesting a critical role for dopamine signaling in driving skin penetration across distantly related nematodes. CRISPR-mediated disruption of dopamine biosynthesis and chemogenetic silencing of dopaminergic neurons also inhibit skin penetration. Finally, inactivation of the TRPN channel TRP-4, which is expressed in the dopaminergic neurons, blocks skin penetration. Our results suggest that drugs targeting TRP-4 and other nematode-specific components of the dopaminergic pathway could be developed into topical prophylactics that block skin penetration, thereby preventing infections.


Conflict of interest statement

Competing interests: The authors declare no competing interests.

Figures

Fig. 1
Fig. 1. S. stercoralis iL3s engage in repeated behavioral motifs on skin.
A An ex vivo assay for quantifying behavior on skin. Rat skin is excised, epilated, sectioned, and suspended over BU saline. Next, fluorescent iL3s are placed on the skin surface and time-lapse images are acquired for up to 5 min. B Schematic depicts the behaviors executed by iL3s on skin. Pushes are characterized by pauses in locomotion, coupled with the worm moving its head against the skin without piercing it (inset). Punctures occur when the head breaches the skin surface (inset). Thereafter, the worm either burrows into the skin until penetration is complete or aborts the penetration attempt and returns to the surface. Created in BioRender. Mushtaqh Ali, R. (2025) https://BioRender.com/79cx30x. CE Time-lapse images of an S. stercoralis iL3 on rat skin. See also Supplementary Movie S1. C The iL3 crawled on the skin surface (left three panels) and pushed against the skin (right three panels). The head is blurred in the rightmost panel because the worm was actively pushing against the skin. D The same iL3 puncturing and penetrating skin. The first panel shows the iL3 outside the skin; the second panel shows that the iL3 has punctured the skin; the third panel shows the iL3 burrowing into the skin; and the fourth panel shows that the iL3 has almost completed skin penetration, with only the tip of the tail outside. E The same iL3 aborting an earlier penetration attempt. The first panel shows the iL3 prior to puncturing the skin and the second panel shows that the iL3 has punctured the skin, with its head no longer detectable. The third and fourth panels show that the iL3 has aborted the penetration attempt and returned to the surface. In panels (CE), white arrowheads indicate the head of the worm, yellow arrowheads indicate pushing, purple arrowheads indicate the skin entry point, and white arrows indicate the part of the worm outside the skin. Timestamps (min) for each panel are relative to the time of placement on skin. Scale bar = 100 µm. Insets are magnified 4× and the contrast is increased. A and B were generated in BioRender.
Fig. 2
Fig. 2. Skin-penetration behavior is conserved across species but occurs more frequently on host skin.
A S. stercoralis iL3s show more skin-penetration behavior on human than rat skin. Two representative iL3s on each skin type are shown; key shows behavioral motifs that were tracked. B Violin plot shows the percentage of time S. stercoralis iL3s pushed and punctured the surface of human or rat skin. n = 16 and 17 iL3s on human and rat skin, respectively. C Violin plot shows the time taken by S. stercoralis iL3s to push for the first time since placement on either human or rat skin. n = 16 iL3s per skin type. D Bar graph shows the percentage of S. stercoralis iL3s that penetrated human or rat skin. n = 17 iL3s per skin type. E S. ratti iL3s push down on rat skin more than human skin. Two representative iL3s on each skin type are shown. Key shows behavioral motifs. F Violin plot shows the percentage of time S. ratti iL3s spent pushing or puncturing the surface of human or rat skin. n = 17 iL3s per skin type. G Violin plot shows the time taken by S. ratti iL3s to push down for the first time since placement on either human or rat skin. n = 17 iL3s per skin type. H Bar graph shows the percentage of S. ratti iL3s that penetrated human or rat skin. n = 17 iL3s per skin type. For (B, C, F, G), dots, dashed lines, and dotted lines indicate individual worms, medians, and interquartile ranges, respectively. Data in (BD) were obtained from 4 independent replicates, and data in (FH) from 3 independent replicates. Skin from three human donors was tested. A two-tailed unpaired t-test was used in (B), two-tailed Mann–Whitney tests were used in (C, F, G), and two-tailed Fisher’s exact tests were used in (D, H). There are no error bars in (D, H) because graphs show percentages of the total iL3s tested. Transgenic EAH435 and EAH414 strains were used in these experiments. Source data are provided in the Source Data file.
Fig. 3
Fig. 3. Pharmacological inhibition of dopamine signaling blocks skin penetration in Strongyloides.
A Haloperidol inhibits penetration and dopamine rescues this phenotype. Tracks show representative S. stercoralis iL3s from each treatment group. Key shows behavioral motifs. B Graph shows the percentage of S. stercoralis iL3s treated with vehicle (“control”), 1.5 mM haloperidol, 10 mM dopamine (DA), or 1.5 mM haloperidol +10 mM DA that completed penetration. n = 28 control, 27 haloperidol-treated, 22 DA-treated and 22 haloperidol+DA-treated iL3s. C Violin plot depicts the percentage of time S. stercoralis iL3s pushed and punctured skin. n = 22 control, 26 haloperidol-treated, 16 DA-treated, and 16 haloperidol+DA-treated iL3s. D Violin plot depicts the time taken by S. stercoralis iL3s to first puncture skin. Dotted line at y = 5 indicates the assay end time; dots above this line indicate animals that failed to puncture. n = 28 control, 27 haloperidol-treated, 22 DA-treated, and 22 haloperidol+DA-treated iL3s. E Graph shows the percentage of S. ratti iL3s treated with vehicle (“control”), low-dose haloperidol (160 µM), or high-dose haloperidol (1 mM) that penetrated live rat skin. n = 32 iL3s per condition. F Violin plot depicts the time taken by S. ratti iL3s to first puncture live rat skin. Worms that did not puncture the skin by 1.75 min were set to “>1.75”. n = 32 control, 29 160-µM-treated, and 30 1-mM-treated iL3s. For violin plots, dots, dashed lines, and dotted lines depict individual worms, medians, and interquartile ranges, respectively. Data in (BD) and (E, F) are from 4 independent replicates. Data in (E, F) are from 7 male and 2 female rats. Two-tailed Fisher’s exact tests with Bonferroni’s correction were used in (B, E), and Kruskal–Wallis tests with Dunn’s post-test were used in (C, D, F). There are no error bars in (B, E) because graphs show percentages of the total iL3s tested. DiI-stained iL3s and rat skin were used in these experiments. Source data are provided in the Source Data file.
Fig. 4
Fig. 4. Pharmacological inhibition of dopamine signaling blocks skin penetration in the human-parasitic hookworm A. ceylanicum.
A Haloperidol inhibits skin penetration, and dopamine rescues this phenotype. Tracks show two representative worms from each treatment group; for the haloperidol-treated group, one representative worm that completed penetration and one randomly selected worm that did not complete penetration are shown. Key shows behavioral motifs. B Bar graph shows the percentage of A. ceylanicum iL3s that were treated with either the vehicle (“control”), 160 µM haloperidol, 10 mM DA, or 160 µM haloperidol +10 mM DA that completed penetration. n = 21 control, 31 haloperidol-treated, 14 DA-treated, and 18 haloperidol+DA-treated iL3s. There are no error bars because the graph shows the percentage of iL3s in each treatment group that completed penetration out of the total number tested. C Violin plot depicts the percentage of time that A. ceylanicum iL3s spent engaging in pushes or punctures. n = 20 control, 29 haloperidol-treated, 9 DA-treated, and 16 haloperidol+DA-treated iL3s. D Violin plot depicts the time taken by A. ceylanicum iL3s to first puncture skin. The dotted line at y = 5 indicates the time at which the assay ended; the dots above this line indicate worms that failed to puncture. n = 23 control, 30 haloperidol-treated, 18 DA-treated, and 20 haloperidol+DA-treated iL3s. For (C, D), dots depict individual worms, dashed lines indicate medians, and dotted lines indicate interquartile ranges. Data in (BD) were obtained from 4 independent replicates. A two-tailed Fisher’s exact test with Bonferroni correction for multiple comparisons was used in (B), and Kruskal–Wallis tests with Dunn’s post-test were used in (C, D). DiI-stained iL3s and rat skin were used in these experiments. Source data are provided in the Source Data file.
Fig. 5
Fig. 5. Identification of S. stercoralis cat-2.
A Phylogenetic analysis shows the closest homologs of C. elegans CAT-2 (gray) in S. stercoralis (brown) and S. ratti (blue). B Co-expression of Sst-cat-2 and Sst-dat-1 in the putative dopaminergic neurons of S. stercoralis. Montage shows expression of an Sst-cat-2 transcriptional reporter (green), expression of an Sst-dat-1 transcriptional reporter (magenta), and co-expression of the two reporters and the relative positions of these neurons along the body of the iL3 in the differential interference contrast (DIC) overlay. The Sst-cat-2 transcriptional reporter comprises a 1639 bp region upstream of the Sst-cat-2 start codon fused with a gene encoding GFP that is codon-optimized for expression in Strongyloides species (strGFP). Similarly, the Sst-dat-1 transcriptional reporter comprises a 2579 bp region upstream of the Sst-dat-1 start codon fused with Strongyloides-codon-optimized mScarlet-I (strmScarlet-I). The circles, asterisk, and arrow label the putative Sst-CEP, Sst-ADE, and Sst-PDE neurons, respectively. Dorsal is up; head is left. Scale bar = 100 µm. C, D Violin plots show expression levels of Sst-cat-2 and Sst-dat-1, in log2 counts per million (CPM), at the indicated life stages based on published RNA-seq datasets,,. Statistical tests for differential gene expression analysis were performed using the limma R package as previously described, and p-values were adjusted for multiple comparisons using the Benjamini-Hochberg method. FLF free-living female, iL3 infective third-stage larva, ppL3 post-parasitic third-stage larva, PF parasitic female. Each dot indicates an independent replicate. E The cat-2 genes of C. elegans and S. stercoralis. Schematics show the gene models of Cel-cat-2 (isoform a) and Sst-cat−2. Exons and introns are depicted as lavender boxes and black lines, respectively. Transcriptional start sites are indicated by arrows. Sst-cat-2 has a single CRISPR/Cas9 target site in the second exon (red). Drawings are to scale and scale bar = 500 bp. Source data are provided in the Source Data file.
Fig. 6
Fig. 6. Dopamine is required for skin penetration.
A Inactivation of Sst-cat-2 drastically alters skin-penetration behavior on rat skin. Tracks show the skin-penetration behaviors of a representative control iL3 that punctured and penetrated the skin and a representative Sst-cat-2−/− iL3 that punctured but did not complete penetration. Key shows behavioral motifs. B Bar graphs show the percentage of control and Sst-cat-2−/− iL3s that completed skin penetration. n = 21 iL3s per genotype. There are no error bars in the bar graph because the graph shows the percentage of iL3s of each genotype that completed penetration out of the total number tested. C Violin plot depicts the percentage of time on skin that control and Sst-cat-2−/− iL3s spent engaging in pushes or punctures. n = 20 control and 21 Sst-cat-2−/− iL3s. D Violin plot shows the average duration of pushing bouts for control vs. Sst-cat-2−/− iL3s. n = 20 iL3s per genotype. E Violin plot depicts the time taken by control vs. Sst-cat-2−/− iL3s to first puncture the skin. n = 21 iL3s per genotype. The dotted line at y = 5 indicates the time at which the assay ended; the dots above this line indicate animals that failed to puncture the skin. F Violin plot shows the percentage of pushes or punctures that were followed by backward locomotion that lasted at least 1 s for control vs. Sst-cat-2−/− iL3s. n = 21 iL3s per genotype. G Violin plot depicts the percentage of penetration attempts, as defined by instances where the worm punctured and partially entered the skin, that were aborted, for control vs. Sst-cat-2−/− iL3s. n = 21 control and 11 Sst-cat-2−/− iL3s. For (CG), dots depict individual worms, dashed lines indicate medians, and dotted lines indicate interquartile ranges. Data in (BG) are from 3 independent replicates. A two-tailed Fisher’s exact test was used in (B) and two-tailed Mann–Whitney tests were used in (CG). Source data are provided in the Source Data file.
Fig. 7
Fig. 7. Dopaminergic neurons are required for skin penetration.
A Schematic of the transgene used for silencing S. stercoralis dopaminergic (DA) neurons. The histamine-gated chloride channel HisCl1 was expressed in the DA neurons using the Sst-dat-1 promoter. Exposure of transgenic iL3s to exogenous histamine partially silences the DA neurons (-DA neurons) relative to the vehicle control (+DA neurons). Sst-dat-1p, S. stercoralis dat-1 promoter; strHisCl1, Strongyloides-codon-optimized HisCl1; P2A, sequence encoding the self-cleaving P2A peptide; strmScarlet-I, Strongyloides-codon-optimized mScarlet-I; Sst-era-1 3′ UTR, 3′ UTR of Sst-era-1. The Sst-dat-1 promoter is described in Fig. 5B. Montage shows a transgenic iL3 expressing the Sst-dat−1p::strHisCl1::P2A::strmScarlet-I construct in the putative Sst-CEP (asterisks) and Sst-ADE (arrowhead) neurons. Expression in Sst-PDE neurons was rarely observed; thus, these neurons may not be silenced. Ventral is up; head is left. Scale bar = 100 µm. B Silencing the DA neurons inhibits skin penetration. Behaviors of a representative mock-treated iL3 (+DA neurons) that punctured and completed penetration and a representative histamine-treated iL3 (-DA neurons) that neither punctured nor completed penetration are shown. Key shows behavioral motifs. C Bar graph shows the percentage of mock-treated (+DA neurons) and histamine-treated (-DA neurons) iL3s that penetrated. n = 38 +DA-neuron and 39 -DA-neuron iL3s. There are no error bars because the graph shows the percentage of iL3s that completed penetration out of the total tested. D Violin plot depicts the percentage of time on skin spent engaging in pushes or punctures. n = 31 +DA-neuron and 38 -DA-neuron iL3s. E Violin plot depicts the time taken to first puncture skin. n = 35 +DA-neuron and 39 -DA-neuron iL3s. The dotted line at y = 5 indicates the time the assay ended; dots above this line indicate animals that failed to puncture. For (D, E), dots depict individual worms, dashed lines indicate medians, and dotted lines indicate interquartile ranges. Data in (CE) are from 6 independent replicates. A two-tailed Fisher’s exact test was used in (C), and two-tailed Mann–Whitney tests were used in (D, E). DiI-stained iL3s and rat skin were used in these experiments. Source data are provided in the Source Data file.
Fig. 8
Fig. 8. Identification of S. stercoralis trp-4.
A Phylogenetic analysis shows the closest homologs of C. elegans TRP-4 (gray) in S. stercoralis (brown). The tree has all known TRP family members in C. elegans and the predicted homologs in S. stercoralis. B Co-expression of Sst-trp-4 and Sst-dat-1 in the putative dopaminergic (DA) neurons of S. stercoralis. Montage shows expression of the Sst-trp-4 transcriptional reporter in green, expression of the Sst-dat-1 transcriptional reporter in magenta, and co-expression of the two reporters and the relative positions of these neurons along the body of the iL3 in the DIC overlay. The Sst-trp-4 transcriptional reporter comprises a 2320 bp region upstream of the Sst-trp-4 start codon fused with strGFP. The Sst-dat-1 transcriptional reporter is described in Fig. 5B. The circles, asterisk, and arrow label the putative Sst-CEP, Sst-ADE, and Sst-PDE neurons, respectively; we never observed expression of the Sst-trp-4 reporter in Sst-PDE. Dorsal is up; head is left. Scale bar = 100 µm. C Violin plot shows expression levels of Sst-trp-4, in log2 counts per million (CPM), at the indicated life stages based on published RNA-seq datasets,,. Statistical tests for differential gene expression analysis were performed using the limma R package as previously described, and p-values were adjusted for multiple comparisons using the Benjamini-Hochberg method. FLF free-living female, iL3 infective third-stage larva, ppL3 post-parasitic third-stage larva, PF parasitic female. Each dot indicates an independent replicate. D Schematic of the trp-4 genes of C. elegans and S. stercoralis. Exons, introns, and UTRs are depicted as pink boxes, black lines, and gray boxes, respectively. Transcriptional start sites are indicated by arrows. Sst-trp-4 has two CRISPR/Cas9 target sites in the first exon (red); we used two distinct single guide RNAs (sgRNAs), one targeting each CRISPR site, to inactivate Sst-trp-4. Drawings are to scale and scale bar = 1000 bp. Source data are provided in the Source Data file.
Fig. 9
Fig. 9. Sst-TRP-4 is required for skin penetration.
A Sst-trp-4 mutants have reduced skin-penetration behavior on rat skin. Tracks show a representative control iL3 that punctured and completed penetration and a representative Sst-trp-4−/− iL3 that neither punctured nor completed penetration. Key details behavioral motifs. B Bar graph shows the percentage of control and Sst-trp-4−/− iL3s that penetrated. n = 24 iL3s per genotype. There are no error bars because the graph shows the percentage of iL3s of each genotype that completed penetration out of the total tested. C Violin plot depicts the percentage of time on skin spent engaging in pushes or punctures. n = 23 control and 24 Sst-trp-4−/− iL3s. D Violin plot depicts the average duration of pushing bouts. n = 23 iL3s per genotype. E Violin plot depicts the time taken to first puncture the skin. n = 24 iL3s per genotype. The dotted line at y = 5 indicates the time at which the assay ended; dots above this line indicate animals that failed to puncture. F Violin plot shows the percentage of pushes or punctures that were followed by backward locomotion that lasted at least 1 s. n = 24 control and 23 Sst-trp-4−/− iL3s. G Violin plot depicts the percentage of penetration attempts, as defined by instances where the worm punctured and partially entered the skin, that were aborted. n = 24 control and 9 Sst-trp-4−/− iL3s. For (CG), dots depict individual worms, dashed lines indicate medians, and dotted lines indicate interquartile ranges. Data in (BG) are from 3 independent replicates. A two-tailed Fisher’s exact test was used in (B), and two-tailed Mann–Whitney tests were used in (CG). Source data are provided in the Source Data file.

Update of

References

    1. Riaz, M. et al. Prevalence, risk factors, challenges, and the currently available diagnostic tools for the determination of helminths infections in human. Eur. J. Inflamm.18, 1–15 (2020).
    1. Buonfrate, D. et al. The global prevalence of Strongyloides stercoralis infection. Pathogens9, 468 (2020). - PMC - PubMed
    1. Forrer, A. et al. Strongyloides stercoralis is associated with significant morbidity in rural Cambodia, including stunting in children. PLoS Negl. Trop. Dis.11, e0005685 (2017). - PMC - PubMed
    1. Fauziah, N., Ar-Rizqi, M. A., Hana, S., Patahuddin, N. M. & Diptyanusa, A. Stunting as a risk factor of soil-transmitted helminthiasis in children: a literature review. Interdiscip. Perspect. Infect. Dis.2022, 8929025 (2022). - PMC - PubMed
    1. Shang, Y. et al. Stunting and soil-transmitted-helminth infections among school-age pupils in rural areas of southern China. Parasit. Vectors3, 97 (2010). - PMC - PubMed

LinkOut - more resources