. 2025 Aug 13;16(1):7496.
doi: 10.1038/s41467-025-62525-z.

FedECA: federated external control arms for causal inference with time-to-event data in distributed settings

Affiliations

FedECA: federated external control arms for causal inference with time-to-event data in distributed settings

Jean Ogier du Terrail et al. Nat Commun. .

Abstract

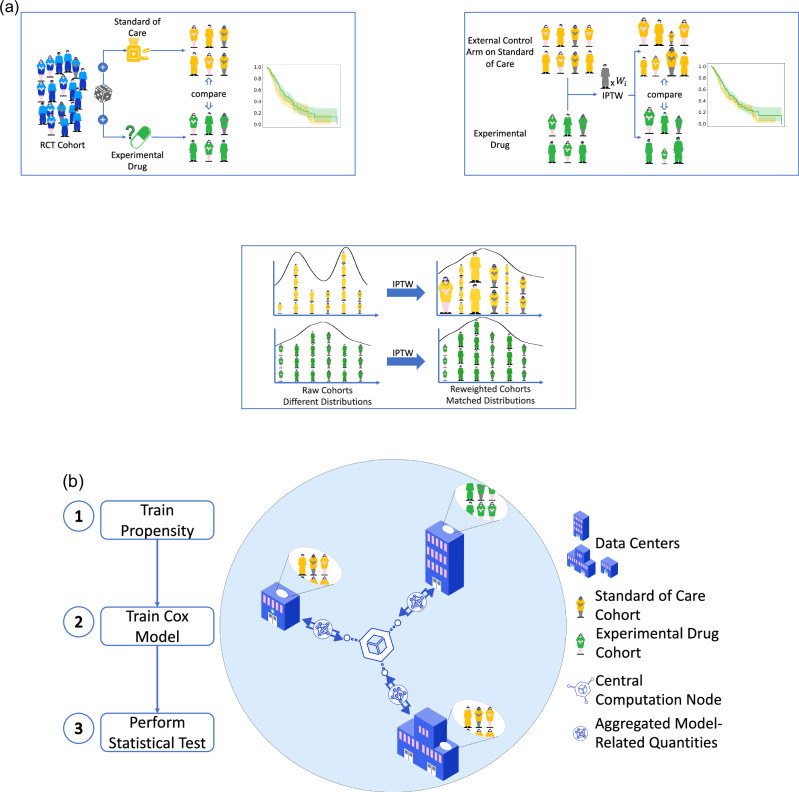
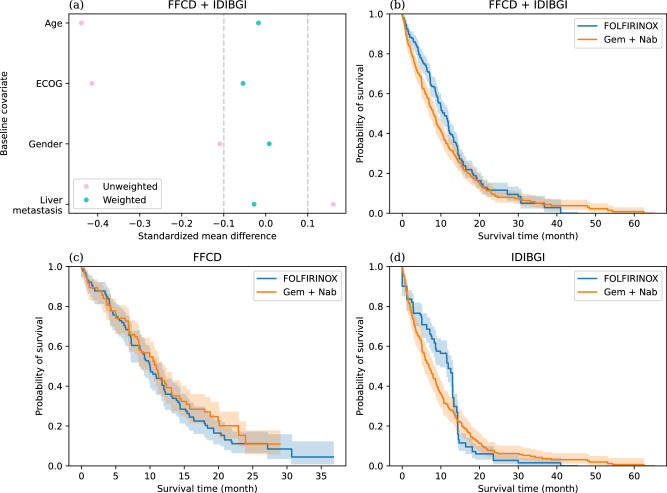
External control arms can inform early clinical development of experimental drugs and provide efficacy evidence for regulatory approval. However, accessing sufficient real-world or historical clinical trials data is challenging. Indeed, regulations protecting patients' rights by strictly controlling data processing make pooling data from multiple sources in a central server often difficult. To address these limitations, we develop a method that leverages federated learning to enable inverse probability of treatment weighting for time-to-event outcomes on separate cohorts without needing to pool data. To showcase its potential, we apply it in different settings of increasing complexity, culminating with a real-world use-case in which our method is used to compare the treatment effect of two approved chemotherapy regimens using data from three separate cohorts of patients with metastatic pancreatic cancer. By sharing our code, we hope it will foster the creation of federated research networks and thus accelerate drug development.


Conflict of interest statement

Competing interests: The authors declare the existence of a financial competing interest. Some authors are or were employed by Owkin, Inc. during their time on the project (J. O.d.T, Q.K., M.A., H.L, I.M., N.L., M.H., M.D., T.C., T.F., F.B., J.A.C., Z.Y.). P. L.-P. has received honoraria for consulting and/or advisory board for AMGEN, Pierre Fabre, Biocartis, Servier and BMS. J.B. Bachet has received personal fees from Amgen, Bayer, Bristol Myers Squibb, GlaxoSmithKline, Merck Serono, Merck Sharp & Dohme, Pierre Fabre, Sanofi, Servier, and non-financial support from Amgen, Merck Serono, and Roche, outside the submitted work. J. T. has received honoraria as a speaker and/or in an advisory role from AMGEN, Astelllas, Astra Zeneca, Boehringer, BMS, Merck KGaA, MSD, Novartis, ONO pharmaceuticals, Pierre Fabre, Roche Genentech, Sanofi, Servier and Takeda. A. G. V. has received honoraria as a speaker and/or in an advisory role from Astra Zeneca, Merck Serono, MSD, Novartis, Roche Genentech, Sanofi, and Servier. R. N. has received honoraria as a consultant from Cure51. Part of this work corresponding to work-package 4 of the RHU AI-TRIOMPH and carried out by Owkin France was supported by Agence Nationale de la Recherche as part of the France 2030 plan with reference ANR-23-RHUS-0012 (H.L and F.B.). The remaining authors declare no competing interests.

Figures

Fig. 1
Fig. 1. Illustration of randomized controlled trials (RCT) versus an external control arm (ECA) analysis.
FedECA graphical abstract. a In an RCT, patients are randomly assigned to either the experimental (i.e., treatment) or the control arm. In an ECA, patients are assigned to the treatment arm, while the control arm is defined using historical data. Due to this absence of randomization and the resulting confounding, the two groups of patients cannot be compared directly. To overcome this issue, a model is used to capture the association between the treatment allocation and the confounding factors. From this model, weights are computed and are used to balance the two arms to ensure comparability. Then, the weights are incorporated into a Cox model to estimate the treatment effect. Finally, a statistical test is performed to assess the significance of the measured treatment effect. b In the considered setting, patient data is stored in different geographically distinct centers, and a similar analysis as in (a) is attempted thanks to our algorithm FedECA. A trusted third party is responsible for the orchestration of the training processes, which consists of exchanging model-related quantities across the centers. No individual patient data is shared between the centers, and only aggregated information is exchanged, which limits patient data exposure while producing equivalent results. Some of the symbols used in the figure have been bought to the Noun Project, Inc. by M.H., granting M.H. perpetual, non-exclusive, worldwide rights to such symbols.
Fig. 2
Fig. 2. Pooled equivalence between IPTW and FedECA.
Box- and swarm-plots of the relative errors between FedECA and the pooled IPTW on four different quantities: the hazard ratio of the treatment allocation covariate estimated from a Cox model, the partial likelihood of the Cox model, the P-value associated to the hazard ratio, and the propensity scores estimated from the logistic regression. For each quantity, relative error is defined as the absolute difference between the pooled IPTW value and the FedECA value, divided by the pooled IPTW value. Each quantity was computed from n = 100 repetitions of the simulation, that is computed by running FedECA and pooled IPTW on n random draws of 1000 samples with 10 covariates. Red dotted line indicates a relative error of 0.2% between FedECA and the pooled IPTW. Boxplot and swarm-plot use the seaborn Python library’s default settings, that is: boxes are from the first to the third quartiles, the black line being the median, and whiskers extend to the lowest (resp. highest) data point still within 1.5 inter-quartile range of the lower (upper) quartile. No statistical test was used. Source data are provided as a Source Data file.
Fig. 3
Fig. 3. Comparison of different methods on statistical power, type I error of treatment effect estimates, as well as standardized mean difference (SMD) of covariates between the two treatment arms.
a Curves representing the mean absolute SMD computed on 10 covariates as a function of the covariate shift for three different methods: FedECA, MAIC and the non-adjusted treatment effect estimation (unweighted) over n = 100 repetitions. Shaded area is the two-sided 95% interval around the mean assuming standard normal distributions. b Boxplots representing the distribution of the absolute SMD over the n = 100 repetitions for the first five covariates. Each estimation of SMD is based on n = 100 repetitions of propensity score estimation. For all simulations, we generate 10 covariates and 1000 samples. Boxplot and swarmplot uses the seaborn Python library’s default settings that is: boxes are from the first to the third quartiles, the black line being the median, and whiskers extend to the lowest (resp. highest) data point still within 1.5 inter-quartile range of the lower (upper) quartile. c Comparison of different methods on statistical power and type I error of treatment effect estimation. Different variance estimation methods leading to different p-values are given in parentheses after each method giving point estimates of the hazard ratio. In particular, the naive variance estimation is based on the simple inversion of the observed Fisher information. For statistical power, only results of methods that consistently control the type I error around/under 0.05 (marked by gray dashed lines in top panels) are shown. Each estimation of statistical power or type I error is based on n = 1000 repetitions of treatment effect estimation. For bootstrap-based variance estimating methods, the number of bootstrap resampling is set to 200. For all simulations, we assume 10 covariates. The hazard ratio of the simulated treatment effect is set to 0.4 for the estimation of statistical power, and to 1.0 for the estimation of type I error. For simulations with varying covariate shifts (the two panels on the left), the number of samples is fixed at 700. For simulations with varying sample size (the two panels on the right), the covariate shift is fixed at 2.0. The asterisk on FedECA indicates that, due to the time-consuming nature of the power analysis, their more lightweight pooled-equivalent counterparts were used instead (pooled IPTW). For confidence intervals, we use the central limit theorem applied to Bernoulli variables to compute parameters of the associated normal and plot the two-sided 95% intervals as error bars. No statistical test was used. Source data are provided as a Source Data file.
Fig. 4
Fig. 4. Real-world FOLFIRINOX effect estimation using FedECA versus local analyses.
a SMD of covariates between the two arms of the combined FFCD+IDIBGI cohort, before and after weighting by FedECA's propensity model. Therefore, each dot represents the SMD over n = 153 + 225 = 378 samples. b Weighted Kaplan-Meier curves of the combined FFCD + IDIBGI cohort using FedECA's propensity model. Sample size is n = 378. The 95% confidence intervals displayed are obtained using the exponential Greenwood formula. c Weighted Kaplan-Meier curves of the FFCD cohort using a local propensity model. Sample size is n = 225. The 95% confidence intervals displayed are obtained using the exponential Greenwood formula. d Weighted Kaplan-Meier curves of the IDIBGI cohort using a local propensity model. Sample size is n = 153. The 95% confidence intervals displayed are obtained using the exponential Greenwood formula. Associated p-values can be found in the associated table. Source data are provided as a Source Data file.

Similar articles

References

    1. DiMasi, J. A., Grabowski, H. G. & Hansen, R. W. Innovation in the pharmaceutical industry: new estimates of r&d costs. J. Health Econ.47, 20–33 (2016). - PubMed
    1. Hay, M., Thomas, D. W., Craighead, J. L., Economides, C. & Rosenthal, J. Clinical development success rates for investigational drugs. Nat. Biotechnol.32, 40–51 (2014). - PubMed
    1. Dowden, H. & Munro, J. Trends in clinical success rates and therapeutic focus. Nat. Rev. Drug Discov.18, 495–496 (2019). - PubMed
    1. Ventz, S. et al. Design and evaluation of an external control arm using prior clinical trials and real-world data. Clin. Cancer Res.25, 4993–5001 (2019). - PMC - PubMed
    1. Yin, X. et al. Historic clinical trial external control arm provides an actionable gen-1 efficacy estimate before a randomized trial. JCO Clin. Cancer Inform.7, e2200103 (2023). - PubMed

LinkOut - more resources