. 2025 Aug 13;15(1):29733.
doi: 10.1038/s41598-025-12651-x.

The immune-related prognostic gene AIM2 promotes pancreatic cancer progression via inflammasome

Affiliations

The immune-related prognostic gene AIM2 promotes pancreatic cancer progression via inflammasome

Lin Liang et al. Sci Rep. .

Abstract

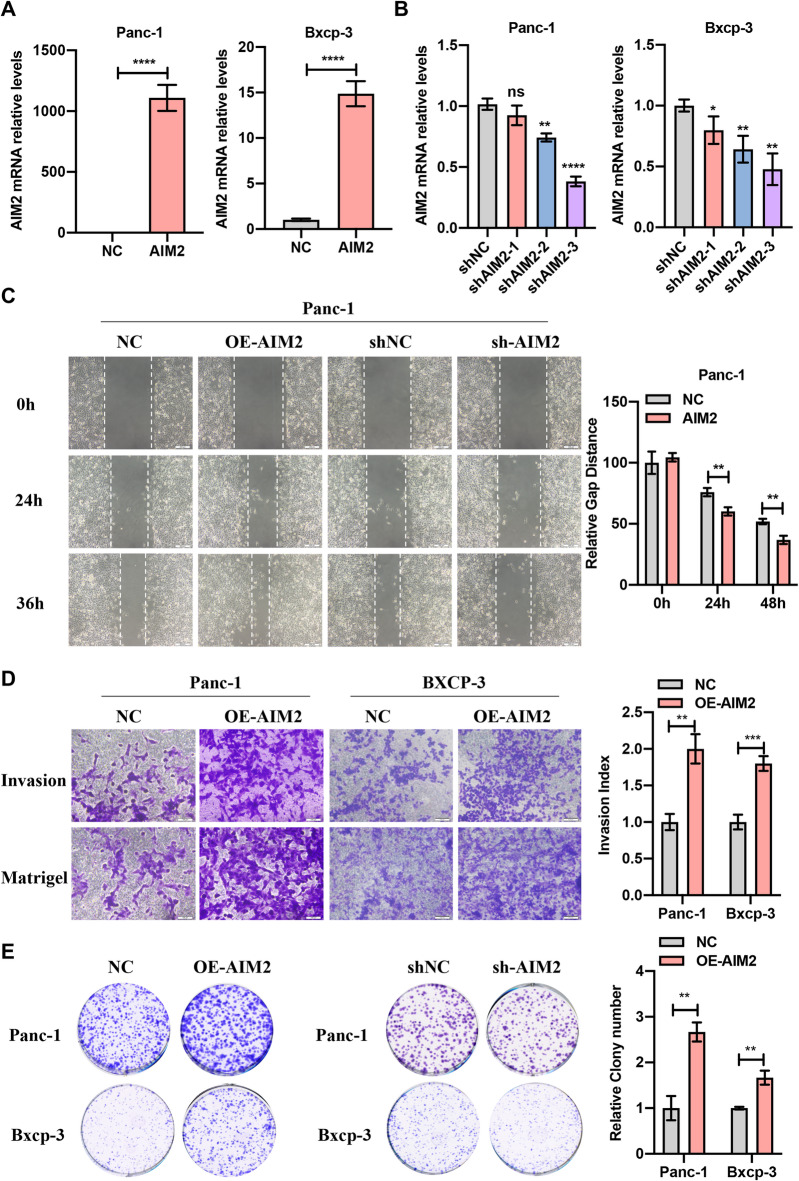
Immune-related factors are closely associated with tumor progression and responses to immunotherapy. A systematic analysis of the immunogenomic landscape and the identification of key immune-related genes (IRGs) can contribute to a better understanding of pancreatic cancer. To identify immune-related genetic prognostic characteristics (IRGPs) of pancreatic cancer, we first constructed an IRGP model containing multiple immune-related genes and determined the relative contributions of each gene using coefficients from the Least Absolute Shrinkage and Selection Operator (LASSO) Cox regression analysis. Subsequently, the prognostic value of the signature was validated through receiver operating characteristic (ROC) curve analysis and Kaplan-Meier survival analysis. Additionally, we explored the potential relationship between IRGPs and immune cell infiltration. Nine gene prognostic features were identified as the optimal IRGPs, which include six high-risk genes and three low-risk genes. Principal Component Analysis (PCA) demonstrated that this feature can effectively distinguish between high-risk and low-risk groups. The area under the curve (AUC) value indicated that IRGPs provide better prognostic clinical utility compared to existing TNM staging classifications. The median overall survival (OS) of high-risk patients was significantly shorter, and the infiltration levels of 24 immune cell types were lower. This study identified nine genes that have been identified as important prognostic biomarkers with immune-related characteristics for pancreatic cancer. Furthermore, we also explored the role of AIM2 in pancreatic cancer among the immune-related signature genes. AIM2 may influence the immune invasion and immunotherapy of pancreatic cancer by promoting the inflammatory environment of pancreatic cancer. AIM2 could be a new therapeutic target for pancreatic cancer.

Keywords: AIM2; Immune infiltration; Immune-related genes; Inflammasome; Pancreatic cancer; Prognostic signature; Tumor microenvironment.


Conflict of interest statement

Declarations. Competing interests: The authors declare no competing interests.

Figures

Fig. 1
Fig. 1
Construction and validation of immune-related genetic prognostic signatures. (A-B) LASSO Cox regression analysis was performed on 35 immune-related genes to refine the selection. (C) Displays the distribution of risk scores among patients. (D) Illustrates the survival status of patients based on the prognostic model. (E) Presents the expression levels of the genes in the TCGA-PAAD cohort. (F-H) Principal Component Analysis (PCA) of the expression distributions for: (F) The prognostic signature genes. (G) The entire immune-related gene set. (H) All genes in the gene expression profile, comparing high-risk and low-risk groups. (I) Univariate Cox proportional hazard regression analyses were conducted with risk Score and various clinicopathological features, including T, N, and M stages, pathological stage, smoking status, gender, and age. (J) Multivariate Cox proportional hazard regression analyses were also conducted with risk Score and the same set of clinicopathological features. (K) The prognostic value of the signature was assessed using the ROC curve analysis. (L) Kaplan-Meier survival analysis of pancreatic cancer patients from the TCGA, stratified by the median risk score.
Fig. 2
Fig. 2
Expression and correlation analysis of IRGPS Genes. (A) Differential expression analysis of the nine IRGPS genes in normal and cancer tissues within the TCGA-PAAD cohort. (B) A Circos plot displaying the inter-correlations among the nine immune genes. (C) Mutation data for the nine immune-related genes were retrieved from the cBioPortal website. (D) Signal pathway enrichment analyses were conducted on the nine genes to identify overrepresented pathways. (E-M) Kaplan-Meier survival analysis for each of the nine immune-related genes in the TCGA-PAAD cohort, assessing their prognostic significance individually.
Fig. 3
Fig. 3
Signal pathway enrichment analysis of differentially expressed genes between high-risk and low-risk groups. (A-B) Identification of differentially expressed genes between the high-risk and low-risk groups. (C) GO analysis focusing on the biological process group. (D) GO analysis focusing on the molecular function group. (E) GO analysis focusing on the cellular component group. (F) KEGG analysis to identify significant pathways. (G) GSEA performed between high-risk and low-risk groups based on the nine-gene signature.
Fig. 4
Fig. 4
Association analysis between IRGPS and tumor immune microenvironment. (A) Patients of the TCGA-PAAD cohort were stratified into high-infiltration and low-infiltration groups based on immune cell infiltrate levels. (B) Detection of differences in the abundance of 24 immune cell types between the high-risk and low-risk groups. (C) Analysis of inter-correlations between the 24 immune cell types in the pancreatic cancer microenvironment. (D) Investigation of correlations between the expression of IRGPS genes and the abundance of 24 immune cell types using Pearson coefficients in pancreatic cancer.
Fig. 5
Fig. 5
AIM2 enhances proliferation, migration, and invasion of pancreatic cancer cells. (A) qRT-PCR assessment of AIM2 overexpression efficiency in pancreatic cancer cells. (B) qRT-PCR assessment of AIM2 knockdown efficiency in pancreatic cancer cells. (C) Scratch assay conducted in pancreatic cancer Panc-1 cells: Left panel: Representative image of the scratch assay. Right panel: Statistical results of the scratch assay following AIM2 overexpression. **, P < 0.01, experiment repeated three times. (D) Transwell invasion and migration analysis in pancreatic cancer Panc-1 and Bxcp-3 cells: Left panel: Representative images of the Transwell invasion and migration experiments. Right panel: Statistical results of the Transwell invasion experiment. **, P < 0.01, ***, P < 0.001, experiment repeated three times. (E) Colony formation assay in pancreatic cancer Panc-1 and Bxcp-3 cells: Left panel: Representative image of the colony formation assay. Right panel: Statistical results of the colony formation assay following AIM2 overexpression. **, P < 0.01, experiment repeated three times.
Fig. 6
Fig. 6
AIM2 induces inflammatory responses. (A-C) ELISA kits were utilized to measure the levels of IL-18, HGMB1, and IL-1β: (A) Detection results for IL-1β. (B) Detection results for HGMB1. (C) Detection results for IL-18. (D) Western blot assay was conducted to assess the expression levels of AIM2, NLRP3, Pro-Caspase-1, and Cleaved-Caspase-1 proteins following AIM2 overexpression or knockdown, with GAPDH serving as an internal control.
Fig. 7
Fig. 7
AIM2 enhances pancreatic cancer progression via the inflammasome pathway. (A) ELISA kits were employed to measure the levels of IL-18, HGMB1, and IL-1β. (B) Scratch assay conducted in pancreatic cancer Panc-1 cells: Left panel: Representative image of the scratch assay. Right panel: Statistical results of the scratch assay. *, P < 0.05, experiment repeated three times. (C) Transwell invasion and migration analysis in pancreatic cancer Panc-1 and Bxcp-3 cells: Left panel: Representative images of Transwell invasion and migration experiments. Right panel: Statistical results of Transwell invasion and migration. **, P < 0.01, ns indicates not significant, experiment repeated three times. (D) Colony formation experiment in pancreatic cancer Panc-1 and Bxcp-3 cells: Presented is a representative image of the colony formation experiment. The experiment was repeated three times.

Similar articles

References

    1. Siegel, R. L., Miller, K. D., Fuchs, H. E. & Jemal, A. Cancer statistics, 2021. CA Cancer J. Clin.71, 7–33 (2021). - PubMed
    1. Lin, Y. et al. Genome-wide association meta-analysis identifies GP2 gene risk variants for pancreatic cancer. Nat. Commun.11, 3175 (2020). - PMC - PubMed
    1. Stoffel, E. M., Brand, R. E. & Goggins, M. Pancreatic cancer: changing epidemiology and new approaches to risk assessment, early detection, and prevention. Gastroenterology164, 752–765 (2023). - PMC - PubMed
    1. Karamitopoulou, E. Emerging prognostic and predictive factors in pancreatic Cancer. Mod. Pathol.36, 100328 (2023). - PubMed
    1. Balaban, E. P., Mangu, P. B. & Yee, N. S. Locally advanced unresectable pancreatic cancer: American society of clinical oncology clinical practice guideline summary. J. Oncol. Pract.13, 265–269 (2017). - PubMed

LinkOut - more resources