. 2025 Aug 13;15(1):29631.
doi: 10.1038/s41598-025-14187-6.

Mechanodynamic brain on chip for studying human stem cell derived neuronal networks

Affiliations

Mechanodynamic brain on chip for studying human stem cell derived neuronal networks

Gulden Akcay et al. Sci Rep. .

Abstract

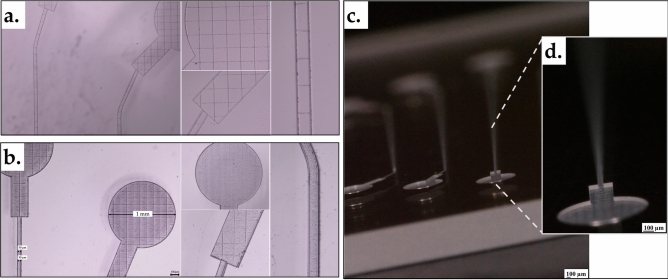
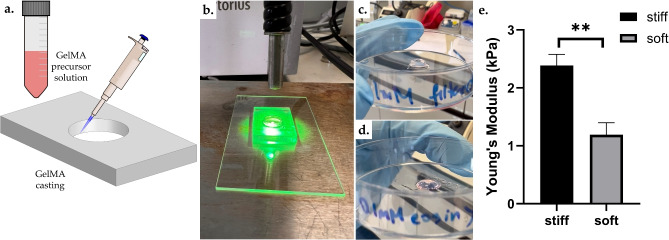
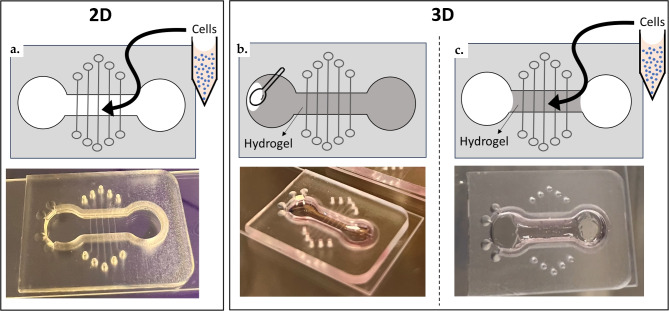
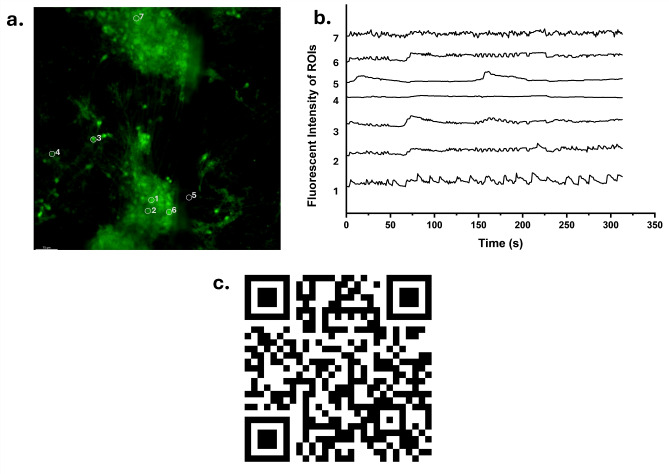
Brain tissue orchestrates neuronal function through biochemical and mechanical cues. Utilizing in vitro modeling, often the dynamics of mechanical aspects in neuronal cell cultures is neglected. However, the growing recognition of the importance of mechanical cues in neural development and healthy brain function necessitates a shift in how we study cultured neurons. Microfluidic platforms, like a Brain-on-Chip (BoC), can take active mechanical stimuli into account. In our BoC design a set of microchannels manufactured in a glass substrate by FEMTOprint technology is assembled with a spin-coated polydimethylsiloxane (PDMS) membrane and a PDMS culture chamber, which was fabricated from a stereolithographically made mold by replication. The membrane can locally deform across the culture chamber by air pressure. This paper describes the design, fabrication and test of such a novel BoC, offering an experimental setting in which we demonstrated mechano-dynamic elevated Calcium signaling in cultured human induced neural stem cell-derived neuronal networks.

Keywords: Brain-on-Chip (BoC); Calcium live imaging; HiPSCs-derived neurons; Mechanical stimulation; Neuronal activity.


Conflict of interest statement

Declarations. Competing interests: The authors declare no competing interests.

Figures

Fig. 1
Fig. 1
Channel design overview in Alphacam software. (a) Schematic design of the channels in Alphacam, illustrating the dimensional layout of the microfluidic pneumatic pressure-driven channels. (b) Toolpath view, showing the sequence of movements by the laser beam tool for producing the desired geometry. (c) 3D view of the channel layer in Alphacam with cross-sectional view of the channels. (d) Full movie of the channel fabrication simulation in Alphacam, accessible via embedded QR code.
Fig. 2
Fig. 2
Channel fabrication process. (a) Femtosecond laser-machined channels and their inlets/outlets prior to wet etching. (b) Channels (50 formula imagem) and inlets/outlets (1 mm diameter) after KOH etching, displaying the final structure and confirming successful 3D printing. (c) formula image angled view of the femtosecond laser-fabricated 3D channel structure on a fused silica glass captured using the digital microscope. (d) Zoomed-in view of (c).
Fig. 3
Fig. 3
Schematic of deformation in the membrane. b: the original width of the channel, b’: the width of deformation, r: radius of the arc, formula image: the height of deformation.
Fig. 4
Fig. 4
Mechanical stimulation via pneumatic actuation: design, set-up, and visualization. (a) Overview of the mechanical stimulation set-up. (b) BoC and air tubing connection. (c) Air flow on channel 1 and (d) air flow on channel 4. (e) QR code linking to the full video of the mechanical stimulation.
Fig. 5
Fig. 5
Schematic design of the BoC without (a) and with (c) a pneumatic pressure. View of the microfluidic channel with and without pressure applied with the lens tilted at a formula image viewing angle, visualized with blue dye (b, d). The white dashed line (b) represents the membrane without pressure, while the white dashed arc (d) demonstrates the membrane under pressure.
Fig. 6
Fig. 6
Hydrogel Young’s modulus measurement. (a) Representative image showing the GelMA precursor cast into a PDMS mold with one ring, shaping the gel. (b) GelMA photopolymerization process. Pictures of the (c) stiff and (d) soft GelMA hydrogels after polymerization. (e) Young’s modulus of GelMA hydrogels plotted in GraphPad Prism 10.3 (Two tailed, unpaired t test, **p < 0.05, n = 3).
Fig. 7
Fig. 7
The schematic illustration, along with corresponding images, shows (a) the setup of 2D cell culture, and (b, c) the detailed process of GelMA hydrogel integration into the BoC system for 3D cell culture. Following in-chip polymerization of the hydrogel (1.1 kPa), the reservoirs are cleared of the gel, and cells are subsequently seeded on-top of the linker channel.
Fig. 8
Fig. 8
Calcium imaging and analyses workflow. (a) Schematic of the experimental strategy for culturing and imaging human induced pluripotent stem cell hiPSC-derived neurons. (b) Time-series images of 2D neuronal cell cultures showing formula image waves at different time points, extracted from video recordings. The dashed lines indicate the underlying microchannel location. White arrows mark neurons undergoing formula image flux, indicated by changes in fluorescence intensity under mechanical stimulation. A full movie is accessible via the QR code. (c) formula image imaging of 2D cultured neuronal cells (DIV 21) loaded with a formula image indicator. Dashed lines indicate the microchannel position underneath. White circles highlight regions of interest (ROIs) where fluorescence intensity was monitored. (d) formula image activity profiles of selected cells, corresponding to the ROIs in (c). The red dashed line marks the time point when the stimulus was introduced. (e) Time-series images of a 3D neuronal network (cells extending in 3D via a gel layer), activated by chip stimulation. Images are extracted from video recordings of the observed formula image wave at different time points. White arrows and dashed lines indicate the underneath microchannel, white arrows displaying neuronal cell firing that were undergoing a formula image flux, revealed by the change of the fluorescence intensity under mechanical stimulation. The full movie is accessible via the QR code. (f) formula image imaging of 3D-like neuronal cells, with ROIs marked by white circles. (g) formula image activity profiles of selected cells, corresponding to the ROIs in (f). The red dashed line marks the time point when the stimulus was introduced. Scale bars: 75 formula imagem.
Fig. 9
Fig. 9
Calcium imaging and analysis workflow without stimulation. (a) formula image imaging of 2D cultured neuronal cells at DIV 21, loaded with a calcium indicator, and observed without mechanical stimulation. Image is extracted from video recording of the observed formula image wave. White circles highlight regions of interest (ROIs) where fluorescence intensity was monitored. (b) formula image activity profiles of selected cells, corresponding to the ROIs in (a). (c) The full movie is accessible via the QR code. Scale bar: 75 formula imagem.
Fig. 10
Fig. 10
Comparison of average Ca2+ fluorescence in 2D BoC before (pre-) and after (post-) stimulus application at DIV21. Statistical analysis was performed using an unpaired two-tailed t-test (*p < 0.0001, n = 30) in GraphPad Prism.
Fig. 11
Fig. 11
Overview of hiPSC-derived neuron cultures in 2D (a) and 3D (f) BoC models on day 21. Hydrogels were removed from the reservoirs in the 3D BoC cultures. Co-localization of the post-synaptic marker HOMER-1 (c, h) and the pre-synaptic marker SYN1/2 (d, i) on axons. (e, j) All neuronal markers visualized together in panels (e) and (j). Neurons are labeled with SMI312 (axonal marker, orange), MAP2 (soma-dendritic marker, green), SYN1/2 (pre-synaptic marker, red), and HOMER-1 (post-synaptic marker, blue). Scale bars: 100 formula imagem. (k) Schematic illustration of synapse (created with Biorender). (l) Statistical comparison between 2D BoC and 3D BoC groups was performed using an unpaired two-tailed t-test (*p < 0.05, n=17) by GraphPad Prism.
Fig. 12
Fig. 12
Illustration of immunofluorescence images of both 2D (a) and 3D (d) neuronal cultures to show differences in axonal sprouting and organization. (b, c) Zoomed image of a and (f, g) Zoomed image of (d). (SMI312: yellow, MAP2: green). Scale bars: 100 formula imagem.
Fig. 13
Fig. 13
Schematic representation of the BOC fabrication process. The reservoir layer, designed to contain the cellular medium, is formed using SLA-based 3D printing for mold creation, followed by PDMS replica molding. A 10 formula imagem-thick membrane layer is deposited via precision spin coating. The channel layer is fabricated on a fused silica glass substrate through femtoprinting technology, incorporating femtosecond laser micromachining and subsequent wet etching to define the microchannel structures.
Fig. 14
Fig. 14
Overview of the BoC fabrication process in real time/world. (a) Reservoir Layer, (b) Reservoir and membrane layer assembly. (c) femtoprinted underneath channels in fused silica glass. (d, e) laser cut PMMA sheet with in-outlets with a 1mm puncher to make hole for in-outlets in the chip. (fh) Final BoC from different angles.

Similar articles

References

    1. Guo, T., Ren, P., Hao, S. & Wang, B. The underestimated role of mechanical stimuli in brain diseases and the related in vitro models. Curr. Pharmaceutical Design. 23 (2016). - PubMed
    1. Koser, D. E. et al. Mechanosensing is critical for axon growth in the developing brain. Nat. Neurosci.19, 1592–1598 (2016). - PMC - PubMed
    1. Chicurel, M. Cell migration research is on the move. Science295, 606–609 (2002). - PubMed
    1. Tyler, W. J. The mechanobiology of brain function. Nat. Rev. Neurosci.13, 867–878 (2012). - PubMed
    1. Cipolla, M. J. Control of cerebral blood flow. in The Cerebral Circulation. (Morgan & Claypool Life Sciences, 2009). - PubMed

LinkOut - more resources