. 2025 Aug 13;15(1):29768.
doi: 10.1038/s41598-025-15082-w.

Multidimensional pan cancer analysis of the sodium induced cell death gene TRPM4

Affiliations

Multidimensional pan cancer analysis of the sodium induced cell death gene TRPM4

Yonggang Dai et al. Sci Rep. .

Abstract

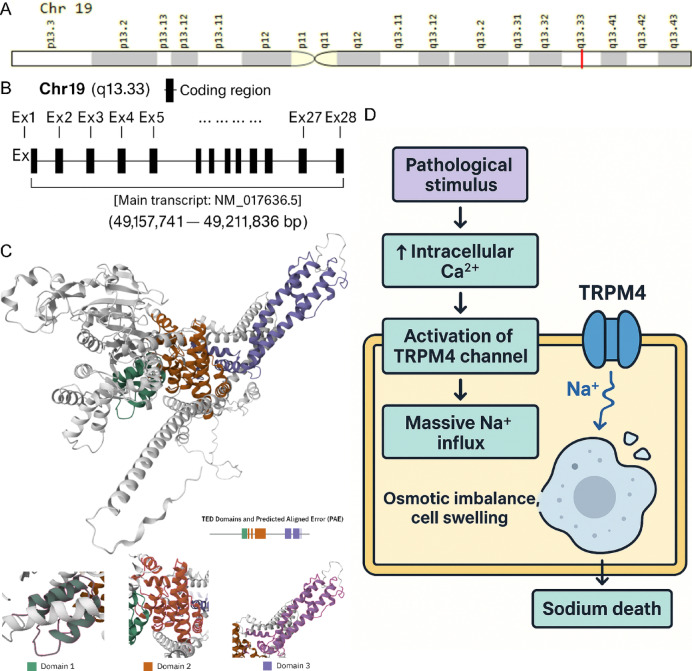
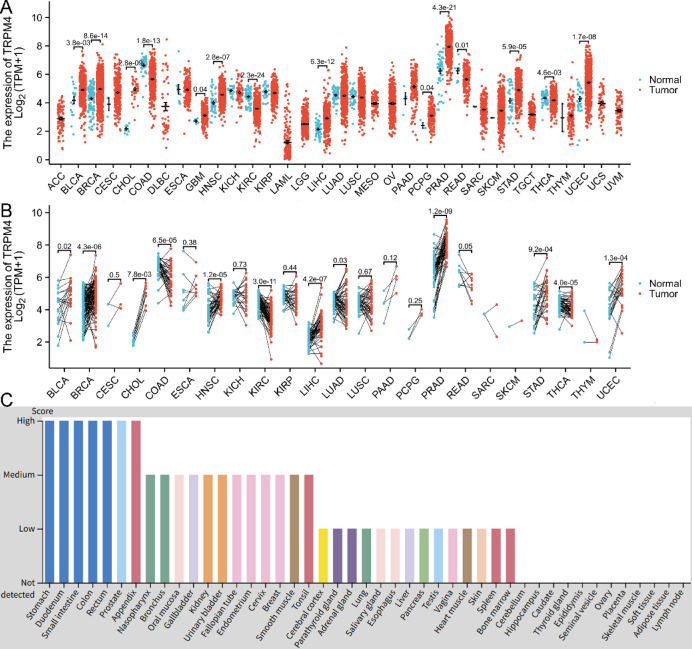
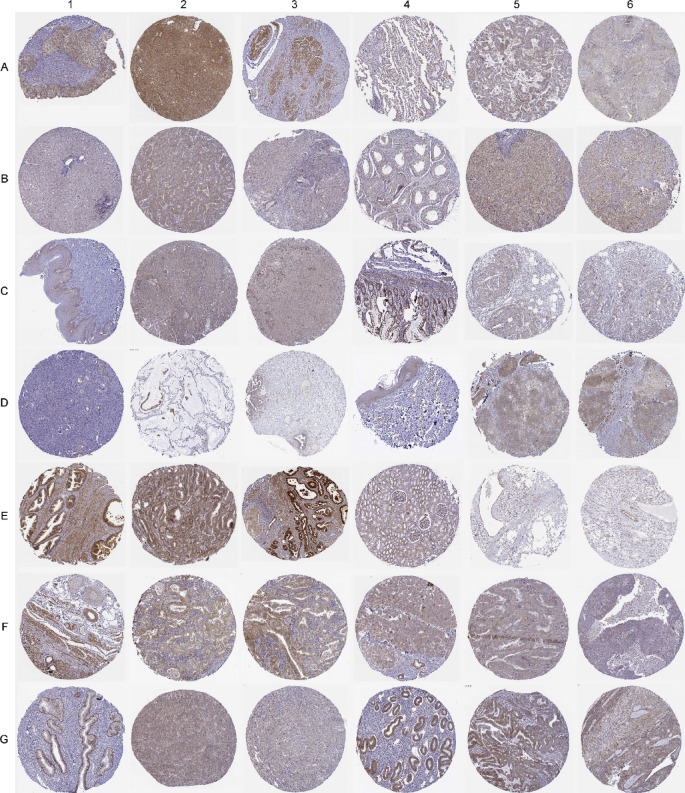
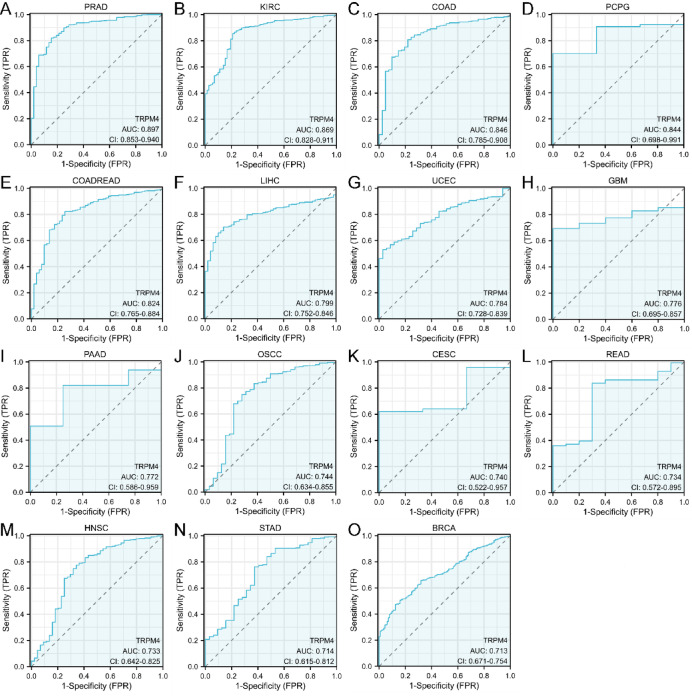
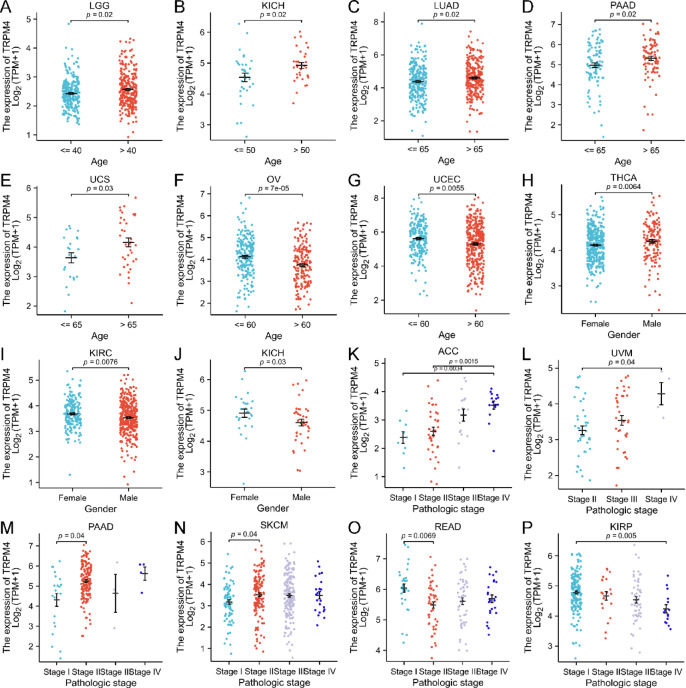
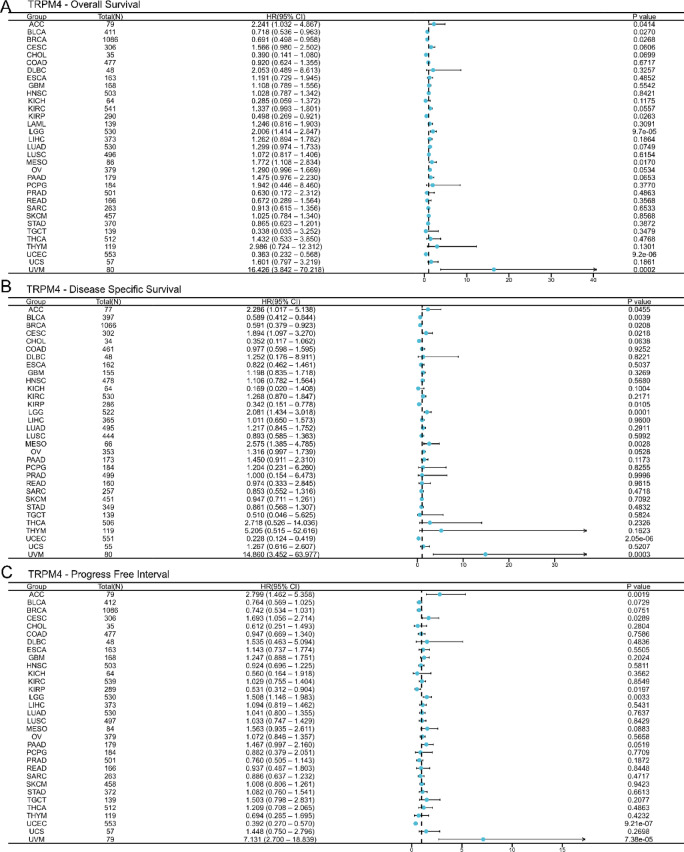
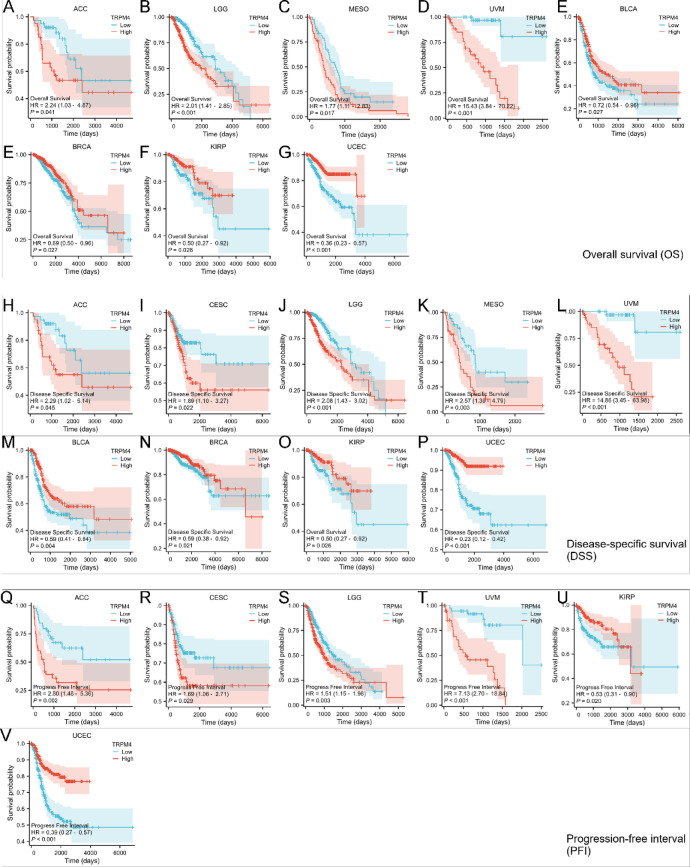
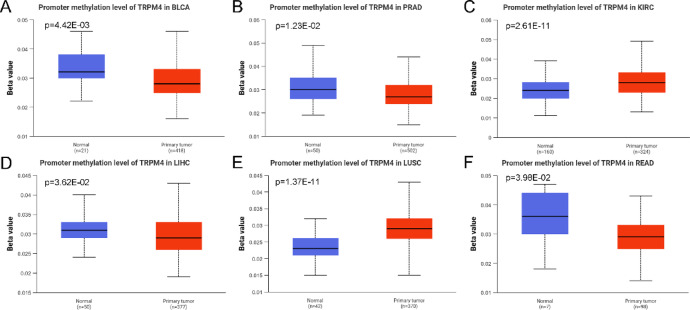
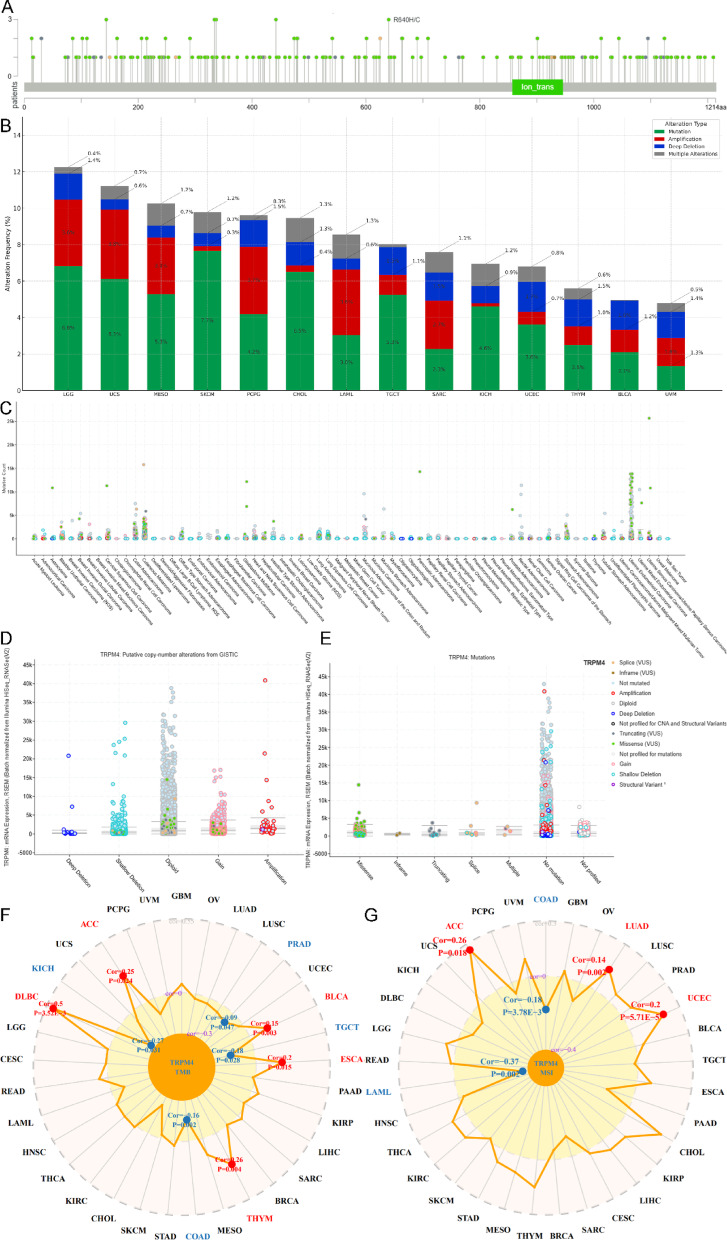
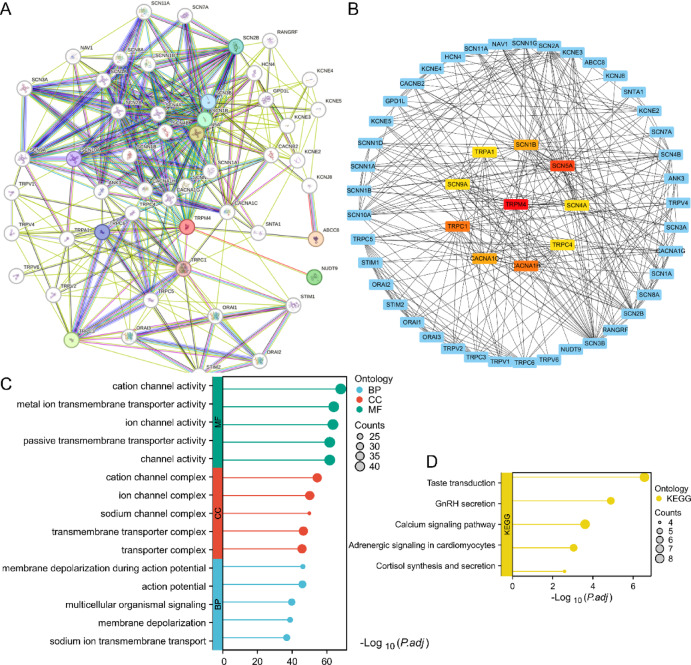
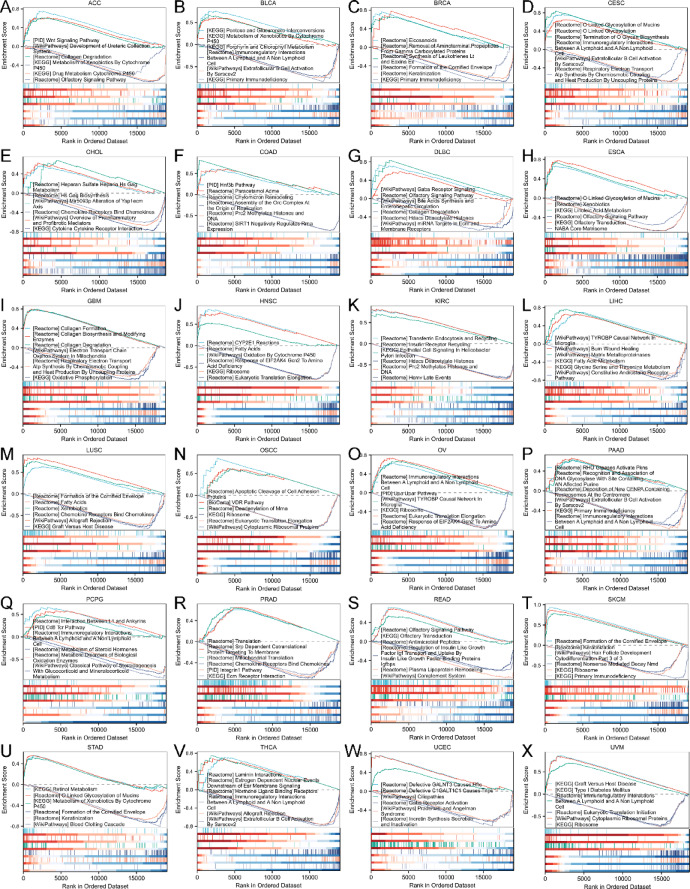
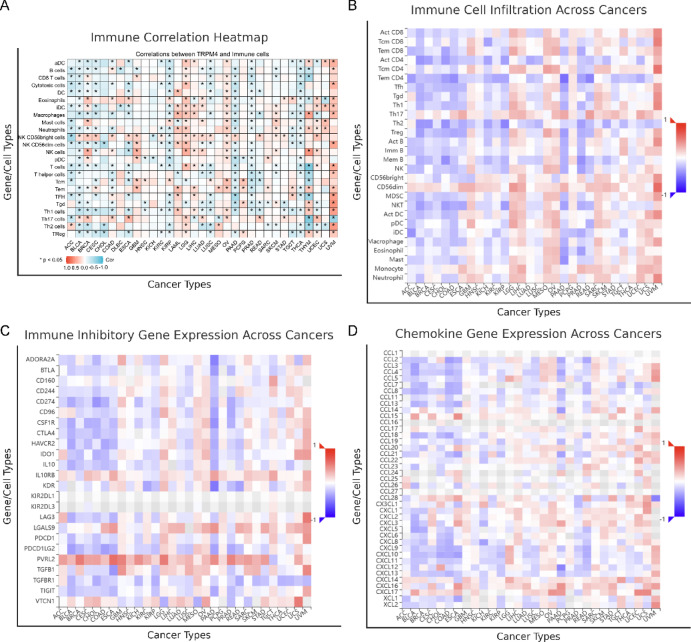
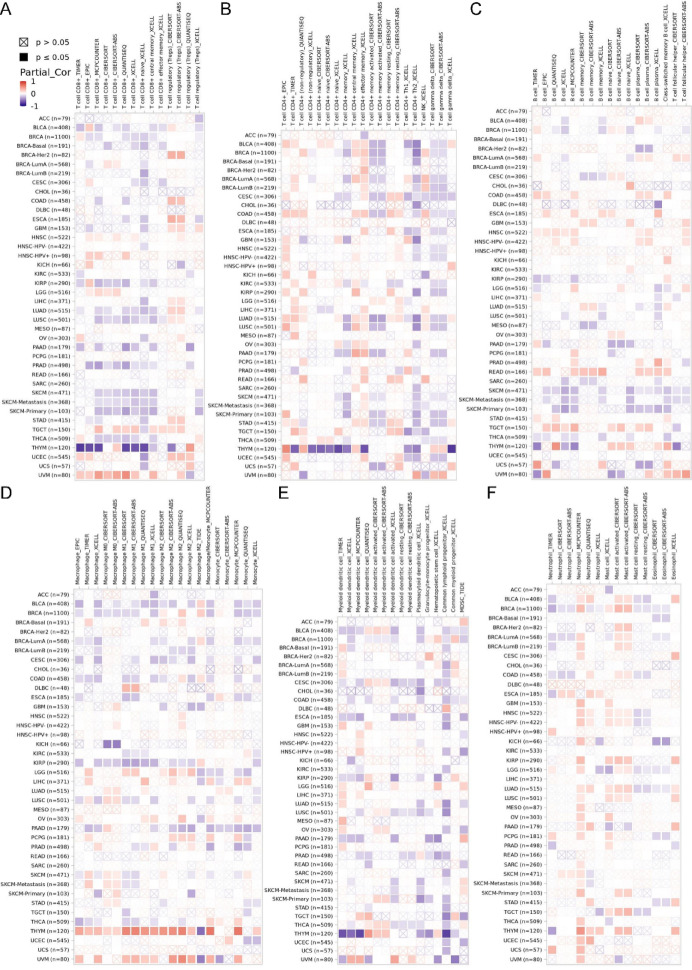
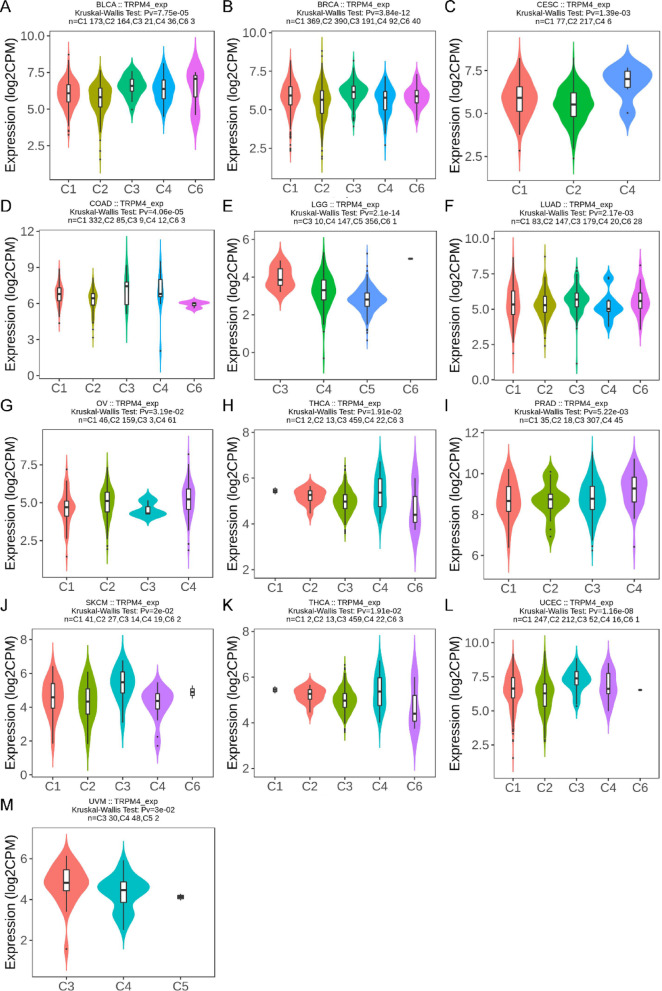
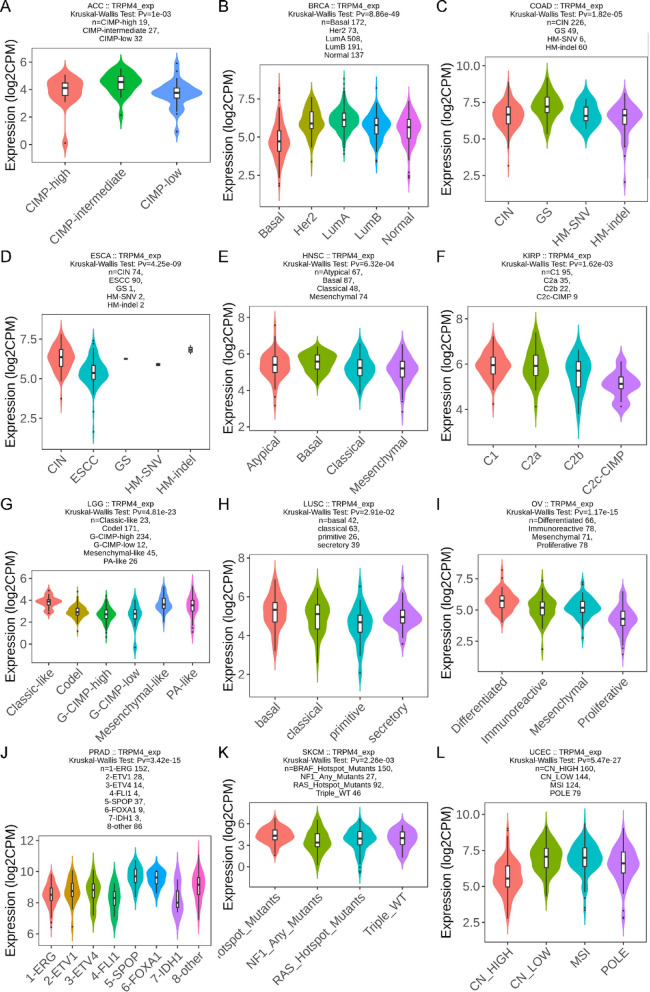
Cell death modalities play crucial roles in cancer evolution and therapeutic responses. Among various mechanisms, necrosis by sodium overload (NECSO) is a newly recognized process initiated by disruptions in Na+ homeostasis, manifesting through osmotic stress, energy depletion, and immunogenic damage. The TRPM4 gene, which encodes a calcium-activated and sodium-selective ion channel, has surfaced as a significant regulator connecting ionic metabolism with oncogenic pathways. Given these insights, our study aims to comprehensively analyze the expression and implications of TRPM4 across diverse cancer types to elucidate its potential as a biomarker and therapeutic target. We conducted a systematic investigation of TRPM4 across 33 cancer types defined by the Cancer Genome Atlas (TCGA), integrating transcriptomic, proteomic, epigenetic, and clinical datasets from TCGA, GTEx, and Human Protein Atlas (HPA). We employed differential expression analyses, receiver operating characteristic (ROC) curves, and survival analyses, alongside mutation and methylation assessments. Furthermore, we explored TRPM4's immunological aspects through immune infiltration analyses. Our analyses revealed significant TRPM4 overexpression in several tumors, such as bladder (BLCA), cholangiocarcinoma (CHOL), and ovarian cancer (OV), whilst being downregulated in others like kidney clear cell carcinoma (KIRC) and lung adenocarcinoma (LUAD). Notably, TRPM4 expression correlated with overall survival, disease-specific survival, and progression-free interval, highlighting its prognostic value. Furthermore, promoter methylation and mutation patterns elucidated the mechanisms underlying TRPM4 dysregulation, and immune infiltration analyses suggested its involvement in tumor immune evasion. This investigation highlights TRPM4's dual role in mediating sodium-induced cell death and modulating the tumor microenvironment, proposing it as a potential biomarker for cancer diagnosis and prognosis, though its association with demographic and pathological characteristics appears limited and tumor-type specific. Given its import in various malignancies and potential therapeutic implications through ion channel-focused strategies, TRPM4 warrants further exploration as a target for precision oncology.

Keywords: Immune evasion; Ion channels; Pan-cancer analysis; Sodium-induced cell death (NECSO); TRPM4; Tumor microenvironment.


Conflict of interest statement

Declarations. Competing interests: The authors declare no competing interests.

Figures

Fig. 1
Fig. 1
Genomic location, structural characteristics, and mechanism of TRPM4-mediated sodium-induced cell death (NECSO). (A) Ideogram representation of human chromosome 19, highlighting the cytogenetic location of TRPM4 at q13.33. (B) Schematic of the TRPM4 gene structure showing its coding region across 28 exons, with the main transcript NM_017636.5 and genomic coordinates (49,157,741–49,211,836 bp). (C) Structural depiction of the TRPM4 α-subunit illustrating distinct domains color-coded, whose precise functions remain incompletely characterized. (D) Flowchart summarizing the mechanism of sodium-induced cell death (NECSO). Pathological stimuli increase intracellular Ca2+ levels, activating the TRPM4 channel and resulting in significant Na+ influx. The subsequent osmotic imbalance leads to cell swelling, rupture, and ultimately sodium-induced necrotic cell death.
Fig. 2
Fig. 2
Multi-cohort analysis of TRPM4 mRNA and protein expression across cancers. (A) Differential TRPM4 mRNA expression between tumor and normal tissues across 33 cancer types using batch-corrected TCGA and GTEx data. (B) TRPM4 mRNA expression in paired tumor and adjacent normal tissues from TCGA. (C) Protein expression of TRPM4 in normal human tissues according to the Human Protein Atlas (HPA), displayed as categorical intensity scores. Significance determined by Wilcoxon test with Benjamini-Hochberg.
Fig. 3
Fig. 3
Immunohistochemical expression of TRPM4 in tumor and normal tissues. English: Representative immunohistochemical images of TRPM4 from the HPA database, comparing protein expression between tumor and matched normal tissues across multiple cancer types. The first and fourth columns represent normal tissues. See Table S1 for detailed cancer types and scoring.
Fig. 4
Fig. 4
Diagnostic accuracy of TRPM4 in pan-cancer by ROC analysis. (AE) ROC curves of TRPM4 expression in cancers with high diagnostic efficacy (AUC > 0.8). (FO) ROC curves in cancers with moderate diagnostic value (0.6 < AUC ≤ 0.8). AUC: area under the curve; computed using TCGA and GTEx datasets.
Fig. 5
Fig. 5
Association of TRPM4 expression with demographic and clinicopathological factors. (AG) Association of TRPM4 mRNA expression with age in selected cancer types. (HJ) Differences in TRPM4 expression between male and female patients. (KP) TRPM4 expression across pathological stages (I–IV); comparisons limited to tumor types with ≥ 5 samples per stage. Statistical significance determined by Wilcoxon or Kruskal–Wallis test with FDR correction.
Fig. 6
Fig. 6
Prognostic significance of TRPM4 in pan-cancer. Forest plots summarizing multivariate Cox regression results for TRPM4 expression in relation to (A) overall survival (OS), (B) disease-specific survival (DSS), and (C) progression-free interval (PFI) across TCGA cancers.Patients were stratified by median TRPM4 expression; covariates included age, gender, and stage.Hazard ratios (HR), 95% confidence intervals, and FDR-adjusted p-values are shown.
Fig. 7
Fig. 7
Kaplan–Meier survival curves for TRPM4 in representative cancers Kaplan–Meier curves of (AG) overall survival (OS), (HP) disease-specific survival (DSS), and (QV) progression-free interval (PFI) comparing TRPM4 high vs. low expression groups (median cutoff) in select cancer types. Shaded regions represent 95% confidence intervals. Log-rank p-values provided.
Fig. 8
Fig. 8
Promoter methylation analysis of TRPM4 across cancers. (A–G) (A–F) Boxplots showing TRPM4 promoter methylation levels (beta values) in tumors and normal tissues for six representative cancers using UALCAN. Wilcoxon test applied; FDR-corrected p-values are shown. (A) BLCA, (B) PRAD, (C) KIRC, (D) LIHC, (E) LUSC, (F) READ.
Fig. 9
Fig. 9
Landscape of TRPM4 mutations and correlation with genomic instability. (A) Lollipop plot showing the distribution and frequency of TRPM4 mutations across cancers; R640H/C is the most frequent site. (B) Proportion of mutation types (missense, truncating, etc.) in TRPM4 across pan-cancer samples. (C) Frequency of TRPM4 mutations in each cancer type; UCEC, SKCM, and UCS exhibit highest rates. (D) Association between TRPM4 mRNA expression and copy-number alterations; dot colors indicate mutation type. (E) Summary of mutation subtypes in TRPM4. (F) Radar plot of Spearman correlation between TRPM4 expression and tumor mutational burden (TMB); (G) Radar plot of Spearman correlation between TRPM4 expression and microsatellite instability (MSI).Red lines: positive correlation; blue lines: negative correlation; correlation coefficients are labeled.
Fig. 10
Fig. 10
Functional enrichment and protein–protein interaction analysis of TRPM4-related genes. (A) Protein–protein interaction (PPI) network of the top 50 TRPM4-associated genes, constructed using STRING (confidence > 0.75). (B) Identification of hub genes within the TRPM4 PPI network using cytoHubba. (C) GO enrichment analysis: key biological processes and molecular functions of TRPM4-associated genes. (D) KEGG pathway analysis: major signaling pathways related to TRPM4 and sodium-induced cell death.Statistical significance set at FDR < 0.05.
Fig. 11
Fig. 11
Gene set enrichment analysis (GSEA) of TRPM4 in multiple cancers. (AX) GSEA plots of TRPM4-associated pathways in representative cancer types, including Ca2+-Na+ crosstalk, Wnt/β-catenin signaling, OXPHOS regulation, immune checkpoint, and ECM remodeling. (A) ACC, (B) BLCA, (C) BRCA, (D) CESC, (E) CHOL, (F) COAD, (G) DLBC, (H) ESCA, (I) GBM, (J) HNSC, (K) KIRC, (L) LIHC, (M) LUSC, (N) OSCC, (O) OV, (P) PAAD, (Q) PCPG, (R) PRAD, (S) READ, (T) SKCM, (U) STAD, (V) THCA, (W) UCEC, (X) UVM. Enrichment results with FDR < 0.05 and |NES|> 2.0 were considered significant. Gene sets derived from MSigDB v7.5.1.
Fig. 12
Fig. 12
Correlation heatmaps of TRPM4 expression and tumor immune microenvironment. (AB) Heatmaps showing TRPM4 expression correlation with immune cells. (C) Heatmap of correlations with chemokines. (D) Heatmap of correlations with immune checkpoint genes. Red indicates positive correlation; blue indicates negative correlation; values range from –1 to 1. All p-values FDR-adjusted.Rows/columns are clearly labeled; *p < 0.05.
Fig. 13
Fig. 13
Specific immune cell subtype analysis related to TRPM4 by multiple algorithms. (A) CD8+ T cells; (B) CD4+ T cells; (C) B cells. (D) Macrophages and monocytes. (E) Myeloid and plasmacytoid dendritic cells, granulocyte-monocyte progenitors, hematopoietic stem cells, common lymphoid progenitors, and MDSCs. (F) Neutrophils, mast cells, and eosinophils. (AC) Correlation between TRPM4 expression and CD8+ T cells, CD4+ T cells, and B cells. (D) Correlation with macrophages and monocytes. (E) Association with dendritic cells and hematopoietic progenitors. (F) Correlation with granulocytes, mast cells, and eosinophils. Results represent the mean Spearman correlation across multiple immune deconvolution algorithms (TIMER, EPIC, CIBERSORT), with 95% CI. All statistical significance tested at FDR < 0.05. See Supplementary Table S2 for algorithmic and parameter details.
Fig. 14
Fig. 14
TRPM4 expression across immune subtypes in pan-cancer (AM) Expression of TRPM4 in immune subtypes of (A) BLCA, (B) BRCA, (C) CESC, (D) COAD, (E) LGG, (F) LUAD, (G) OV, (H) THCA, (I) PRAD, (J) SKCM, (K) THCA, (L) UCEC, (M) UVM. Subtype annotation: C1 (wound healing), C2 (IFN-γ dominant), C3 (inflammatory), C4 (lymphocyte-depleted), C5 (immunologically quiet), C6 (TGF-β dominant). Boxplots display median and interquartile range; Kruskal–Wallis test used for comparison.
Fig. 15
Fig. 15
TRPM4 expression across molecular subtypes in pan-cancer. (AL) Differential TRPM4 expression across molecular subtypes of (A) ACC, (B) BRCA, (C) COAD, (D) ESCA, (E) HNSC, (F) KIRP, (G) LGG, (H) LUSC, (I) OV, (J) PRAD, (K) SKCM, (L) UCEC. Molecular subtypes defined by TCGA/ICGC. Statistical comparisons performed by Kruskal–Wallis test with FDR correction.

References

    1. Balaji, S., Terrero, D., Tiwari, A. K., Ashby, C. R. Jr. & Raman, D. Alternative approaches to overcome chemoresistance to apoptosis in cancer. Adv. Protein Chem. Struct. Biol.126, 91–122. 10.1016/bs.apcsb.2021.01.005 (2021). - PubMed
    1. AbdulHussein, A. H. et al. Mechanisms of cancer cell death induction by triptolide. BioFactors49, 718–735. 10.1002/biof.1944 (2023). - PubMed
    1. Cai, J., Xu, X. & Saw, P. E. Nanomedicine targeting ferroptosis to overcome anticancer therapeutic resistance. Sci. China Life Sci.67, 19–40. 10.1007/s11427-022-2340-4 (2024). - PubMed
    1. Fu, W. et al. Persistent activation of TRPM4 triggers necrotic cell death characterized by sodium overload. Nat. Chem. Biol.10.1038/s41589-025-01841-3 (2025). - PubMed
    1. Rajamanickam, G., Hu, Z. & Liao, P. Targeting the TRPM4 channel for neurologic diseases: Opportunity and challenge. Neuroscientist10.1177/10738584251318979 (2025). - PubMed

LinkOut - more resources